The trend is backtracking.
Author: The Little Dream, Created: 2017-05-03 10:43:49, Updated: 2019-07-31 18:34:37Multi-headed trends back to the strategy of stepping on the brakes
-
A. Theoretical explanation of the multi-headed trend retracement strategy
-
What is a multi-headed trend?
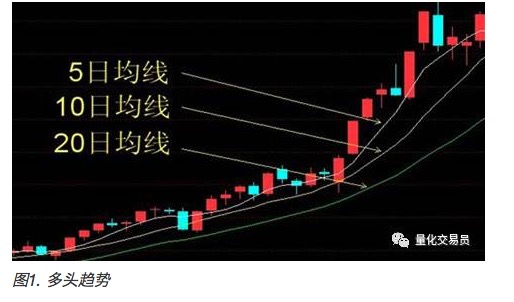
To understand the multi-head trend, the first thing to know is the median. The median refers to the sum of the closing prices over a period of time divided by the average value obtained by the cycle, such as the 5-day median (MA5), 10-day median (MA10) and so on.
Short-term trend averages are the result of capital voting and can reflect investors' short-term investment intentions.
A bullish multi-headed trend is a trend from a short to a long moving average line, arranged from top to bottom, as shown in the figure below. In a bullish multi-headed trend, the stock price tends to rise. The opposite is called a blank head, where the stock price is in a downtrend.
-
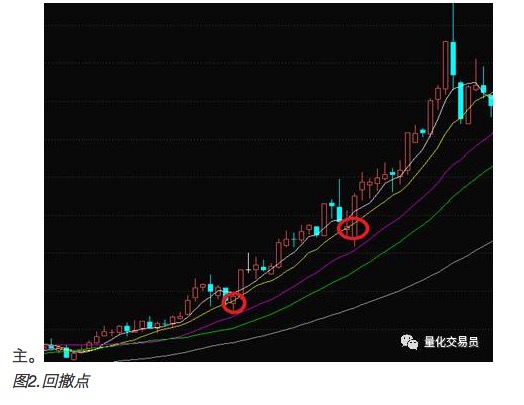
Point of withdrawal:
According to the theory of multi-headed trend retracement points: the multi-headed trend is the basis of the judgment on which the stock can be bought, while the retracement point indicates the time of purchase of the stock.
A pullback point refers to a temporary decline in the price of a stock due to a temporary adjustment of the stock price caused by a breakdown of the line investor after the gain. According to the theory of the pullback point, if the pullback trend can still be maintained, the stock will remain in the long run in a bearish condition.
-
-
Second, quantify the strategy.
Once you understand the strategy of pulling back, in practice, there are some specific quantifiable details of the strategy that determine the operability and benefits of the strategy.
-
1, parameters in the policy Select
(1) The parameters in the buy signal:
A withdrawal point parameter:
When the stock price retracts to what extent is it more reliable to buy to get more returns? For example, 5% or 10%, or the retracement point touches the 5-day average line, the 10-day average line, etc.
B is the number of days of the multiheaded trend T:
The difference in the number of days can be used to reliably judge the trend of multiple heads.
Or can you choose to buy stocks based on the trends of the multi-head, while there is no reversal of the phenomenon?
(2) Parameters in the sell signals (stop loss signals and stop loss signals):
A multi-headed retracement strategy may not guarantee a return; it can be set to produce a signal to move positions under certain conditions, which is more likely to guarantee a return.
The parameter of the stop loss point C:
Different types of stop-loss stop-loss signals can be set, such as setting a stop-loss stop-loss point of a certain percentage, or changing positions when a certain change in the multi-head trend occurs.
(3) Optimization of the parameters:
Multiple combinations of parameters can be used to simulate a large number of transactions, and based on the results of the simulation, a combination of parameters that performs better for the historical market can be created.
Of course, the stock market is constantly changing, and there is no guarantee that the specific parameters that have been developed in a particular historical sector will be applicable in the future.
-
-
Third, the implementation of the analogue trading strategy
-
1, data is ready
A stock's historical day-to-day data + data on the re-authorization factor.
-
2, Trading strategies and parameters:
(1) Definition of drawdown point: The opening price of the stock is below the 10-day average line price
Opening price < 10 days average price (close price)
Multi-headed definition: 5 days, 10 days, 20 days, 60 days mean line decreases in order
Average price for 5 days> Average price for 10 days> Average price for 20 days> Average price for 60 days
-
(2) Stop-loss and stop-loss criteria: Stop-loss and stop-loss when the stock has a gain of more than 10% between the closing price and the purchase price: abs (buy price - opening price of the day) / buy price > 10%.
abs ((opening price - purchase price) / purchase price > 10)
-
3 The transaction process
(1) The date set for the end of the transaction:
(2) On the commencement date of the transaction, in accordance with the above-mentioned stock option strategy, 20 shares shall be selected from the shares listed on that date and 1000 shares shall be purchased at the opening price of each share as a holding;
(3) The following day begins each trading day by selling the shares in accordance with the stop-loss and stop-loss criteria, assuming the sale at the opening price, and the proceeds of the sale as available funds; and at the same time, according to the stock option strategy, select a certain amount of shares, and hold the opposite, the difference part of the purchase, keep the holding of 20 shares;
(6) Calculate the total profit and loss for one trading day after the cycle is completed on N days
Profit/Loss: (last day position value - first day capital) / first day capital
-
-
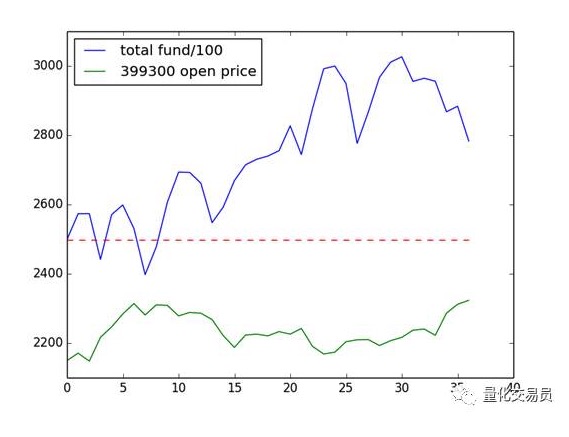
3, Simulated transaction results
Start date: 2014-01-02 and end date: 2014-02-28
The capital was 249800, the final assets were 278313 and the yield was 11.41%, beating the Shenzhen 300 Index for the same period.
Graph of the results:
-
Four, adding
-
The results of the data tests of the first two months are not necessarily universal;
-
2. without taking into account special circumstances such as new shares, discontinuation of listing, ST;
-
The fundamental problem: The theoretical basis of this strategy is that the market is driven by emotions in the short term and does not reflect any factor other than price and is therefore ineffective in the long term.
-
-
Problems in the implementation
- The average of more than 3,000 shares is processed every trading day, the calculation volume is larger, and if the cycle is extended, the running time will be longer. The solution is to calculate the average data of the stock in advance.
Students who are interested can practice on Inventor Quantification!
Quantified traders
- Statistics 7 - The average number of cheaters
- Why is the difference in the area a measure of the degree of dissociation?
- How to determine the failure of a procedural transaction model
- BitMEX exchange API note BitMEX exchange API terms of use
- Extreme trading in trend trading exposed
- How to use code to fine-tune the filter feedback system to set the filter by default
- High frequency strategy
- The classic mistakes newcomers make when making options
- How Bitcoin's High-Frequency Harvester Strategy 1 was implemented
- Understanding the various stakeholders in the futures market
- Three graphs to understand machine learning: basic concepts, five genres and nine common algorithms
- The consistency of the dividend that determines profitability
- 2.14 How to call an exchange's API
- What do you think of the latest Ethereum and Ethereum platforms?
- null
- Six tips to keep your futures safe overnight
- The gold standard for overnight futures trading (trend trading)
- Playing games
- The Mystery of Leisure
- Sharp is 0.6, should we throw it out?