Relation between currency declines and Bitcoin
Author: The grass, Created: 2023-11-16 16:53:56, Updated: 2023-11-17 21:36:53
In a previous article, we discussed a common phenomenon in the digital currency market: most digital currencies, especially those that follow the price fluctuations of Bitcoin and Ethereum, often show a trend of convergence. This phenomenon reveals that they are highly correlated with the mainstream currencies. However, the degree of correlation between different digital currencies also varies.
The synchronized roots of the digital currency market
The digital currency market is known for its volatility and uncertainty. Bitcoin and Ethereum, as the two giants in the market, often play a leading role in price movements. Most small or emerging digital currencies, in order to remain competitive and trading vigorous, tend to maintain a certain degree of price synchronization with these mainstream currencies, especially the project-by-project currencies. This synchronization reflects the psychological expectations and trading strategies of market participants and is an important consideration in the design of quantitative trading strategies.
Relation formulas and calculations
In the field of quantitative trading, correlation measurement is achieved by statistical methods. The most commonly used method of measurement is the Pearson correlation coefficient, which measures the degree of linear correlation between two variables. Here are some core concepts and calculation methods:
Pearson's correlation coefficients (denoted $r$) range from -1 to +1, where +1 is completely positive correlation, -1 is completely negative correlation, and 0 is no linear correlation. The formula for calculating the coefficient is:
$r = \frac{\sum_{i=1}^{n} (X_i - \bar{X})(Y_i - \bar{Y})}{\sqrt{\sum_{i=1}^{n} (X_i - \bar{X})^2} \sqrt{\sum_{i=1}^{n} (Y_i - \bar{Y})^2}}$
Here, $X_i$ and $Y_i$ are the observed values of two random variables, $\bar{X}$ and $\bar{Y}$ are the mean values of the two random variables respectively. Using Python scientific computation related packages, it is very convenient to calculate the correlation.
The collection of data
This article collects 4hK line data for the full year of Binance 2023, selected from 144 coins launched on January 1st.
import requests
from datetime import date,datetime
import time
import pandas as pd
import numpy as np
import matplotlib.pyplot as plt

ticker = requests.get('https://fapi.binance.com/fapi/v1/ticker/24hr')
ticker = ticker.json()
sort_symbols = [k['symbol'][:-4] for k in sorted(ticker, key=lambda x :-float(x['quoteVolume'])) if k['symbol'][-4:] == 'USDT']

def GetKlines(symbol='BTCUSDT',start='2020-8-10',end='2023-8-10',period='1h',base='fapi',v = 'v1'):
    Klines = []
    start_time = int(time.mktime(datetime.strptime(start, "%Y-%m-%d").timetuple()))*1000 + 8*60*60*1000
    end_time =  min(int(time.mktime(datetime.strptime(end, "%Y-%m-%d").timetuple()))*1000 + 8*60*60*1000,time.time()*1000)
    intervel_map = {'m':60*1000,'h':60*60*1000,'d':24*60*60*1000}
    while start_time < end_time:
        time.sleep(0.5)
        mid_time = start_time+1000*int(period[:-1])*intervel_map[period[-1]]
        url = 'https://'+base+'.binance.com/'+base+'/'+v+'/klines?symbol=%s&interval=%s&startTime=%s&endTime=%s&limit=1000'%(symbol,period,start_time,mid_time)
        res = requests.get(url)
        res_list = res.json()
        if type(res_list) == list and len(res_list) > 0:
            start_time = res_list[-1][0]+int(period[:-1])*intervel_map[period[-1]]
            Klines += res_list
        if type(res_list) == list and len(res_list) == 0:
            start_time = start_time+1000*int(period[:-1])*intervel_map[period[-1]]
        if mid_time >= end_time:
            break
    df = pd.DataFrame(Klines,columns=['time','open','high','low','close','amount','end_time','volume','count','buy_amount','buy_volume','null']).astype('float')
    df.index = pd.to_datetime(df.time,unit='ms')
    return df

start_date = '2023-01-01'
end_date   = '2023-11-16'
period = '4h'
df_dict = {}

for symbol in sort_symbols:
    print(symbol)
    df_s = GetKlines(symbol=symbol+'USDT',start=start_date,end=end_date,period=period)
    if not df_s.empty:
        df_dict[symbol] = df_s

df_close = pd.DataFrame(index=pd.date_range(start=start_date, end=end_date, freq=period),columns=df_dict.keys())
for symbol in symbols:
    df_s = df_dict[symbol]
    df_close[symbol] = df_s.close
df_close = df_close.dropna(how='any',axis=1)
A look back
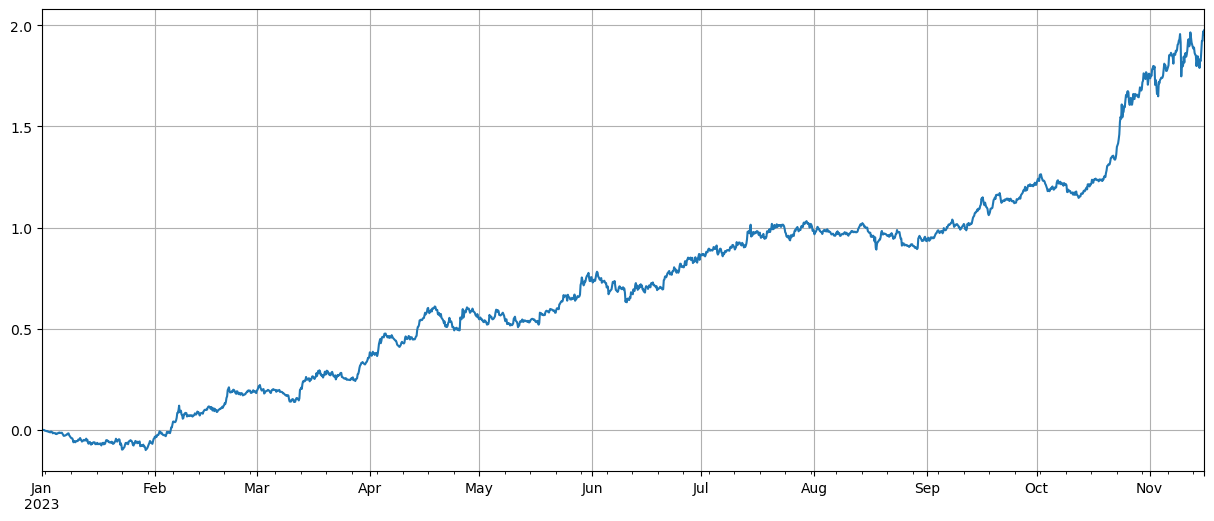
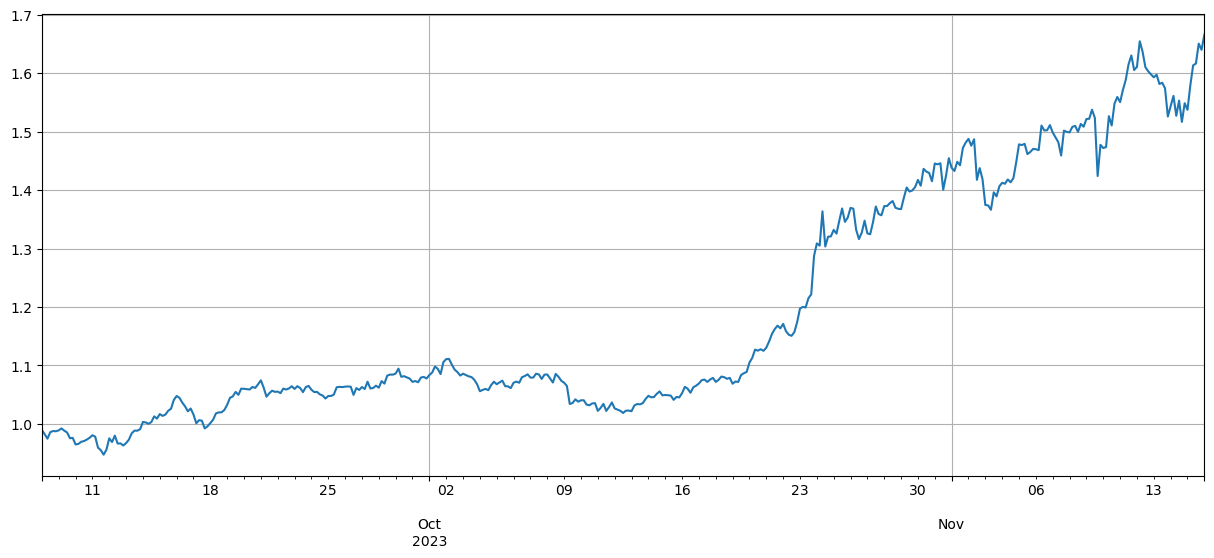
First of all, after integrating the data and calculating the index of average price declines, you can see that there are two waves of markets in 2023, one of which is the first wave of the year, and the other is the wave that started in October, which is currently basically at the high of the index.
df_norm = df_close/df_close.fillna(method='bfill').iloc[0] #归一化
total_index = df_norm.mean(axis=1)
total_index.plot(figsize=(15,6),grid=True);
The correlation analysis
pandas self-correlation calculation, and the correlation between BTC price and the weakest as shown below, most currencies are correlated positively, meaning that they follow the price of BTC, while some currencies are correlated negatively, which is an anomaly in the digital currency market.
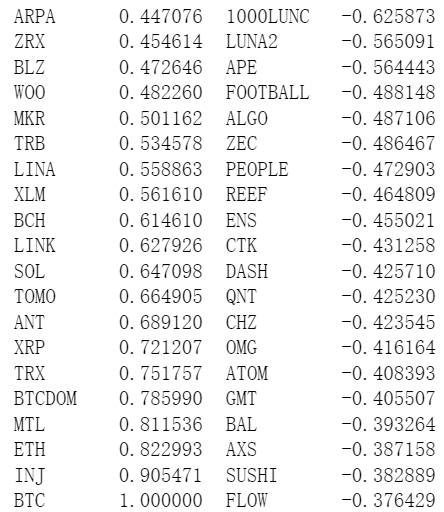
corr_symbols = df_norm.corrwith(df_norm.BTC).sort_values().index
Relevance and price increases
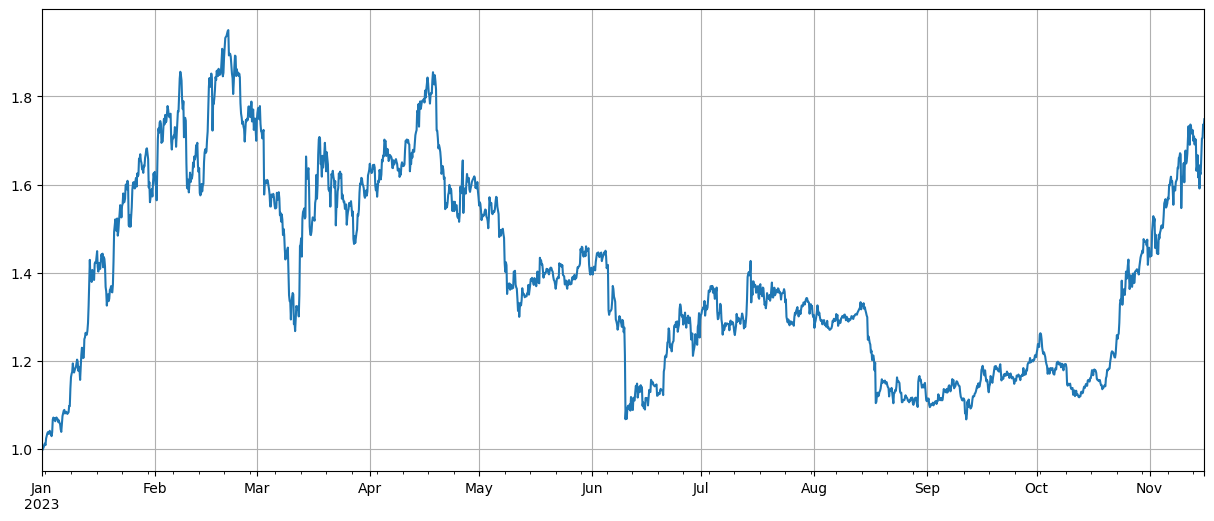
The first group is the 40 most relevant to the BTC price, the second group is the least relevant to the BTC price, using the price index of the first group minus the index of the second group, representing an average of more than the first group to empty the second group, you can calculate the relationship between the price drop and the BTC price. The code and the result are as follows:
(df_norm[corr_symbols[-40:]].mean(axis=1)-df_norm[corr_symbols[:40]].mean(axis=1)).plot(figsize=(15,6),grid=True);
The results show that the currencies that are more correlated to the price of BTC are better at rising, and the ones that are less correlated to the price of BTC also have a good hedging effect. Here, the less rigorous part is that the future data is used when calculating the correlation, and then the data is divided into two groups, one for calculating correlation, and another for calculating hedged earnings.
Bitcoin and Ethereum are the market leaders, and their price movements often have a huge impact on the market as a whole. When these bitcoins rise in price, market sentiment usually becomes optimistic, and many investors tend to follow the market trend. Investors may see this as a signal that the market as a whole is rising and start buying other currencies. Currencies that are highly correlated with the mainstream currency may experience similar price increases due to the collective behavior of market participants.
corr_symbols = (df_norm.iloc[:1500].corrwith(df_norm.BTC.iloc[:1500])-df_norm.iloc[:1500].corrwith(total_index[:1500])).sort_values().index
Summary
This article reveals the degree of correlation between currencies. The article shows how to obtain data to calculate correlation between currencies and use this data to assess market trends. It reveals that the synchronicity of price fluctuations in the digital currency market is not only a reflection of market psychology and strategy, but can also be quantified and predicted using scientific methods.
There are plenty of expansions to the ideas in this article, such as calculating rolling correlations, calculating the correlations between rises and falls, etc., to analyze more useful information.
- How to install the penetration security IB GATEWAY under Linux bash
- Which is More Suitable for Bottom Fishing, Low Market Value or Low Price?
- I'm not sure which is better, the low market value or the low price.
- Bayes - Decoding the Mystery of Probability, Exploring the Mathematical Wisdom Behind Decision Making
- Bayes - the mystery of decoding probability, exploring the mathematical wisdom behind decision making
- The Advantages of Using FMZ's Extended API for Efficient Group Control Management in Quantitative Trading
- Price Performance After the Currency is Listed on Perpetual Contracts
- Efficient cluster management using FMZ's extended API is an advantage in quantitative trading
- The price performance after the currency went live
- The Correlation Between the Rise and Fall of Currencies and Bitcoin
- A Brief Discussion on the Balance of Order Books in Centralized Exchanges
- Measuring Risk and Return - An Introduction to Markowitz Theory
- Talk about the order book balance of a centralized exchange
- Measuring risk and return by the use of the Goma-Kovitz Theory
- A Powerful Tool for Programmatic Traders: Incremental Update Algorithm for Calculating Mean and Variance
- Programmatic trader leverage: incremental update algorithm to calculate the mean and variance
- Construction and Application of Market Noise
- PSY Factor Upgrade and Transformation
- High-Frequency Trading Strategy Analysis - Penny Jump
- Alternative Trading Ideas--K-line Area Trading Strategy
mztcoinWell, correlation analysis can be combined with the previous strategy of doing nothing and doing more and more.