Principles and writing of stop-loss models
Author: Goodness, Created: 2019-07-11 09:44:17, Updated: 2023-10-24 21:43:13
Why Stop the Loss
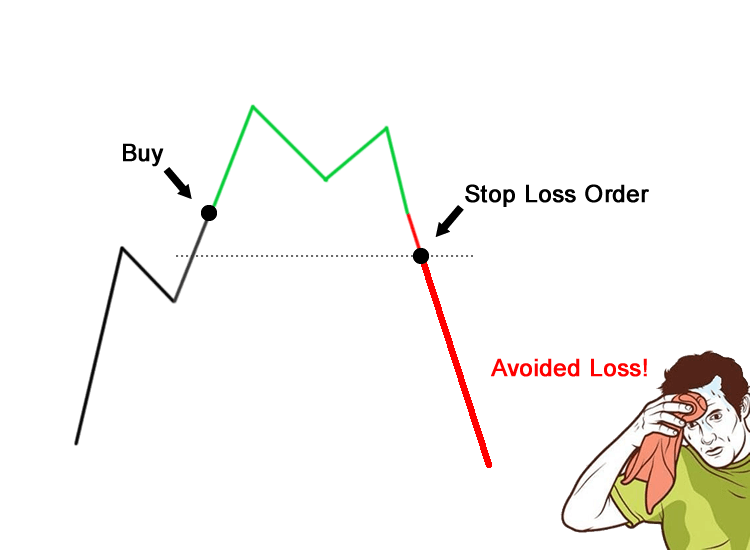
Shark laws
Suppose a shark bites your foot, and if you try to get your hand off your foot, the shark will bite both your feet and your hands at the same time. The more you struggle, the more you will be bitten. So if a shark bites your foot, your only chance is to sacrifice one foot.
In the capital markets, whether it's digital currency or commodity futures, the rule of thumb is this: when you find your trades deviating from the direction of the market, you have to stop losing immediately, there can be no delay, there can be no luck.
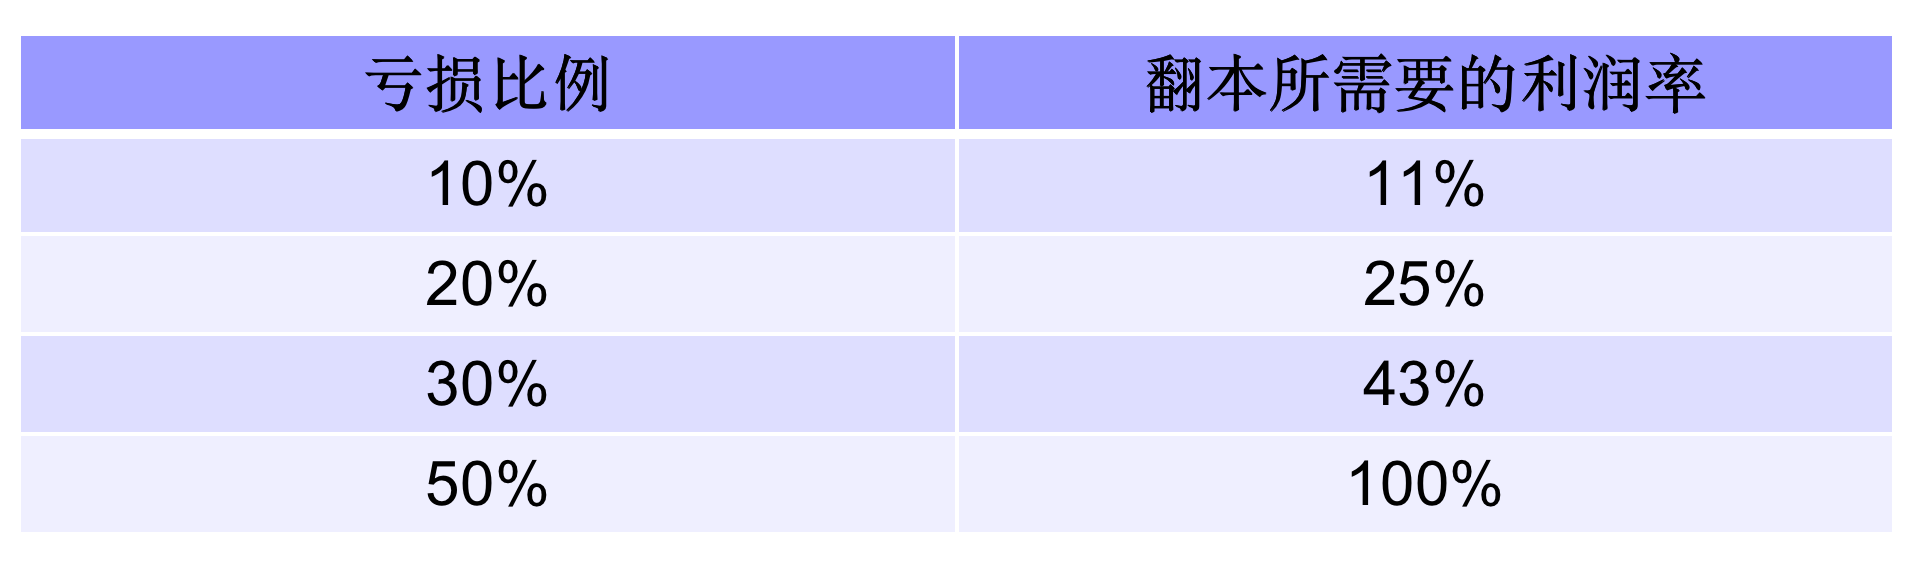
Keeping capital is always the first priority.
The Master of Investing He believes that the most important thing is always to preserve capital, which is the cornerstone of his investment strategy.
Failed Investors The only investment goal is to make a lot of money. As a result, he often can't even save the money.
Investors know that it is much easier to avoid losing money than to make it. If you lose 50% of your investment, you have to double your money to get back to where you started.
How to Stop Spatial Loss
Key: Set the stop-loss price below a certain benchmark to achieve a method of preventing the unforeseen.
For example:
Make multiple stop-loss buckets as a benchmark for the support line and set the stop loss below the support line; Make a blank stop-loss valve with the resistance line as a benchmark and set the stop loss above the resistance line.
This stop-loss method belongs to the price pattern method, which is equivalent to setting a maximum stop-loss threshold for the pump, which is set at a maximum price. We have to protect ourselves and avoid the disaster caused by emotional disruption. If the negative waits for the price to fall to the maximum stop loss line before acting late, it is more passive. Stop-loss limits can only be a good barrier when the market is turning abruptly.
The Law of Limiting Loss
Stop-loss strategy: The stop-loss position is pre-set before the trade opens.
Strategy example: a stop loss at a fixed price point, a stop loss of 3% or 5% below the buy price, and an immediate exit once the price effectively breaks the stop loss position.
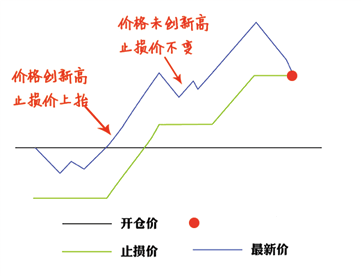
Floating Stop Loss
Stop-loss strategy: A method of making a stop loss after N price retracements from the maximum stop-loss as a standard.
Strategy example: If a multiple order is placed on PTA at 8946 and the price is set to pull back 10 pips (8936) the stop loss will automatically reposition at 8940 when the PTA price rises to 8950.
Withdrawal of the lawIf the price rises after the purchase and then falls after reaching a relatively high point, then a stop-loss target can be set for the fall starting from the relatively high point, which is also determined by the individual situation. In addition, a factor of the fall time (i.e. the number of days) can be added, for example, setting a 5% retracement in 3 days or a stop-loss retracement.
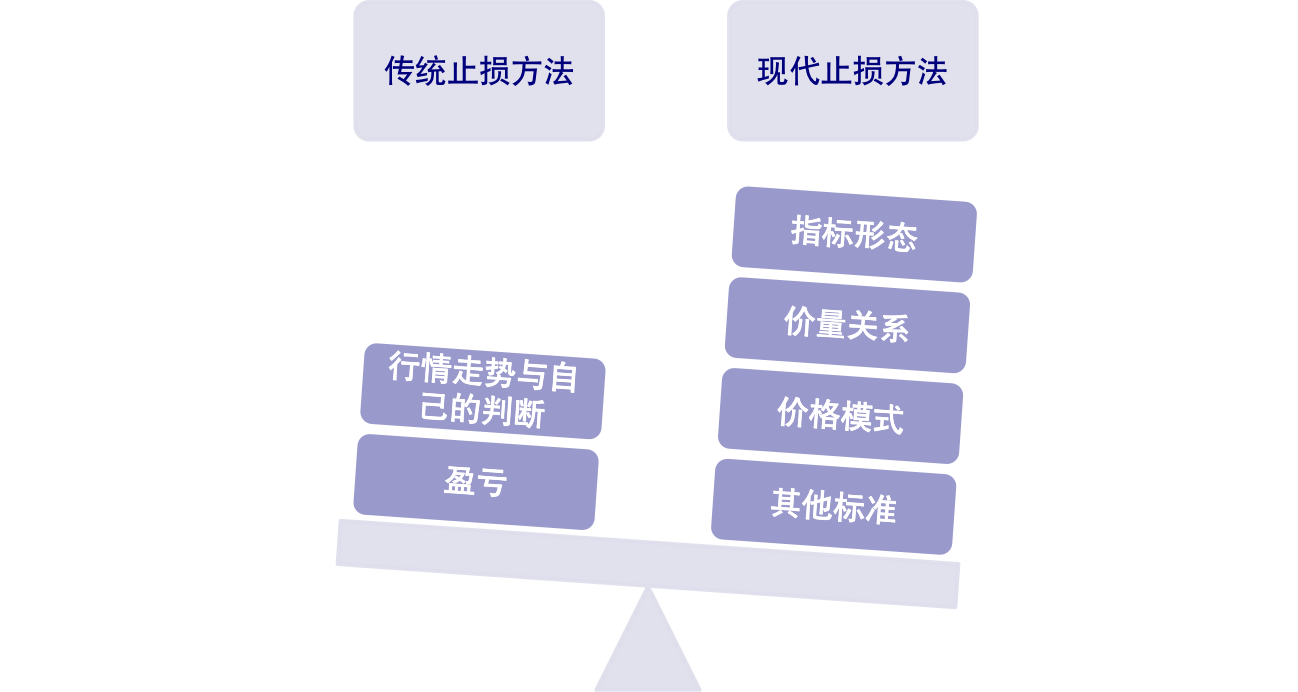
Introduction to modern methods of stopping damage
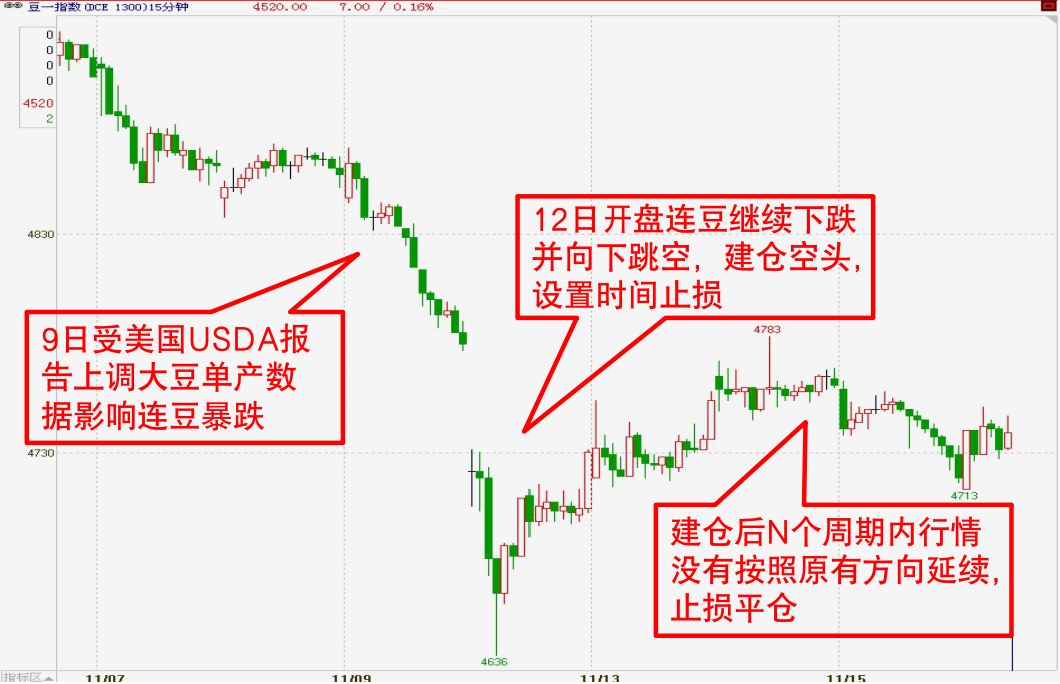
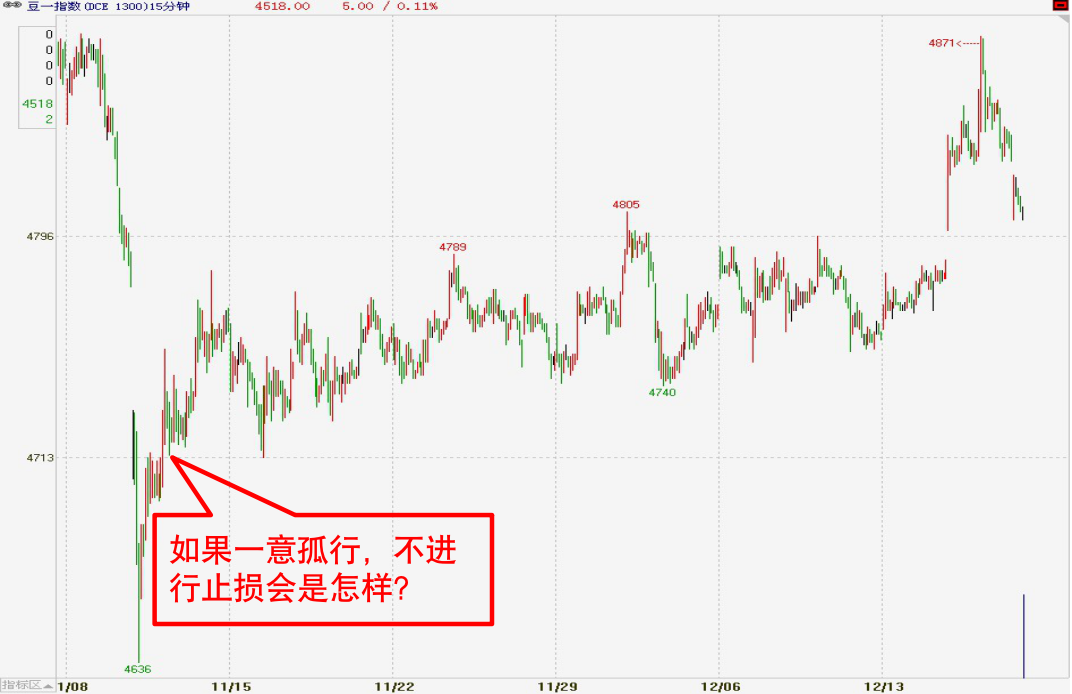
How to Stop Time
Applications: Ultra short trading patterns within the day
Key: If the market does not fluctuate favorably for a certain period of time after the position is established, stop the loss and look for a new entry time.
The principle of trading: when the price moves rapidly under the influence of a factor such as an outside influence, a breakout of the support and pressure levels in the market and false breakouts, sudden news, etc., the bullish or bearish trend moves quickly to make a profit.
Time stop loss is a certain prospective practice, which belongs to the other stop loss methods classification. Time stop loss also involves the issue of the time of opening a position. For example: it should be aimed at opening a position at the moment of starting the critical point (quality change), expecting a mad chase after the fall, but this is just an expectation, if it does not happen, then leave the field, do not wait until the fall support or resistance wear to stop the loss.
Typical time stops:
Stop the transverse disc
-
Stop-loss strategy: set a stop-loss target for the time after the purchase when the price will cross within a certain range
-
Strategic distance: Stop loss if the gain does not reach 5% within 5 days of the purchase.
-
Cross-displacement stops are generally used in conjunction with time stops and maximum loss methods to control the overall risk.
The Law of Technology
Key: The technical stop loss method is a more complex stop loss method, which combines stop loss setting with technical analysis to eliminate random fluctuations in the market and set a stop loss order at the key technical level to avoid further expansion of losses.
Applications: Technical stop-loss methods require strong technical analysis skills and self-restraint from investors. Technical stop-loss methods are more demanding on investors than the former, and it is difficult to find a fixed pattern. In general, the use of technical stop-loss methods is nothing more than a small loss.
For example, after buying down the uptrend, the uptrend ends and the stop-loss position is positioned near the relatively reliable moving average line, so that the spread can be obtained.
Typical technological breakdowns:
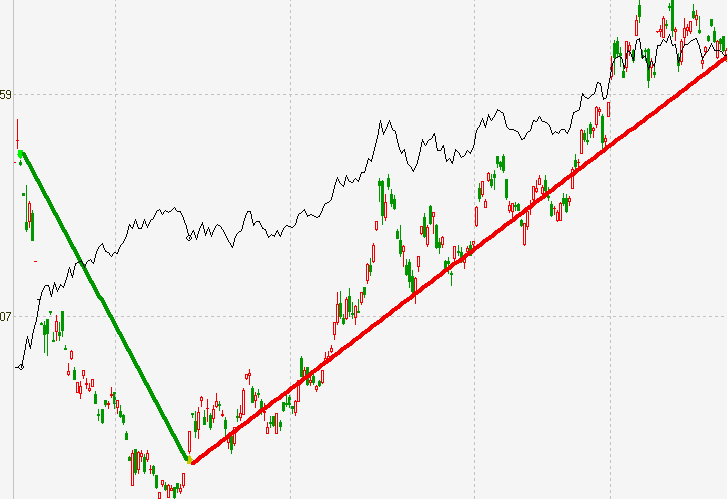
The trend line stops the loss:
Includes the intersection where the price effectively breaks the trend line; the price effectively breaks the angle line 1×1 or 2×1 The price of the product is going up, the price of the product is going down.
This is the first time I've seen this video.
This includes the slope of the line where the price hits the head-shoulder-top, M-top, and arc-top. I'm going to jump in the air and break through the gaps.
The K-line stopped:
This may include the appearance of a double-barreled, double-barreled, double-barreled air gun, or a single-barreled, triple-barreled split head. The knife, the twilight star, the head-breaking foot, the shooting star, the double-flying crow, the three crows Typical K-line combinations such as hanging tree branches and so on.
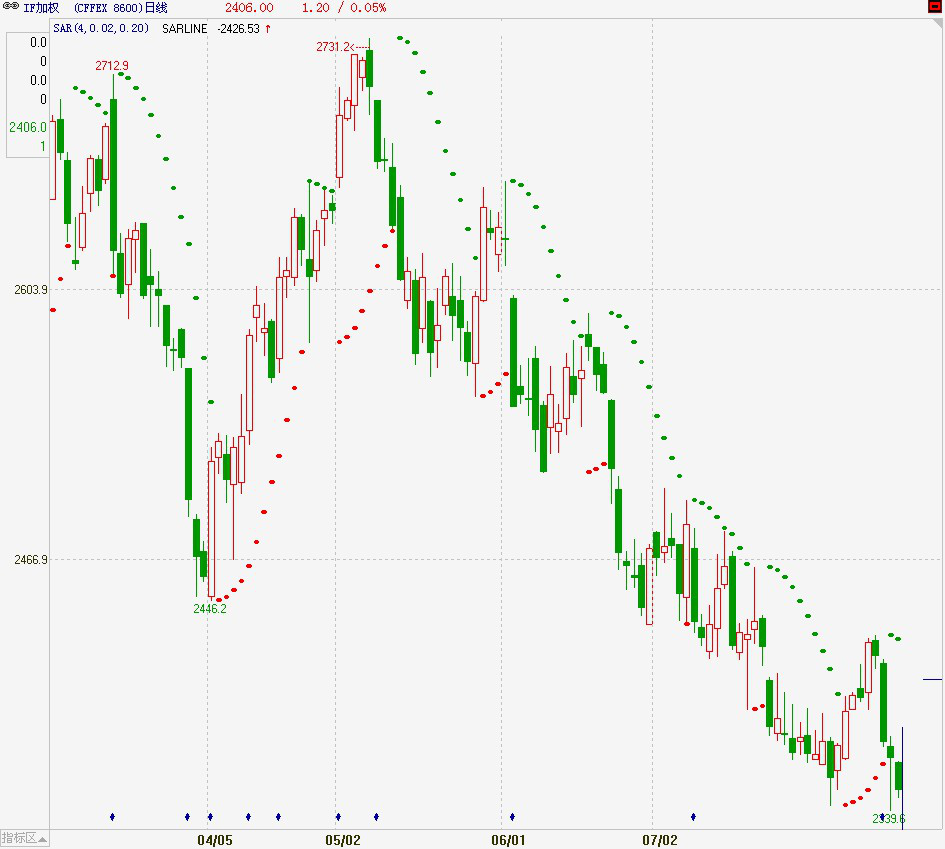
Stop loss indicator:
Selling instructions issued based on technical indicators, as stop-loss signals, mainly include: MACD appears green The colored columnar lines form a dead fork; the SAR turns downward and turns to green. The most practical is the SAR parallax shift indicator, also known as the stop loss point shift operating system. Like the guardian deity of the stock price, once the price goes up or the stock price goes down, the SAR will go up. In the meantime, the price of the stock is falling, and the SAR is a sign of a break even.
The statistical stop-loss law
In the selection of stop-loss reference points, we can choose from a variety of different reference points. In addition to technical indicators, K-line shape, time and price space, many statistical variables are also important reference points for setting stop-loss. These statistical variables are mostly derived from statistics and mathematical principles, so we call them statistical stop-loss.
Typical statistical stops:
The law against money laundering:
This is the simplest stop-loss method, whereby we control our risk at a fixed percentage of the money each time we trade, which represents an increase in the amount of money that we make when we keep making money, so we can invest more money to make more profits, while we can reduce our losses when we keep losing money.
How to write a stop-loss model
Write a few commonly used stop loss functions:
BKPRICE 返回数据合约最近一次买开信号价位。
SKPRICE 返回数据合约最近一次卖开信号价位。
BKHIGH  返回最近一次模型买开位置到当前的最高价。
SKLOW   返回最近一次模型卖开位置到当前的最低价。
BARSBK 上一次买开信号位置
BARSSK 上一次卖开信号位置
Stop loss and stop price
TMP1:=C<BKPRICE-M;
TMP2:=C>SKPRICE+M;

TMP3:=C>BKPRICE+M;
TMP4:=C<SKPRICE-M;
Tracking the damage
HH:HHV(H,BARSBK); //入场以来的高点
LL:LLV(L,BARSSK); //入场以来的低点
TMP1:=C<(HH-BKPRICE)*0.5+BKPRICE&&HH>BKPRICE+25; //多头跟踪止损条件
TMP2:=C>SKPRICE-(SKPRICE-LL)*0.5&&LL<SKPRICE-25; //空头跟踪止损条件
Cases of stop-loss models
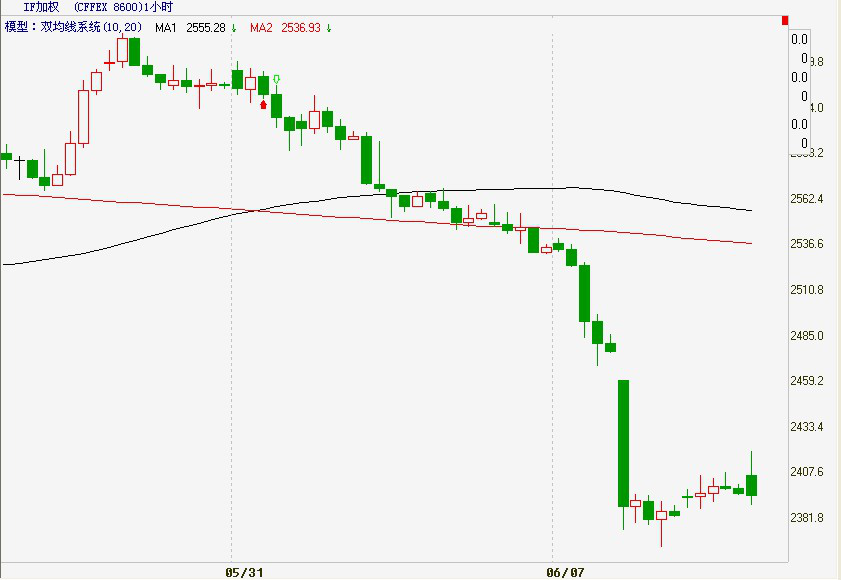
Example 1 Dual equilateral system
Think: Buy or sell when the 100-day average crosses the 350-day average
MA1:MA(C,100);
MA2:MA(C,350); //定义双重均线
CROSS(MA1,MA2),BPK;
CROSS(MA2,MA1),SPK;
AUTOFILTER;
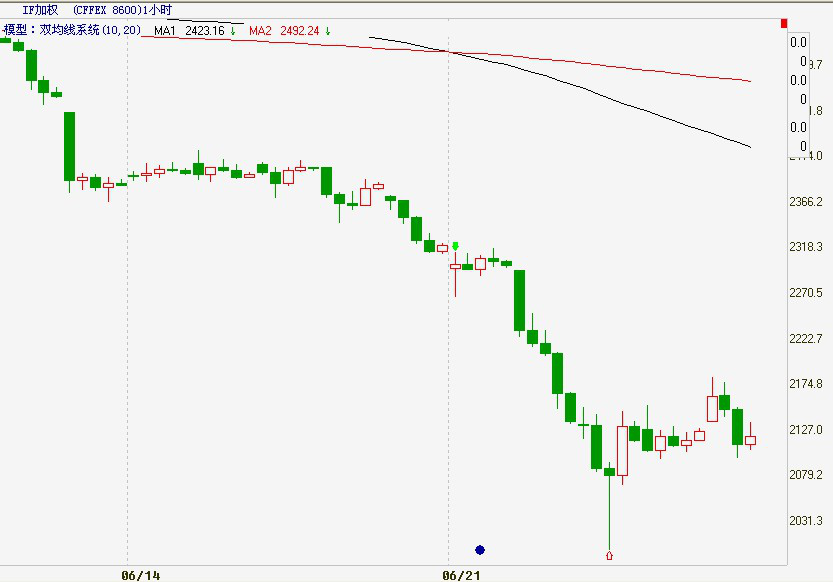
Thinking
-
If the trend has reversed and the break even conditions have not yet been reached, can we stop the loss immediately and reduce the loss?
-
If you win, can you maximize your profit and keep your position flat as the market goes up?
Translated: Stop loss + tracking stop
//限价止损
C<BKPRICE-N,SP;
C>SKPRICE+N,BP;
//追踪止盈
C>BKPRICE&&C<BKHIGH-M,SP;
C<SKPRICE&&C>SKLOW+M,BP;
注:N,M为价差
The full code:
MA1:MA(C,100);
MA2:MA(C,350); //定义双重均线
CROSS(MA1,MA2),BK;
CROSS(MA2,MA1),SK; //转化模型
CROSS(MA2,MA1)||C<BKPRICE-N||(C>BKPRICE&&C<BKHIGH-M),SP;
CROSS(MA1,MA2)||C>SKPRICE+N||(C<SKPRICE&&C>SKLOW+M),BP;
 //限价止损+回撤止损
AUTOFILTER; //实现信号过滤
Example 2 Opening the fluctuation regression model
Think: Break the first K-line of the day's entity at the upper end of the minute cycle, do more, the late price falls below the lowest price of the day's first K-line or the market has passed 10 minutes, the position is cleared; break the first K-line of the day's entity at the lower end of the minute cycle, do nothing, the late price rises above the highest price of the day's first K-line or the market has passed 10 minutes, the position is cleared.
RKO:=VALUEWHEN(TIME=0900,O);//分钟周期当天第一根K线的开盘价
RKC:=VALUEWHEN(TIME=0900,C);//分钟周期当天第一根K线的收盘价
RKH:=VALUEWHEN(TIME=0900,H);//分钟周期当天第一根K线的最高价
RKL:=VALUEWHEN(TIME=0900,L);//分钟周期当天第一根K线的最低价
CROSS(H,MAX(RKO,RKC))&&TIME<0910&&TIME>0900,BK;
CROSS(MIN(RKO,RKC),L)&&TIME<0910&&TIME>0900,SK;
C>RKH || TIME>=0910,BP;
C<RKL || TIME>=0910,SP;
AUTOFILTER;
//适用品种,受外盘影响较大,
开盘波段比较剧烈的品种
In the case of the stop loss model, the time stops are: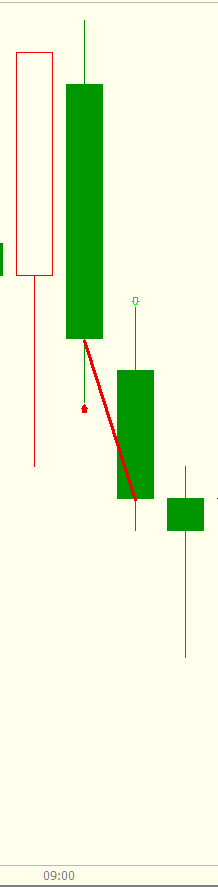
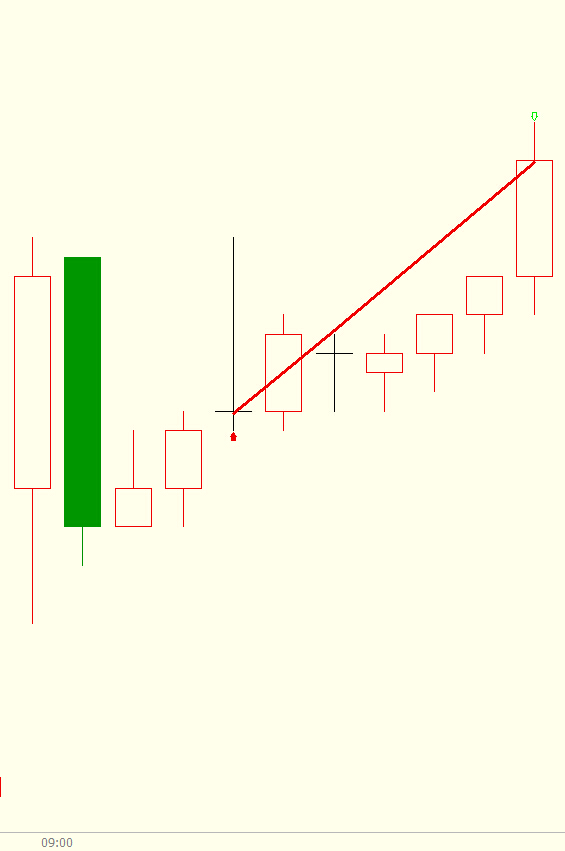
Example 3: Price breaking the channel model
Solution: Use ATR to calculate the price channel down the track. After the innovation high and the current highest price breaks the previous K line closing price plus a fixed multiple of ATR entry, the price breaks the track, the exit.
TR:=MAX(MAX((HIGH-LOW),ABS(REF(CLOSE,1)-HIGH)),ABS(REF(CLOSE,1)-LOW));
ATR:=MA(TR,26),COLORYELLOW;//求26个周期内的TR的简单移动平均
C1:REF(C,1)+REF(ATR,1)*0.79;//上轨
C2:REF(C,1)-REF(ATR,1)*0.79;//下轨
HIGH>HHV(REF(HIGH,1),10)&&H>=REF(C,1)+REF(ATR,1)*0.79,BPK;
LOW<LLV(REF(L,1),10)&&L<=REF(C,1)-REF(ATR,1)*0.79,SPK;
CROSS(C2,C),SP;//价格突破下轨,多头止损平仓
CROSS(C,C1),BP;//价格突破上轨,空头止损平仓
AUTOFILTER;
The price breaks the channel model:
Example 4 Formal stop loss model
Solution: The difference between the current price and the MA is defined as DRD, N days plus the sum of DRD divided by the sum of the absolute value of DRD. Set 5 as the entry threshold, if RDV > 5, then enter more, the K line appears to jump to the bottom of the gap, and the position is cleared. Set-5 as the entry threshold, if RDV <-5, then the entry is cleared, and the K line appears to jump up to the gap, and the position is cleared.
RMA:=MA(CLOSE,15);
DRD:=CLOSE-RMA;//将当前价格和MA之差定义为DRD
NDV:=SUM(DRD,15);
TDV:=SUM(ABS(DRD),15);
RDV:=VALUEWHEN(TDV>0,100*NDV/TDV);//15天DRD的和除以DRD绝对值的和
RDV>5,BPK;
RDV<-5,SPK;
MAX(C,O)<REF(MIN(C,O),1),SP;//K线出现向下跳空缺口,多头止损
MIN(C,O)>REF(MAX(C,O),1),BP;//K线出现向上跳空缺口,空头止损
AUTOFILTER;
The model of form loss: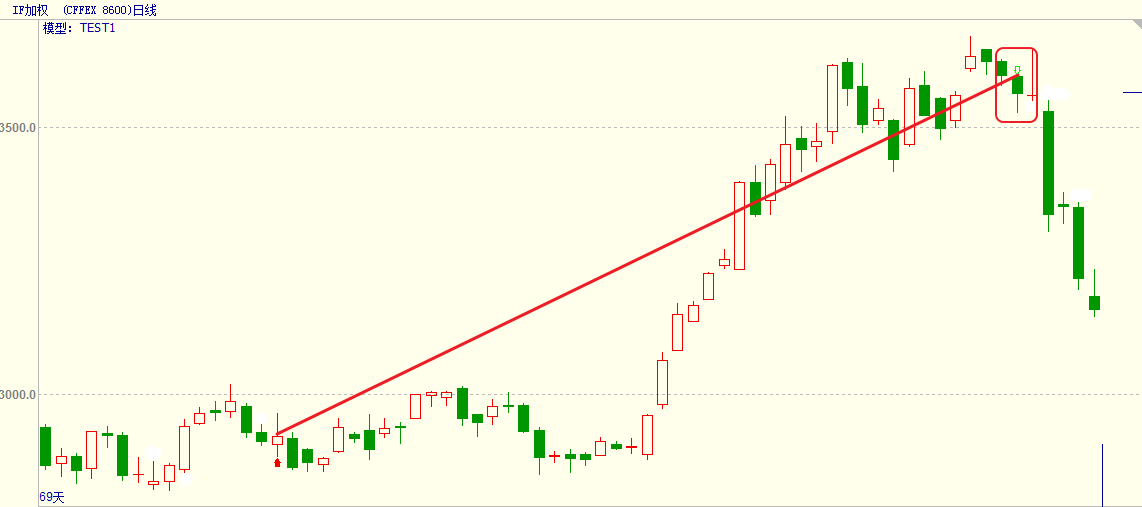
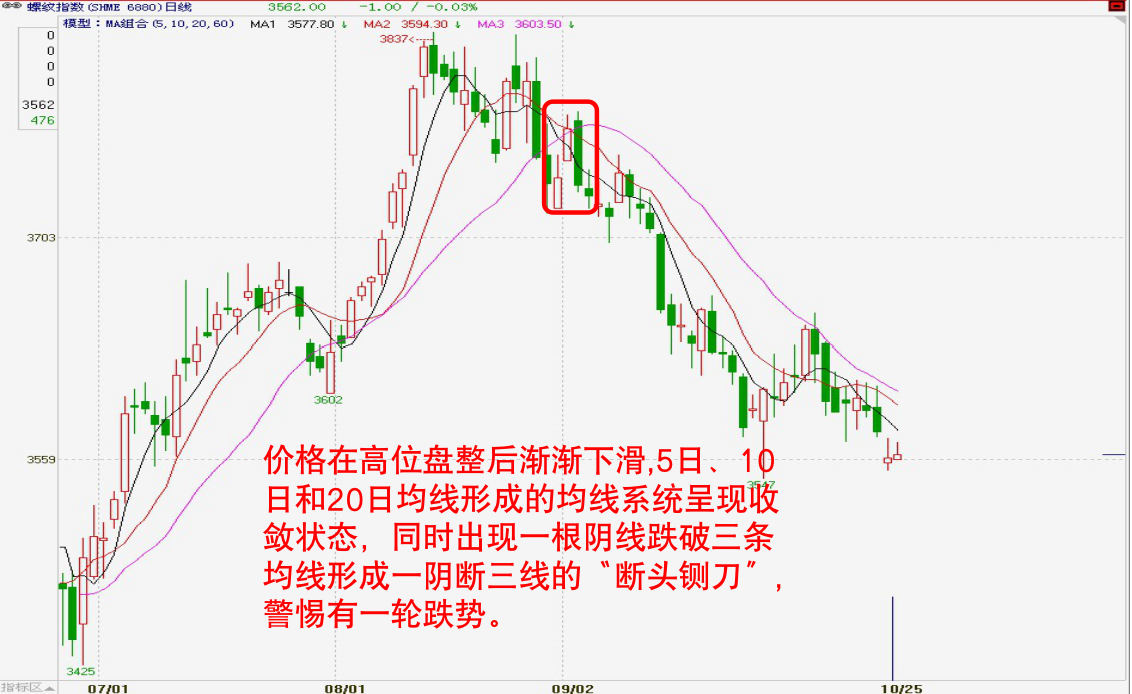
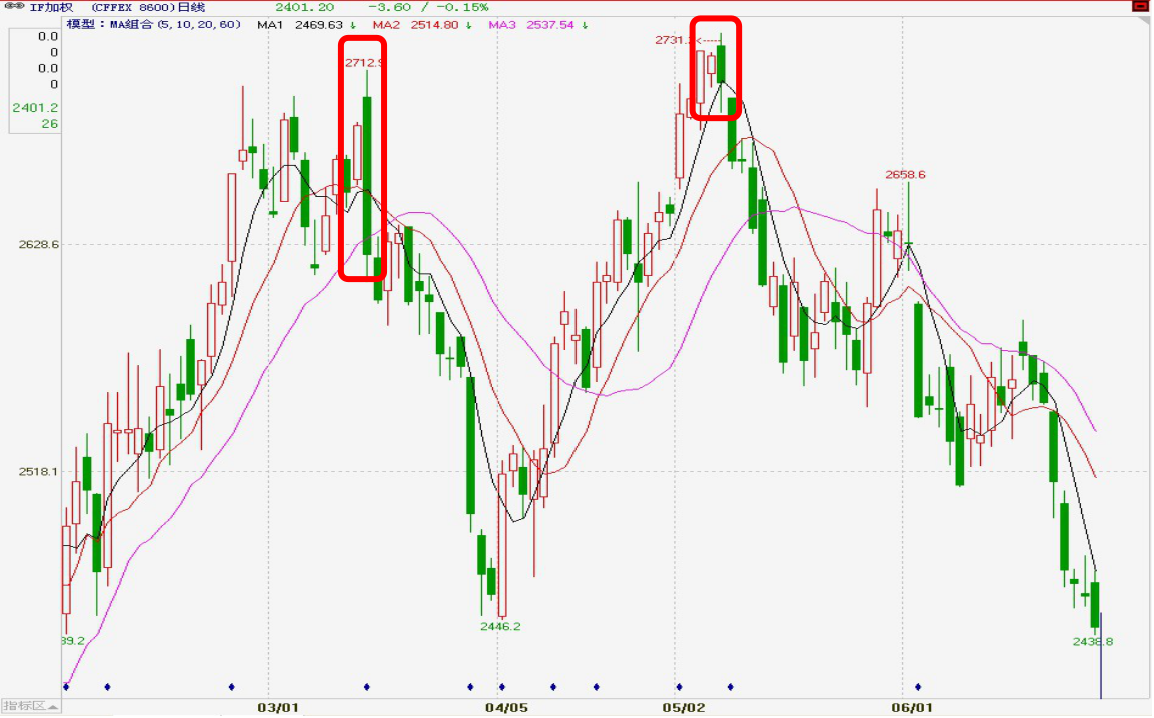
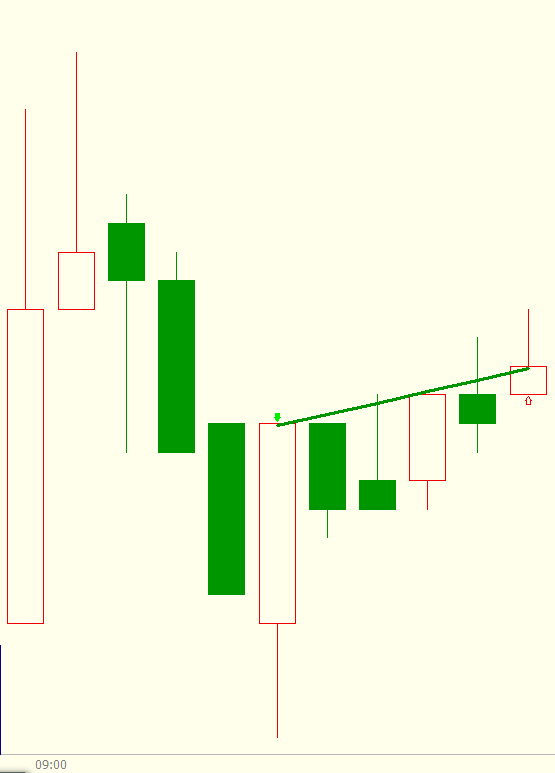
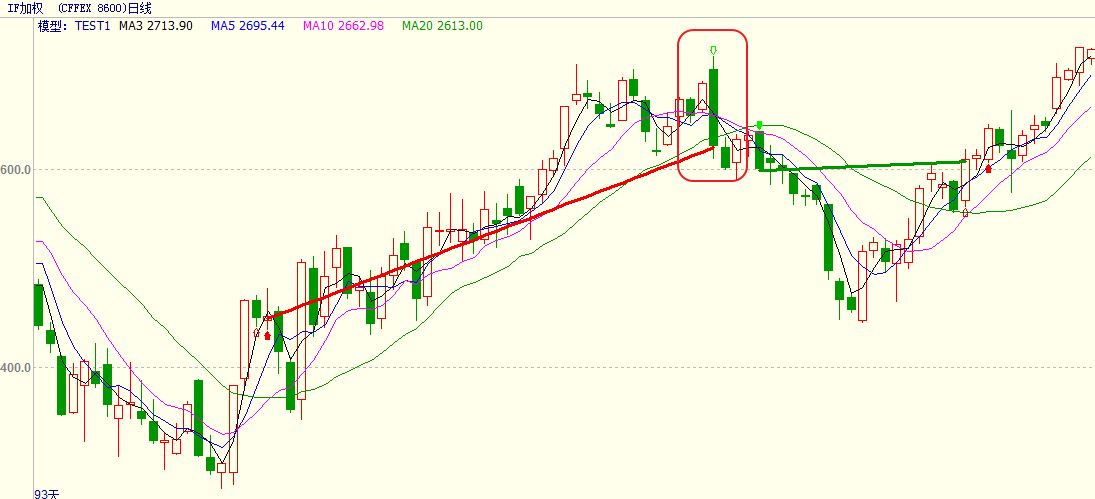
Example 5K linear stop loss model
Solution: When both sets of even lines are multi-headed and the current price is much higher than the highest entry price of the upper K line, one straight line drops four straight straight line multi-head stops.
MA3:MA(CLOSE,3);
MA5:MA(CLOSE,5);
MA10:MA(CLOSE,10);
MA20:MA(CLOSE,20);//均线组合
MA5>MA20&&MA3>MA10&&HIGH>=REF(HIGH,1),BPK;
MA5<MA20&&MA3<MA10&&LOW<=REF(LOW,1),SPK;
ISDOWN&&O>MAX1(MA3,MA5,MA10,MA20)&&C<MIN1(MA3,MA5,MA10,MA20),SP;
//一根阴线跌破四条均线多头止损
ISUP&&C>MAX1(MA3,MA5,MA10,MA20)&&O<MIN1(MA3,MA5,MA10,MA20),BP;
//一根阳线上穿四条均线空头止损
AUTOFILTER;
The K-line stop loss model:
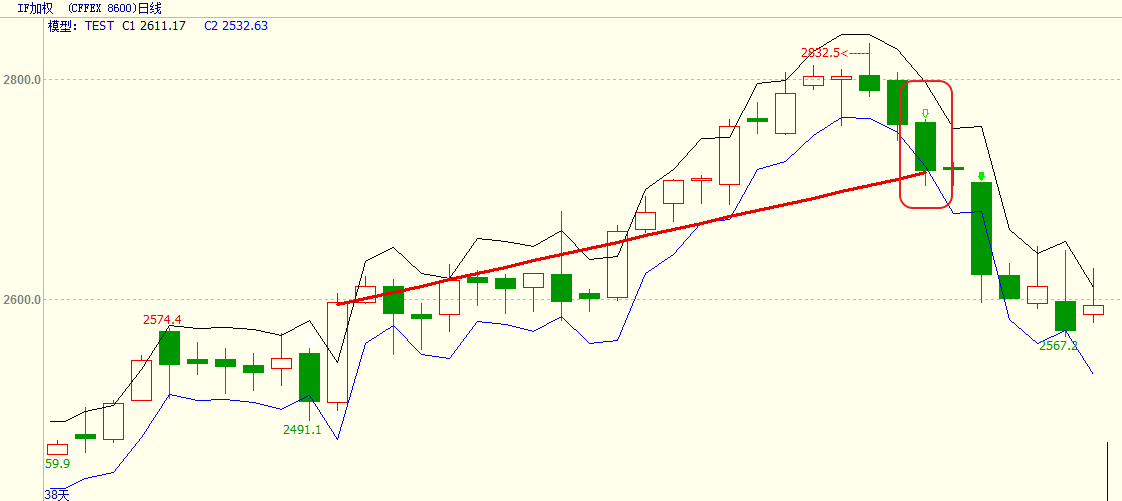
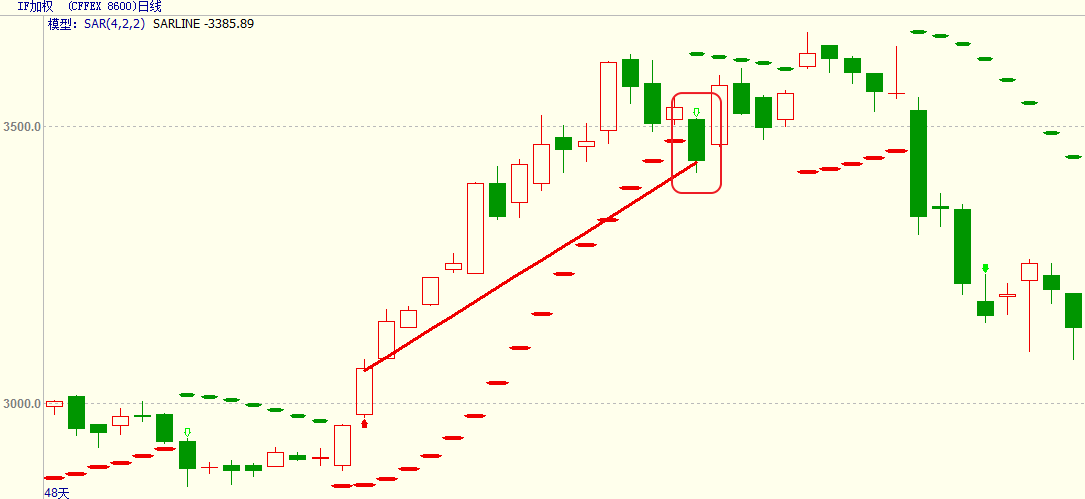
Example 6 Stopping loss model based on BOLL and SAR indicators
Thought: The highest price is greater than the entry of Brin on the track, the parallax turns to the value of wear 0, more stops. The lowest price is less than the entry of Brin on the track to do nothing, the parallax turns to the value of wear 0, the empty stop.
MID:=MA(CLOSE,26);//求26个周期的收盘价均线,称为布林通道中轨
TMP2:=STD(CLOSE,26);//求26个周期内的收盘价的标准差
TOP:=MID+2*TMP2;//布林通道上轨
BOTTOM:=MID-2*TMP2;//布林通道下轨
STEP1:=2/100;
MVALUE1:=2/10;
SARLINE:SAR(4,STEP1,MVALUE1),CIRCLEDOT;
//4个周期的抛物转向,步长为STEP1,极限值为MVALUE1
HIGH>=TOP,BPK;
LOW<=BOTTOM,SPK;
CROSS(SARLINE,0),BP;//抛物转向值上穿0,多头止损
CROSS(0,SARLINE),SP;//抛物转向值下穿0,空头止损
AUTOFILTER;
The above is a roughly code framework of the various stop loss models, you can trade according to your needs, the way to trade is in the flexible use of various strategies and methods, the importance of stop loss in a quantitative trading strategy is self-evident, you readers in the use of the above models, and can not move the hard socks, be sure to check many times the applicability of your trading indicator and model, then in the conduct of multiple reviews of the analogue disk, determine the model is correct, then apply to the real world.
- Quantifying Fundamental Analysis in the Cryptocurrency Market: Let Data Speak for Itself!
- Quantified research on the basics of coin circles - stop believing in all kinds of crazy professors, data is objective!
- The inventor of the Quantitative Data Exploration Module, an essential tool in the field of quantitative trading.
- Mastering Everything - Introduction to FMZ New Version of Trading Terminal (with TRB Arbitrage Source Code)
- Get all the details about the new FMZ trading terminal (with the TRB suite source code)
- FMZ Quant: An Analysis of Common Requirements Design Examples in the Cryptocurrency Market (II)
- How to Exploit Brainless Selling Bots with a High-Frequency Strategy in 80 Lines of Code
- FMZ quantification: common demands on the cryptocurrency market design example analysis (II)
- How to exploit brainless robots for sale with high-frequency strategies of 80 lines of code
- FMZ Quant: An Analysis of Common Requirements Design Examples in the Cryptocurrency Market (I)
- FMZ quantification: common demands of the cryptocurrency market design instance analysis (1)