RangeBreak strategy combined with real-world use of volatility
Author: , Created: 2019-07-13 17:05:56, Updated: 2023-10-24 21:44:41[TOC]

The RangeBreak strategy is outlined
The RangeBreak strategy originated in futures and foreign exchange trading and is a type of intraday breakthrough strategy. It has been in the top 10 for several consecutive years in the Futures Truth Magazine rankings. It is widely used by both professional investment institutions and individual traders.
However, if a trading strategy is widely known, then the application of this trading strategy in real life will be discounted. So, the purpose of this article is not to introduce the RangeBreak strategy to make everyone move hard, but to learn about the RangeBreak strategy to make everyone integrate into a profitable trading system and improve their trading ability.
How to calculate the RangeBreak strategy
The original RangeBreak strategy was to use the opening price and the price fluctuation of yesterday to determine the direction of today's overshoot. The opening price of the day plus the price fluctuation of yesterday formed a trajectory, and the opening price of the day minus the price fluctuation of yesterday formed a trajectory. If the price breaks up the trajectory, more entries are made, if the price breaks down the trajectory, more entries are made.
- Up = the opening price of the day + (Yesterday's highest price - yesterday's lowest price) x N
- The lower line = the opening price of the day - (highest price yesterday - lowest price yesterday) x N
- The price is on the rise, and many positions are open.
- The price plummeted and the stock opened empty
- Near closing, all tied up
A careful friend may find that adding a variable N when calculating up and down, and someone may ask why N is multiplied by the magnitude of price fluctuations yesterday, what exactly does this N mean? In fact, the variable N here has no special meaning, so adding a variable N here is not the only reason that the trader can flexibly adjust the distance up and down depending on the specific trade variety or individual subjective experience, the parameter range of the variable N can be from 0.1 to 1.5
RangeBreak policy source code
It is open as follows:fmz.com> Login > Control Center > Policy Library > Create new policies, in the upper left corner of the policy editor interface, click the drag box to select the programming language:My语言, start writing the policy. Note the comments in the code below.
Q:=BARSLAST(DATE<>REF(DATE,1))+1;  // 判断是不是新一天的K线
DIFF:=REF(HHV(HIGH,Q),Q)-REF(LLV(LOW,Q),Q);  // 昨日最高价与最低价的价格差
OO:VALUEWHEN(Q=1,OPEN);  // 当天开盘价
UP:OO+DIFF*N;  // 上轨
DOWN:OO-DIFF*N;  // 下轨
TIME>=0905&&TIME<1455&&CLOSE>UP,BK;  // 多头开仓
TIME>=0905&&TIME<1455&&CLOSE<DOWN,SK;  // 空头开仓
TIME>=1455,CLOSEOUT;  // 收盘平仓
AUTOFILTER;  // 信号过滤
RangeBreak policy retested
In order to get closer to the real trading environment, we used a stress test with 2 jumps in the open position and 2 times the transaction fees in the retest, testing the environment as follows:
- Industry varieties: index of power coal
- Trade varieties: powered mainly by coal
- Time: from 01 June 2015 to 28 June 2019
- Cycle: daylight
- Slide point: 2 jumps to the open position
- Fee: Exchange doubled
The funding curve
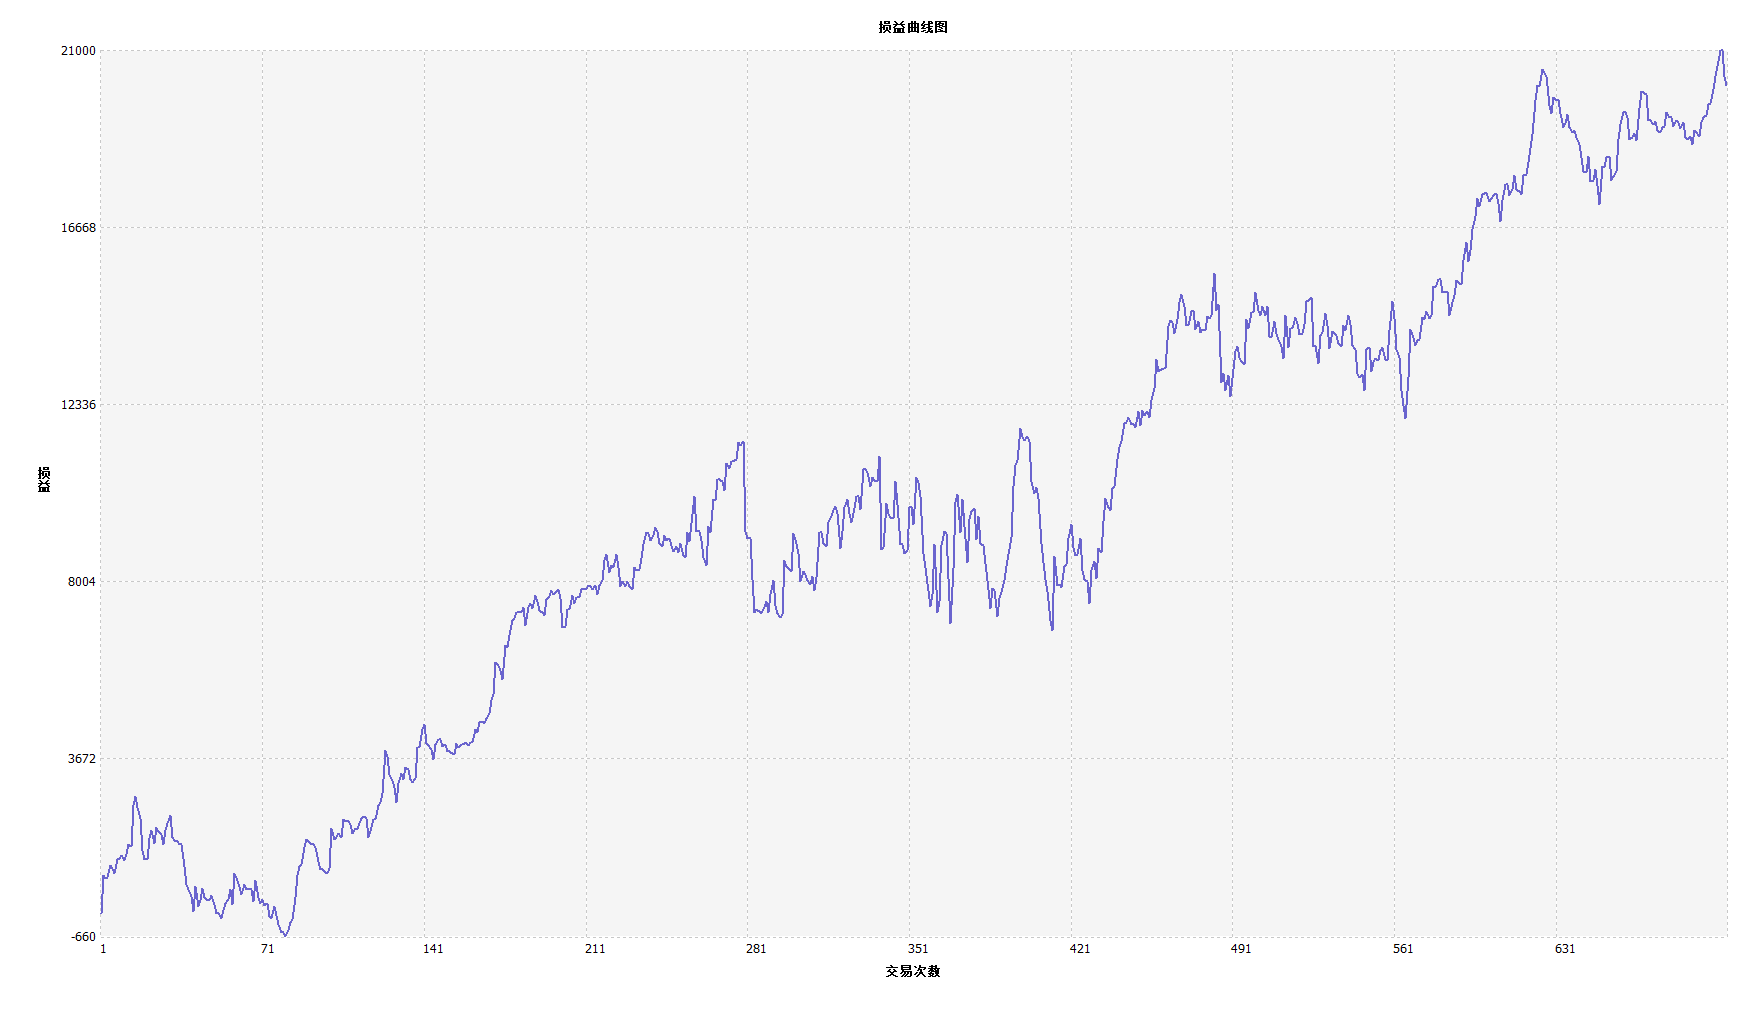
From the above retrospective results, the strategy performs well when the market trend is fluid, and the Aron indicator can be fully tracked to the market, whether up or down. The capital curve also moves upwards overall, with no significant pullback.
Improvements to RangeBreak strategy
As shown above, the original RangeBreak strategy is not very effective even when the market trend is obvious, especially when the market is in a state of turmoil, the capital curve is more volatile, and when the market is in a state of long-term turmoil, there is a greater retracement. We know that RangeBreak is a trendy strategy, but there are also weaknesses in the trend strategy.
It should be noted that the original strategy used a simple high price of yesterday minus a low price of yesterday to calculate the magnitude of the price fluctuation. However, the ATR indicator can be used to calculate the magnitude of the price fluctuation, since the ATR represents the average true volatility of the price, as used in the ATR in the rules of the sea turtle.
In addition, the price movement of domestic commodity futures tends to be slower when they are up and sharper when they are down, so we can use N1 and N2 respectively when calculating up and down the track, which makes the strategy more flexible to deal with different market environments.
Policy source code
Summary
As with the design concept of the Range Break strategy, you never predict whether the market will eventually rise or fall, as long as the price of the day breaks down, the trader can only follow the direction of the market's price trend. You can also improve and upgrade this trading strategy according to your trading habits or market characteristics.
- Quantifying Fundamental Analysis in the Cryptocurrency Market: Let Data Speak for Itself!
- Quantified research on the basics of coin circles - stop believing in all kinds of crazy professors, data is objective!
- The inventor of the Quantitative Data Exploration Module, an essential tool in the field of quantitative trading.
- Mastering Everything - Introduction to FMZ New Version of Trading Terminal (with TRB Arbitrage Source Code)
- Get all the details about the new FMZ trading terminal (with the TRB suite source code)
- FMZ Quant: An Analysis of Common Requirements Design Examples in the Cryptocurrency Market (II)
- How to Exploit Brainless Selling Bots with a High-Frequency Strategy in 80 Lines of Code
- FMZ quantification: common demands on the cryptocurrency market design example analysis (II)
- How to exploit brainless robots for sale with high-frequency strategies of 80 lines of code
- FMZ Quant: An Analysis of Common Requirements Design Examples in the Cryptocurrency Market (I)
- FMZ quantification: common demands of the cryptocurrency market design instance analysis (1)