The strategic framework for the indicators
Author: Goodness, Created: 2019-07-19 10:26:37, Updated: 2023-10-25 19:58:42
The ATR is a moving average of the magnitude of stock price movements over a period of time, and is used primarily to determine when to buy or sell.
The averaged spread indicator is an indicator of market volatility, first proposed by Welles Wilder in his book The New Concept of the Hedge Technology Trading System, and has now become a frequently cited technique in many indicators. Wilder found that higher ATR values often occur at the bottom of the market and are accompanied by panic drops. When their values are lower, they tend to occur at the top of the market after the merger.
The indicator can usually reach a higher value at the bottom of the market due to a sharp drop in price driven by panic buying. This indicator is very typical for periods of long-term persistent marginal movements, which usually occur at the top of the market or during price consolidation. The average wavelength channel technical indicator can be interpreted according to the same principle as some other volatile indicator. The principle of making predictions based on this indicator can be expressed as: the higher the value of the indicator, the higher the probability of a change in the trend; the lower the value of the indicator, the weaker the trend mobility.
Calculation formula:
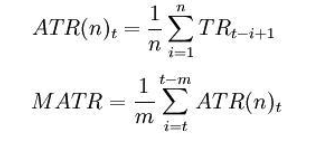
I'm not going to say anything. n is the length of time; The closing price on Saturday; The highest price on Saturday; The lowest price on Friday.
Some of them are: TRi = max ((Hi,Ci-1) -min ((Li,Ci-1)) Note: Generally n = 14. So, m is equal to 6.
The average indicator, whether it crosses the moving average from the bottom up or from the top down, is a research signal. It indicates the possibility of a reversal in the price trend, and the specifics of how it changes need to be combined with trend indicators for a comprehensive analysis.
The following is a trading strategy based on the Unified Width Indicator Framework, written in My language on the inventor quantification platform:
LOTS:=MAX(1,INTPART(MONEYTOT/(O*UNIT*0.1)));
C_O:EMA(C,N)-EMA(O,N);
B:=CROSSUP(C_O,0);
S:=CROSSDOWN(C_O,0);
TR:=MAX(MAX((H-L),ABS(REF(C,1)-H)),ABS(REF(C,1)-L));
ATR:MA(TR,N);
BAND:=ATR*0.1*M;
PRICE_BPK:=VALUEWHEN(B,H+BAND);
PRICE_SP:=VALUEWHEN(B,L-BAND);
PRICE_SPK:=VALUEWHEN(S,L-BAND);
PRICE_BP:=VALUEWHEN(S,H+BAND);

// 策略逻辑
// strategy logic
BARPOS>N AND C_O>0  AND C>=PRICE_BPK,BPK(LOTS);
BARPOS>N AND C_O<0  AND C<=PRICE_SPK,SPK(LOTS);

// 下单
// place an order
S,SP(BKVOL);
B,BP(SKVOL);

C<=PRICE_SP,SP(BKVOL);
C>=PRICE_BP,BP(SKVOL);
For more information, please see:https://www.fmz.com/strategy/128136
We used inventors' quantification platforms to retest and see:
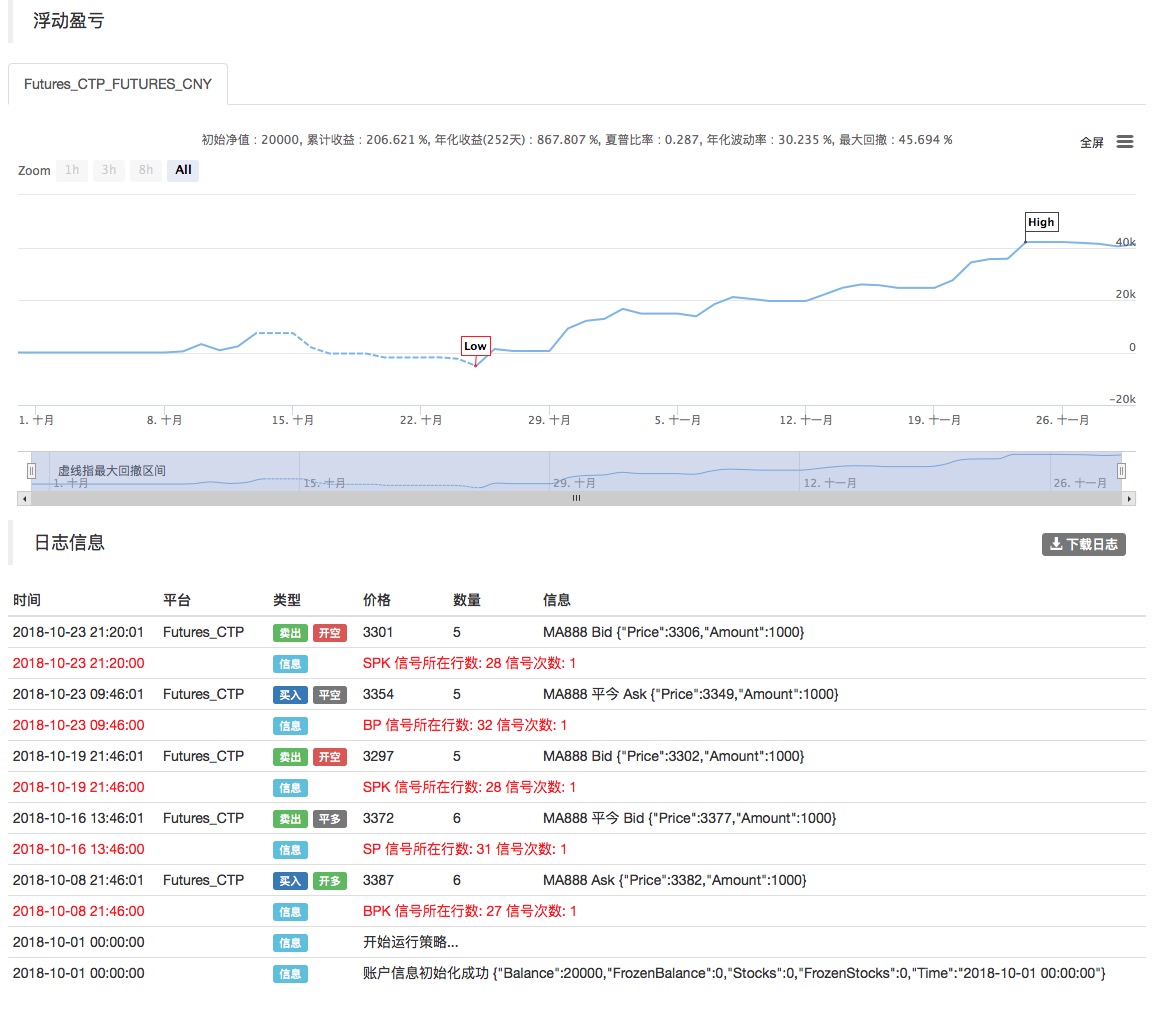
The above data is used for domestic commodity futures for review, and you can see that the result is very good, the reader can transfer the strategy to digital currency according to this framework, it should be noted that the digital currency market is mostly 24 hours continuous trading, if it is digital currency futures, not purely in the issue of delivery, most of the mainstream digital currency exchange futures contracts are continuous contracts. This in turn reduces many potential logical errors of judgment for our strategy.
- Quantifying Fundamental Analysis in the Cryptocurrency Market: Let Data Speak for Itself!
- Quantified research on the basics of coin circles - stop believing in all kinds of crazy professors, data is objective!
- The inventor of the Quantitative Data Exploration Module, an essential tool in the field of quantitative trading.
- Mastering Everything - Introduction to FMZ New Version of Trading Terminal (with TRB Arbitrage Source Code)
- Get all the details about the new FMZ trading terminal (with the TRB suite source code)
- FMZ Quant: An Analysis of Common Requirements Design Examples in the Cryptocurrency Market (II)
- How to Exploit Brainless Selling Bots with a High-Frequency Strategy in 80 Lines of Code
- FMZ quantification: common demands on the cryptocurrency market design example analysis (II)
- How to exploit brainless robots for sale with high-frequency strategies of 80 lines of code
- FMZ Quant: An Analysis of Common Requirements Design Examples in the Cryptocurrency Market (I)
- FMZ quantification: common demands of the cryptocurrency market design instance analysis (1)