The relative strengths and weaknesses of price-based quantitative trading strategies
Author: Goodness, Created: 2019-07-25 11:21:52, Updated: 2023-10-23 17:31:26
What is relative intensity?
Relative strength is a dynamic investment strategy that compares the performance of a stock, exchange-traded fund (ETF) or mutual fund to the performance of the market as a whole. By using specific calculations, investors can identify the strongest performers compared to the overall market and make investment recommendations. Relative strength assumes that the price of an asset that is rising will continue to rise, or at least extend its upward trajectory.
This property is established in probability regardless of any trading indicator, especially in digital currencies, where there is a reliable and large increase in the rate of return by quantifying the parameters of these upside factors.
Specific relative intensity
Relative strength creates a point of comparison between the performance of a particular trade indicator and the performance of the selected benchmark (e.g. market index) and other similar trade indicators. The relative strength strategy has both entry and exit; the investor uses this technique to buy the trade indicator with strong signs as soon as possible in the event that the relevant trade indicator starts to show weakness, while selling the trade indicator with weak signs. This investment strategy itself has a relative advantage and can also be applied to more complex strategies, such as pair trading.
Using the relative strengths to guide investment decisions
Investors can use relative strengths to determine the best performers in a selected pool of potential investments. This allows the performance of each indicator to be directly compared to the performance of another indicator or a selected benchmark (such as a basket of mainstream digital currency indices). Traditionally, investors used relative strengths to compare stocks against each other or indices. Investors can only compare mutual funds against each other based on the relevant net asset value (NAV) in addition to the number of stocks, using relative strengths and weaknesses.
Relative intensity analysis is at its best in markets with strong trends or themes to identify or indicate when is the best time to invest in them. But in emerging markets with no characteristics (shaky markets), it may not be as useful. Traditionally, investors can apply relatively strong trades to stocks, mutual funds, ETFs, fixed income, commodity futures markets, and other areas. In the digital currency market, more specifically, it can remind investors of the best investments in individual categories, such as whether they should choose small and medium-sized coins in strong performing currencies.
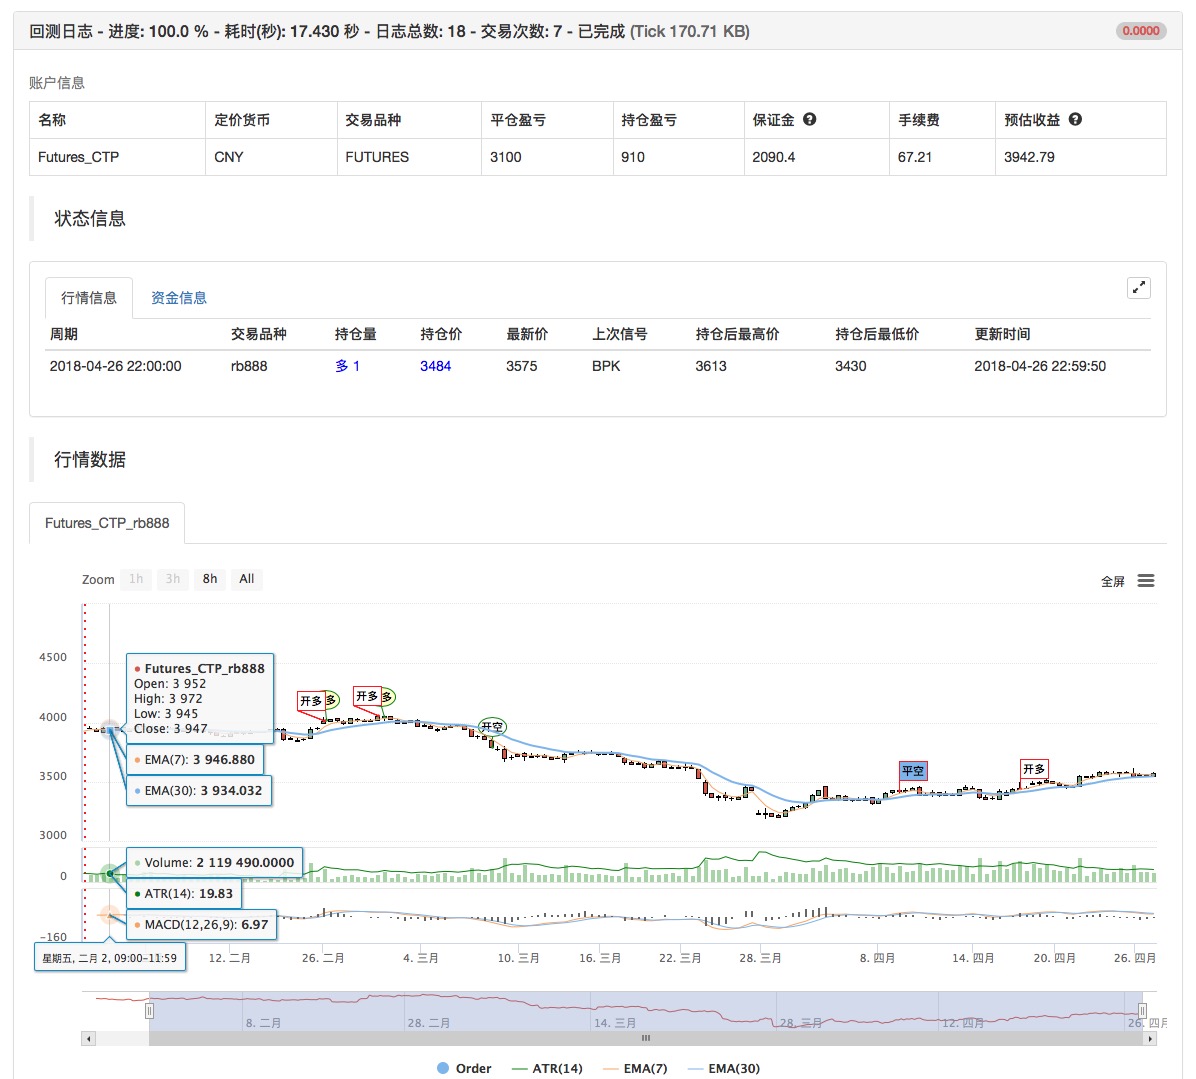
Relatively weak strategy to implement in inventor quantification platform
-
Strategy name: weak strategy based on relative price strength
-
The data cycle: 1H
-
Supported by: Commodity futures, digital currency, digital currency futures
-
The main image: The equator, with the formula: MAN^^MA ((C,N);
-
This is a sub-graph: No
MAN^^MA(C,N);
B_MA:=C>MAN;
S_MA:=C<MAN;

S_K1:=SUM((H-C)*V,N)/SUM((H-L)*V,N)>0.5;
B_K1:=SUM((C-L)*V,N)/SUM((H-L)*V,N)>0.5;

CO:=IF(C>O,C-O,0);
OC:=IF(C<O,O-C,0);
S_K2:=SUM(OC*V,N)/SUM(ABS(C-O)*V,N)>0.5;
B_K2:=SUM(CO*V,N)/SUM(ABS(C-O)*V,N)>0.5;

B_K1 AND B_K2 AND B_MA AND H>=HHV(H,N),BPK;
S_K1 AND S_K2 AND S_MA AND L<=LLV(L,N),SPK;

STOPLOSS:=M*MA(H-L,N);
C<BKPRICE-STOPLOSS,SP(BKVOL);
C>SKPRICE+STOPLOSS,BP(SKVOL);

S_MA AND BKHIGH>BKPRICE+STOPLOSS,SP(BKVOL);
B_MA AND SKLOW<SKPRICE-STOPLOSS,BP(SKVOL);
For the source code of the policy, please see:https://www.fmz.com/strategy/129078
- Quantifying Fundamental Analysis in the Cryptocurrency Market: Let Data Speak for Itself!
- Quantified research on the basics of coin circles - stop believing in all kinds of crazy professors, data is objective!
- The inventor of the Quantitative Data Exploration Module, an essential tool in the field of quantitative trading.
- Mastering Everything - Introduction to FMZ New Version of Trading Terminal (with TRB Arbitrage Source Code)
- Get all the details about the new FMZ trading terminal (with the TRB suite source code)
- FMZ Quant: An Analysis of Common Requirements Design Examples in the Cryptocurrency Market (II)
- How to Exploit Brainless Selling Bots with a High-Frequency Strategy in 80 Lines of Code
- FMZ quantification: common demands on the cryptocurrency market design example analysis (II)
- How to exploit brainless robots for sale with high-frequency strategies of 80 lines of code
- FMZ Quant: An Analysis of Common Requirements Design Examples in the Cryptocurrency Market (I)
- FMZ quantification: common demands of the cryptocurrency market design instance analysis (1)