The use of a combination strategy for the strength and weakness of the RSI versus the straight line
Author: Goodness, Created: 2019-07-31 14:28:28, Updated: 2023-10-20 20:16:39
Use of the equator in combination with the RSI
As for the horizontal strategy, which has been mentioned many times in previous articles and there are many real-world strategies for you to choose from, the horizontal strategy has always been valued by many CTA strategy enthusiasts due to its great advantage in terms of trend tracking, but for the market, which is still volatile most of the time, it is necessary to add some indicators for fluctuation judgement in combination with trend strategies. This will not only increase potential profitability, but also have great benefits for money management.
In this article, we will introduce one of the most popular oscillators: the Relative Strength and Weakness Index (RSI); you may have read some general articles about the RSI; however, in this article, I will introduce a trading strategy that can be used when trading that can be deployed on inventors' quantified platforms in combination with a straightforward strategy.
Principles and uses of the RSI
Before we delve into the strategy, let's first understand the RSI indicator and give you some basic introductions.
The RSI is one of the most popular indicators on the market.
The RSI is a basic indicator of a trading indicator's performance by comparing the strengths of rising and falling days. The number is calculated and ranges from 0 to 100. A reading above 70 is considered bullish, while a reading below 30 is considered bearish.
Relative strength and weakness index formula
The RSI was developed by J. Welles Wilder and detailed in June 1978 in his book New Concepts of the Silicon Technology Trading System. For all hardcore technical analysts, here is an example of the relative strength index formula.
The RSI is set to 14 days by default, so you can calculate it according to the following formula:
** Relative intensity = 1.25 (average increase over the past 13 K lines) + 0.25 (current increase) / 0.75 (average decrease over the past 13 K lines) + 0 (current decrease))
The relative strength is 1.50 / 0.75 = 2.
RSI = 100 - [100 /(1+2)] = 66.67**
Now that we know the formula for the relative intensity index, let's analyze how to use this powerful indicator.
Most traders use a relatively strong weak index to buy a trade mark only when the indicator reaches 30 and sell at 70, but if you do that, you will buy or sell at a loss according to this rule. The market does not reward anyone for the obvious. This does not mean that the simple approach does not work, but the simple approach followed by everyone has a lower probability.
Writing and implementing equity plus RSI strategies on inventor quantification platforms
Remember, we deployed this strategy to the inventor's quantification platform, and we still chose to program in a simple, easy-to-understand My language.
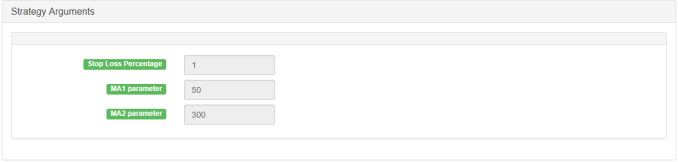
- Strategy name: Average and RSI relative strength/weakness combined strategy
- Cycle: 15 minutes, 30 minutes, and so on.
- Supported by: Commodity Futures, Digital Currency
The main image:
MA 1, formula: MA1 ^^ EMA (C, N1);
MA 2, formula: MA2 ^^ EMA (C, N2);
This is a sub-graph:
RSI, formula:
RSIVALUE:SMA(MAX(CLOSE-REF(CLOSE,1),0),LENGTH,1)/SMA(ABS(CLOSE-REF(CLOSE,1)),LENGTH,1)*100;
This is a video of the incident.
MA1^^EMA(C,N1);
MA2^^EMA(C,N2);

LENGTH:=9;
OVERBOUGHT:=70;
OVERSOLD:=100-OVERBOUGHT;
RSIVALUE:SMA(MAX(CLOSE-REF(CLOSE,1),0),LENGTH,1)/SMA(ABS(CLOSE-REF(CLOSE,1)),LENGTH,1)*100;
BUYK:=BKVOL=0 AND BARPOS>N2 AND MA1>MA2 AND C>MAX(MA1,MA2) AND CROSSUP(RSIVALUE,OVERBOUGHT);
SELLK:=SKVOL=0 AND BARPOS>N2 AND MA1<MA2 AND C<MIN(MA1,MA2) AND CROSSDOWN(RSIVALUE,OVERSOLD);
SELLY:=MA1<MA2 AND C>BKPRICE*(1+SLOSS*0.01);
BUYY:=MA1>MA2 AND C<SKPRICE*(1-SLOSS*0.01);
SELLS:=C<BKPRICE*(1-SLOSS*0.01);
BUYS:=C>SKPRICE*(1+SLOSS*0.01);

BUYK,BK;
SELLK,SK;
SELLY,SP(BKVOL);
BUYY,BP(SKVOL);
SELLS,SP(BKVOL);
BUYS,BP(SKVOL);
For the source code of the policy, please see:https://www.fmz.com/strategy/128250
- Quantifying Fundamental Analysis in the Cryptocurrency Market: Let Data Speak for Itself!
- Quantified research on the basics of coin circles - stop believing in all kinds of crazy professors, data is objective!
- The inventor of the Quantitative Data Exploration Module, an essential tool in the field of quantitative trading.
- Mastering Everything - Introduction to FMZ New Version of Trading Terminal (with TRB Arbitrage Source Code)
- Get all the details about the new FMZ trading terminal (with the TRB suite source code)
- FMZ Quant: An Analysis of Common Requirements Design Examples in the Cryptocurrency Market (II)
- How to Exploit Brainless Selling Bots with a High-Frequency Strategy in 80 Lines of Code
- FMZ quantification: common demands on the cryptocurrency market design example analysis (II)
- How to exploit brainless robots for sale with high-frequency strategies of 80 lines of code
- FMZ Quant: An Analysis of Common Requirements Design Examples in the Cryptocurrency Market (I)
- FMZ quantification: common demands of the cryptocurrency market design instance analysis (1)