A Dual Thrust digital currency quantified transaction strategy is implemented in Python
Author: Goodness, Created: 2019-08-13 14:52:58, Updated: 2023-10-19 21:10:01
The Dual Thrust trading algorithm is introduced
The Dual Thrust trading algorithm is a well-known quantitative trading strategy developed by Michael Chalek. It is commonly used in the futures, forex and stock markets. The concept of Dual Thrust is typical of breakthrough trading systems, which use a double-thrust brake system to construct updated retracements based on historical prices, which in theory makes it more stable in any given period.
In this article, we give detailed logical details of this strategy and show how to implement this algorithm on the inventor quantification platform. First, we select the historical price at which we trade, which is based on the closing price of the most recent N-days, the calculation of the highest and lowest prices.
We tested this strategy with a single pair of trades in two common market conditions, the trending market and the volatile market. The results showed that this dynamic trading system works better in trending markets, triggering some ineffective buy and sell signals in more volatile markets. In the interstitial market, we could adjust the parameters to get better returns.
The DT Strategy
Its logical prototype is a common intraday trading strategy. The opening range breakout strategy is based on today's opening price plus or minus a certain percentage of yesterday's width to determine the upward trajectory. When the price breaks the upper trajectory, it opens a buy position, and when it breaks the lower trajectory, it opens a blank position.
The Principles of Strategy
-
After closing, calculate the two values: the highest price - the closing price, the closing price - the lowest price. Then take the larger of these two values and multiply the value by 0.7. Let's call it the value K, and the K value we call the trigger value.
-
The next day after the market opens, the opening price is recorded and then immediately bought when the price is above (opening price + trigger value) or sold short when the price is below (opening price - trigger value).
-
This strategy has no obvious stop loss. The system is a reverse system, i.e. if there is a blank position order when the price is above the opening price + trigger value, then it will send two bids (one to close the wrong position, the other to open the right position). For the same reason, if there is a multi-head position price below the opening price - trigger value, then it will send two sell orders.
Mathematical expression of the DT strategy
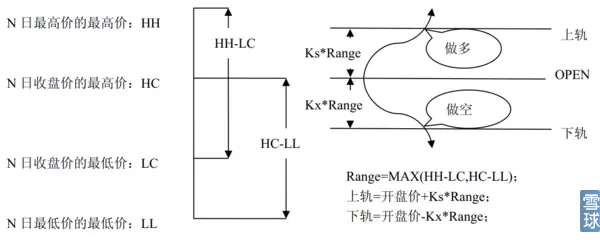
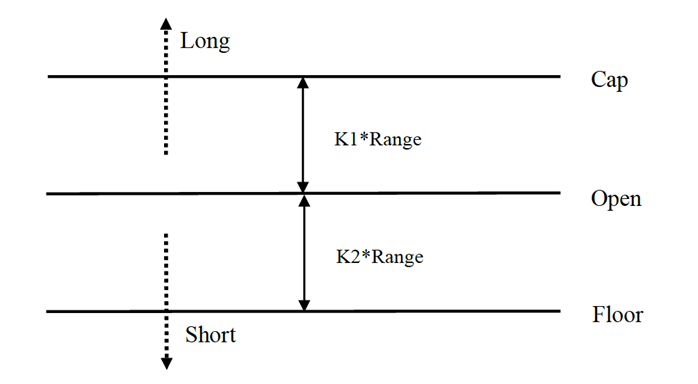
Range = maximum value (HH-LC, HC-LL)
The method of calculating the multihead signal is
cap = open + K1 × Rangecap = open + K1 × Range
The method of calculating the short-wave signal is
floor = open – K2 × Rangefloor = open – K2 × Range
where K1 and K2 are parameters. K1 triggers a multihead signal when K1 is larger than K2 and vice versa. For demonstration, we choose K1 = K2 = 0.5 In actual trading, we can still use historical data to optimize these parameters or adjust parameters according to market trends.
The system is a reversal system, so if an investor holds a short position when the price breaks out of the uptrend, he should clear the short position before opening a long position. If an investor holds a long position when the price breaks out of the uptrend, he should clear the long position before opening a new short position.
Improvements to the DT strategy:
In the range setting, the introduction of the four price points of the previous N days (high, open, low, close) makes the range relatively stable over a given period, which can be used for daily trend tracking.
The triggering conditions of this strategy are multiple and empty, considering the magnitude of the asymmetry, and the reference range of the multi-space transaction should be selected for a different number of cycles, which can also be determined by the parameters K1 and K2. When K1 < K2, the multihead signal is relatively easy to trigger, while when K1 > K2, the blank signal is relatively easy to trigger.
Therefore, when using this strategy, on the one hand, you can refer to the best parameters for historical data retrospection. On the other hand, you can adjust K1 and K2 based on your own judgment of the background or other major cyclical technical indicators.
This is a typical trading method of waiting for a signal, entering the market, taking a leverage, and then leaving the market, but it works very well.
Deploying the DT strategy on the inventor quantification platform
We opened it.FMZ.COMIn addition, the user can log in to their account, click on Control Center, deploy administrators and bots.
For more information on how to deploy hosts and bots, please refer to my previous post:https://www.fmz.com/bbs-topic/4140
Readers who want to buy their own cloud server deployment host can refer to this article:https://www.fmz.com/bbs-topic/2848
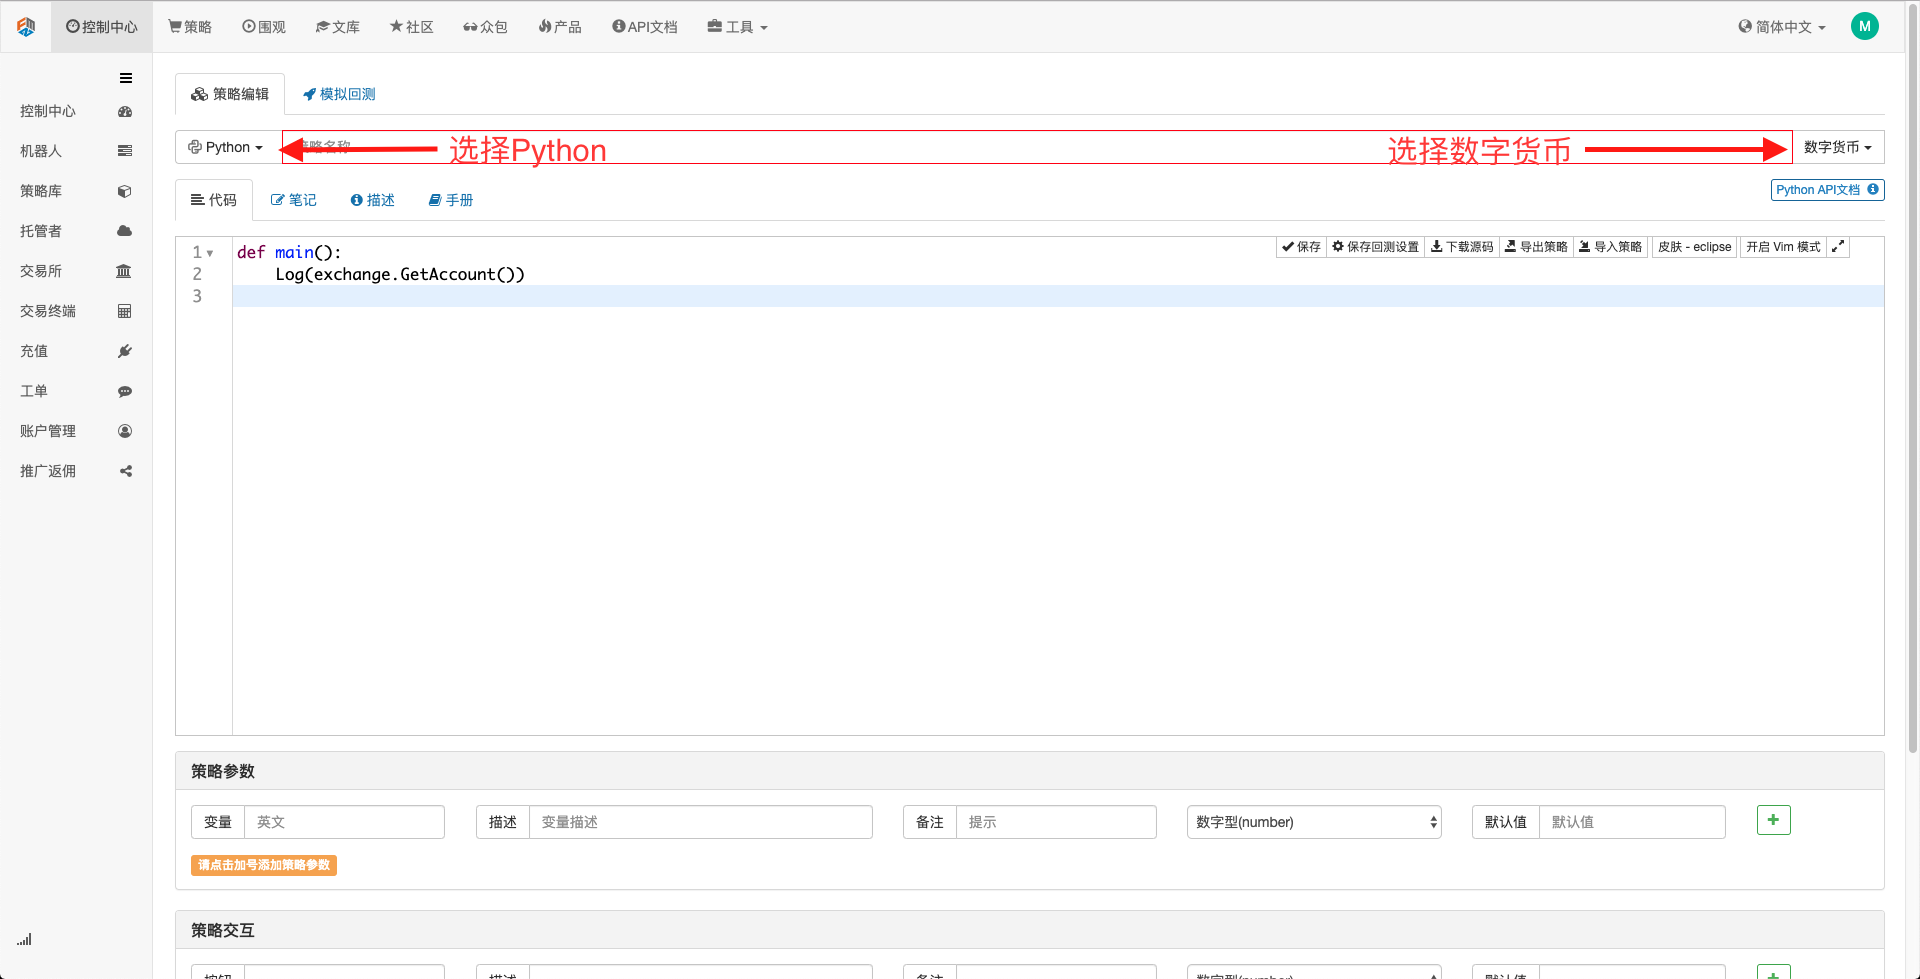
Next, we click on the policy library in the left-hand menu and click on Create Policy.
In the upper right corner of the writing policy page, remember to choose Python, as shown below:
Next we write the Python code in the code editor page, the code below, with very detailed line-by-line annotations that you can slowly understand and experience.
We tested this strategy with OKCoin futures:
import time # 这里需要引入python自带的时间库,后边的程序会用到

class Error_noSupport(BaseException): # 我们定义一个名为ChartCfg的全局class,用来初始化策略图表设置。对象有很多关于图表功能的属性。图表库为:HighCharts
    def __init__(self): # log出提示信息
        Log("只支持OKCoin期货!#FF0000")

class Error_AtBeginHasPosition(BaseException):
    def __init__(self):
        Log("启动时有期货持仓! #FF0000")

ChartCfg = {
    '__isStock': True, # 该属性用于控制是否显示为单独控制数据序列(可以在图表上取消单独一个数据序列的显示),如果指定__isStock: false, 则显示为普通图表
    'title': { # title为图表的主要标题
        'text': 'Dual Thrust 上下轨图' # title的一个属性text为标题的文本,这里设置为'Dual Thrust 上下轨图'该文本就会显示在标题位置
    },
    'yAxis': { # 图表坐标Y轴的相关设置
        'plotLines': [{ # Y轴上的水平线(和Y轴垂直),该属性的值是一个数组,即多条水平线的设置
            'value': 0, # 水平线在Y轴上的坐标值
            'color': 'red', # 水平线的颜色
            'width': 2, # 水平线的线宽
            'label': {  # 水平线上的标签
                'text': '上轨', # 标签的文本
                'align': 'center' # 标签的显示位置,这里设置为居中(即 :'center')
            },
        }, {       # 第二条水平线([{...},{...}]数组中的第二个元素)
            'value': 0, # 水平线在Y轴上的坐标值
            'color': 'green', # 水平线的颜色
            'width': 2,  # 水平线的线宽
            'label': { # 标签
                'text': '下轨',
                'align': 'center'
            },
        }]
    },
    'series': [{ # 数据序列,即用来在图表上显示数据线、K线、标记等等内容的数据。也是一个数组第一个索引为0。
        'type': 'candlestick', # 索引为0数据序列的类型:'candlestick' 表示为K线图
        'name': '当前周期',  # 数据序列的名称
        'id': 'primary', # 数据序列的ID,用于下一个数据序列相关设置。
        'data': []  # 数据序列的数组,用于储存具体的K线数据
    }, {
        'type': 'flags',  # 数据序列,类型:'flags',在图表上显示标签,表示做多和做空。索引为1。
        'onSeries': 'primary',  # 这个属性表示标签显示在id为'primary'上。
        'data': []    # 保存标签数据的数组。
    }]
}

STATE_IDLE = 0  # 状态常量,表示空闲
STATE_LONG = 1 # 状态常量,表示持多仓
STATE_SHORT = 2 # 状态常量,表示持空仓
State = STATE_IDLE # 表示当前程序状态 ,初始赋值为空闲

LastBarTime = 0  # K线最后一柱的时间戳(单位为毫秒,1000毫秒等于1秒,时间戳是1970年1月1日到现在时刻的毫秒数是一个很大的正整数)
UpTrack = 0   # 上轨值
BottomTrack = 0 # 下轨值
chart = None # 用于接受Chart这个API函数返回的图表控制对象。用该对象(chart)可以调用其成员函数向图表内写入数据。
InitAccount = None # 初始账户情况
LastAccount = None # 最新账户情况
Counter = { # 计数器,用于记录盈亏次数
    'w': 0, # 赢次数
    'l': 0  # 亏次数
}

def GetPosition(posType):  # 定义一个函数,用来存储账户持仓信息
    positions = exchange.GetPosition() # exchange.GetPosition()是发明者量化的官方API,关于它的用法,请参考我的官方API文档:https://www.fmz.com/api
    return [{'Price': position['Price'], 'Amount': position['Amount']} for position in positions if position['Type'] == posType] # 返回各种持仓信息

def CancelPendingOrders(): # 定义一个函数,专门用来撤单
    while True: # 循环检查
        orders = exchange.GetOrders() # 如果有持仓
        [exchange.CancelOrder(order['Id']) for order in orders if not Sleep(500)] # 撤单语句
        if len(orders) == 0: # 逻辑判断
            break

def Trade(currentState,nextState): # 定义一个函数,用来判断下单逻辑
    global InitAccount,LastAccount,OpenPrice,ClosePrice # 定义全局作用域
    ticker = _C(exchange.GetTicker) # 关于_C的用法,请参考:https://www.fmz.com/api
    slidePrice = 1 # 定义滑点值
    pfn = exchange.Buy if nextState == STATE_LONG else exchange.Sell # 买卖判断逻辑
    if currentState != STATE_IDLE: # 循环开始
        Log(_C(exchange.GetPosition)) # 日志信息
        exchange.SetDirection("closebuy" if currentState == STATE_LONG else "closesell") # 调整下单方向,特别是下过单后
        while True:
            ID = pfn( (ticker['Last'] - slidePrice) if currentState == STATE_LONG else (ticker['Last'] + slidePrice), AmountOP) # 限价单,ID = pfn(-1, AmountOP)为市价单,ID = pfn(AmountOP)为市价单
            Sleep(Interval) # 休息一阵,防止API访问频率过快,账户被封。
            Log(exchange.GetOrder(ID)) # Log信息
            ClosePrice = (exchange.GetOrder(ID))['AvgPrice'] # 设置收盘价
            CancelPendingOrders() # 调用撤单函数
            if len(GetPosition(PD_LONG if currentState == STATE_LONG else PD_SHORT)) == 0: # 撤单逻辑
                break
        account = exchange.GetAccount() # 获取账户信息
        if account['Stocks'] > LastAccount['Stocks']: # 如果当前账户币值大于之前账户币值
            Counter['w'] += 1 # 盈亏计数器中,盈利次数加一
        else:
            Counter['l'] += 1 # 否者亏损次数加一
        Log(account) # log信息
        LogProfit((account['Stocks'] - InitAccount['Stocks']),"收益率:", ((account['Stocks'] - InitAccount['Stocks']) * 100 / InitAccount['Stocks']),'%')
        Cal(OpenPrice,ClosePrice)
        LastAccount = account

    exchange.SetDirection("buy" if nextState == STATE_LONG else "sell") # 这一段的逻辑同上,不再详述
    Log(_C(exchange.GetAccount))
    while True:
        ID = pfn( (ticker['Last'] + slidePrice) if nextState == STATE_LONG else (ticker['Last'] - slidePrice), AmountOP)
        Sleep(Interval)
        Log(exchange.GetOrder(ID))
        CancelPendingOrders()
        pos = GetPosition(PD_LONG if nextState == STATE_LONG else PD_SHORT)
        if len(pos) != 0:
            Log("持仓均价",pos[0]['Price'],"数量:",pos[0]['Amount'])
            OpenPrice = (exchange.GetOrder(ID))['AvgPrice']
            Log("now account:",exchange.GetAccount())
            break

def onTick(exchange): # 程序主要函数,程序主要逻辑都是在该函数内处理。
    global LastBarTime,chart,State,UpTrack,DownTrack,LastAccount # 定义全局作用域
    records = exchange.GetRecords() # 关于exchange.GetRecords()的用法,请参见:https://www.fmz.com/api
    if not records or len(records) <= NPeriod: # 防止发生意外的判断语句
        return
    Bar = records[-1] # 取records K线数据的倒数第一个元素,也就是最后一个bar
    if LastBarTime != Bar['Time']:
        HH = TA.Highest(records, NPeriod, 'High')  # 声明HH变量,调用TA.Highest函数计算当前K线数据NPeriod周期内最高价的最大值赋值给HH。
        HC = TA.Highest(records, NPeriod, 'Close') # 声明HC变量,获取NPeriod周期内的收盘价的最大值。
        LL = TA.Lowest(records, NPeriod, 'Low') # 声明LL变量,获取NPeriod周期内的最低价的最小值。
        LC = TA.Lowest(records, NPeriod, 'Close') # 声明LC变量,获取NPeriod周期内的收盘价的最小值。具体TA相关的应用,请参见官方API文档。

        Range = max(HH - LC, HC - LL)  # 计算出范围
        UpTrack = _N(Bar['Open'] + (Ks * Range))  # 根据界面参数的上轨系数Ks最新K线柱的开盘价等,计算出上轨值。
        DownTrack = _N(Bar['Open'] - (Kx * Range)) # 计算下轨值
        if LastBarTime > 0: # 由于LastBarTime该变量初始化设置的值为0,所以第一次运行到此处LastBarTime > 0必定是false,不会执行if块内的代码,而是会执行else块内的代码
            PreBar = records[-2] # 声明一个变量含义是“前一个Bar”把当前K线的倒数第二Bar赋值给它。
            chart.add(0, [PreBar['Time'], PreBar['Open'], PreBar['High'], PreBar['Low'], PreBar['Close']], -1) # 调用chart图标控制类的add函数更新K线数据(用获取的K线数据的倒数第二Bar去更新图标的倒数第一个Bar,因为有新的K线Bar生成)
        else:  # chart.add函数的具体用法请参见API文档,和论坛里的文章。程序第一次运行到此必定执行else块内代码,主要作用是把第一次获取的K线一次性全部添加到图表上。
            for i in range(len(records) - min(len(records), NPeriod * 3), len(records)): # 此处执行一个for循环,循环次数使用K线长度和NPeriod的3倍二者中最小的值,可以保证初始的K线不会画的太多太长。索引是从大到小的。
                b = records[i] # 声明一个临时变量b用来取每次循环索引为records.length - i的K线柱数据。
                chart.add(0,[b['Time'], b['Open'], b['High'], b['Low'], b['Close']]) # 调用chart.add函数向图表添加K线柱,注意add函数最后一个参数如果传入-1就是更新图表上最后一个Bar(柱),如果没传参数,就是向最后添加Bar。执行完i等于2这次循环后(i-- 了已经,此时为1了),就会触发i > 1为false停止循环,可见此处代码只处理到records.length - 2这个Bar,最后一个Bar没有处理。
        chart.add(0,[Bar['Time'], Bar['Open'], Bar['High'], Bar['Low'], Bar['Close']]) # 由于以上if的2个分支都没处理records.length - 1这个Bar,所以此处处理。添加最新出现的Bar到图表中。
        ChartCfg['yAxis']['plotLines'][0]['value'] = UpTrack  # 把计算出来的上轨值赋值给图表对象(区别于图表控制对象chart),用于稍后显示。
        ChartCfg['yAxis']['plotLines'][1]['value'] = DownTrack # 赋值下轨值
        ChartCfg['subtitle'] = { # 设置副标题
            'text': '上轨' + str(UpTrack) + '下轨' + str(DownTrack) # 副标题文本设置,在副标题上显示出上轨下轨值。
        }
        chart.update(ChartCfg) # 用图表类ChartCfg更新图表
        chart.reset(PeriodShow) # 刷新根据界面参数设置的PeriodShow变量,只保留PeriodShow的值数量的K线柱。

        LastBarTime = Bar['Time'] # 此次新产生的Bar的时间戳更新,给LastBarTime用于判断下次循环获取的K线数据最后一个Bar,是否是新产生的。
    else: # 如果LastBarTime等于Bar.Time即:没有新的K线Bar产生。则执行一下{..}内代码
        chart.add(0,[Bar['Time'], Bar['Open'], Bar['High'], Bar['Low'], Bar['Close']], -1) # 用当前K线数据的最后一个Bar(K线的最后一个Bar即当前周期的Bar是不断在变化的),更新图表上的最后一个K线柱。
    LogStatus("Price:", Bar["Close"], "up:", UpTrack, "down:", DownTrack, "wins:", Counter['w'], "losses:", Counter['l'], "Date:", time.time()) # 调用LogStatus函数显示当前策略的数据在状态栏上。
    msg = "" # 定义一个变量msg。
    if State == STATE_IDLE or State == STATE_SHORT: # 判断当前状态变量State是否等于空闲或者State是否等于持空仓,在空闲状态下可以触发做多,在持空仓状态下可以触发平多仓,并反手。
        if Bar['Close'] >= UpTrack: # 如果当前K线的收盘价大于上轨值,执行if块内代码。
            msg = "做多,触发价:" + str(Bar['Close']) + "上轨" + str(UpTrack) # 给msg赋值,把需要显示的数值组合成字符串。
            Log(msg) # 信息
            Trade(State, STATE_LONG) # 调用上边的Trade函数进行交易
            State = STATE_LONG # 无论开多仓还是反手,此刻程序状态要更新为持多仓。
            chart.add(1,{'x': Bar['Time'], 'color': 'red', 'shape': 'flag', 'title': '多', 'text': msg}) # 在K线相应的位置添加一个标记显示开多。

    if State == STATE_IDLE or State == STATE_LONG: # 做空方向与以上同理,不在赘述。代码完全一致。
        if Bar['Close'] <= DownTrack:
            msg = "做空,触发价:" + str(Bar['Close']) + "下轨" + str(DownTrack)
            Log(msg)
            Trade(State, STATE_SHORT)
            State = STATE_SHORT
            chart.add(1,{'x': Bar['Time'], 'color': 'green', 'shape': 'circlepin', 'title': '空', 'text': msg})

OpenPrice = 0 # 初始化OpenPrice和ClosePrice
ClosePrice = 0
def Cal(OpenPrice, ClosePrice): # 定义一个Cal函数,用来计算策略运行后的盈亏情况
    global AmountOP,State
    if State == STATE_SHORT:
        Log(AmountOP,OpenPrice,ClosePrice,"策略盈亏:", (AmountOP * 100) / ClosePrice - (AmountOP * 100) / OpenPrice, "个币,  手续费:", - (100 * AmountOP * 0.0003), "美元,折合:", _N( - 100 * AmountOP * 0.0003/OpenPrice,8), "个币")
        Log(((AmountOP * 100) / ClosePrice - (AmountOP * 100) / OpenPrice) + (- 100 * AmountOP * 0.0003/OpenPrice))
    if State == STATE_LONG:
        Log(AmountOP,OpenPrice,ClosePrice,"策略盈亏:", (AmountOP * 100) / OpenPrice - (AmountOP * 100) / ClosePrice, "个币,  手续费:", - (100 * AmountOP * 0.0003), "美元,折合:", _N( - 100 * AmountOP * 0.0003/OpenPrice,8), "个币")
        Log(((AmountOP * 100) / OpenPrice - (AmountOP * 100) / ClosePrice) + (- 100 * AmountOP * 0.0003/OpenPrice))

def main(): # 策略程序的主函数。(入口函数)
    global LoopInterval,chart,LastAccount,InitAccount # 定义全局作用域
    if exchange.GetName() != 'Futures_OKCoin':  # 判断添加的交易所对象的名称(通过exchange.GetName函数获取)如果不等于'Futures_OKCoin'即:添加的不是OKCoin期货交易所对象。
        raise Error_noSupport # 抛出异常
    exchange.SetRate(1) # 设置交易所的各种参数
    exchange.SetContractType(["this_week","next_week","quarter"][ContractTypeIdx])  # 确定要交易的哪种具体合约。
    exchange.SetMarginLevel([10,20][MarginLevelIdx]) # 设置保证金率,也就是杠杆。

    if len(exchange.GetPosition()) > 0: # 设置容错机制
        raise Error_AtBeginHasPosition
    CancelPendingOrders()
    InitAccount = LastAccount = exchange.GetAccount()
    LoopInterval = min(1,LoopInterval)
    Log("交易平台:",exchange.GetName(), InitAccount)
    LogStatus("Ready...")

    LogProfitReset()
    chart = Chart(ChartCfg)
    chart.reset()

    LoopInterval = max(LoopInterval, 1)
    while True: # 循环整个交易逻辑,调用onTick函数
        onTick(exchange)
        Sleep(LoopInterval * 1000) # 休息一阵,防止API访问频率过快,账户被封。
After writing the code, please note that we have not yet completed the writing part of the entire policy, next we need to add the parameters used in the policy to the policy writing page, the method of adding is very simple, just click on the policy writing dialog box below the addition of the numbers one by one.
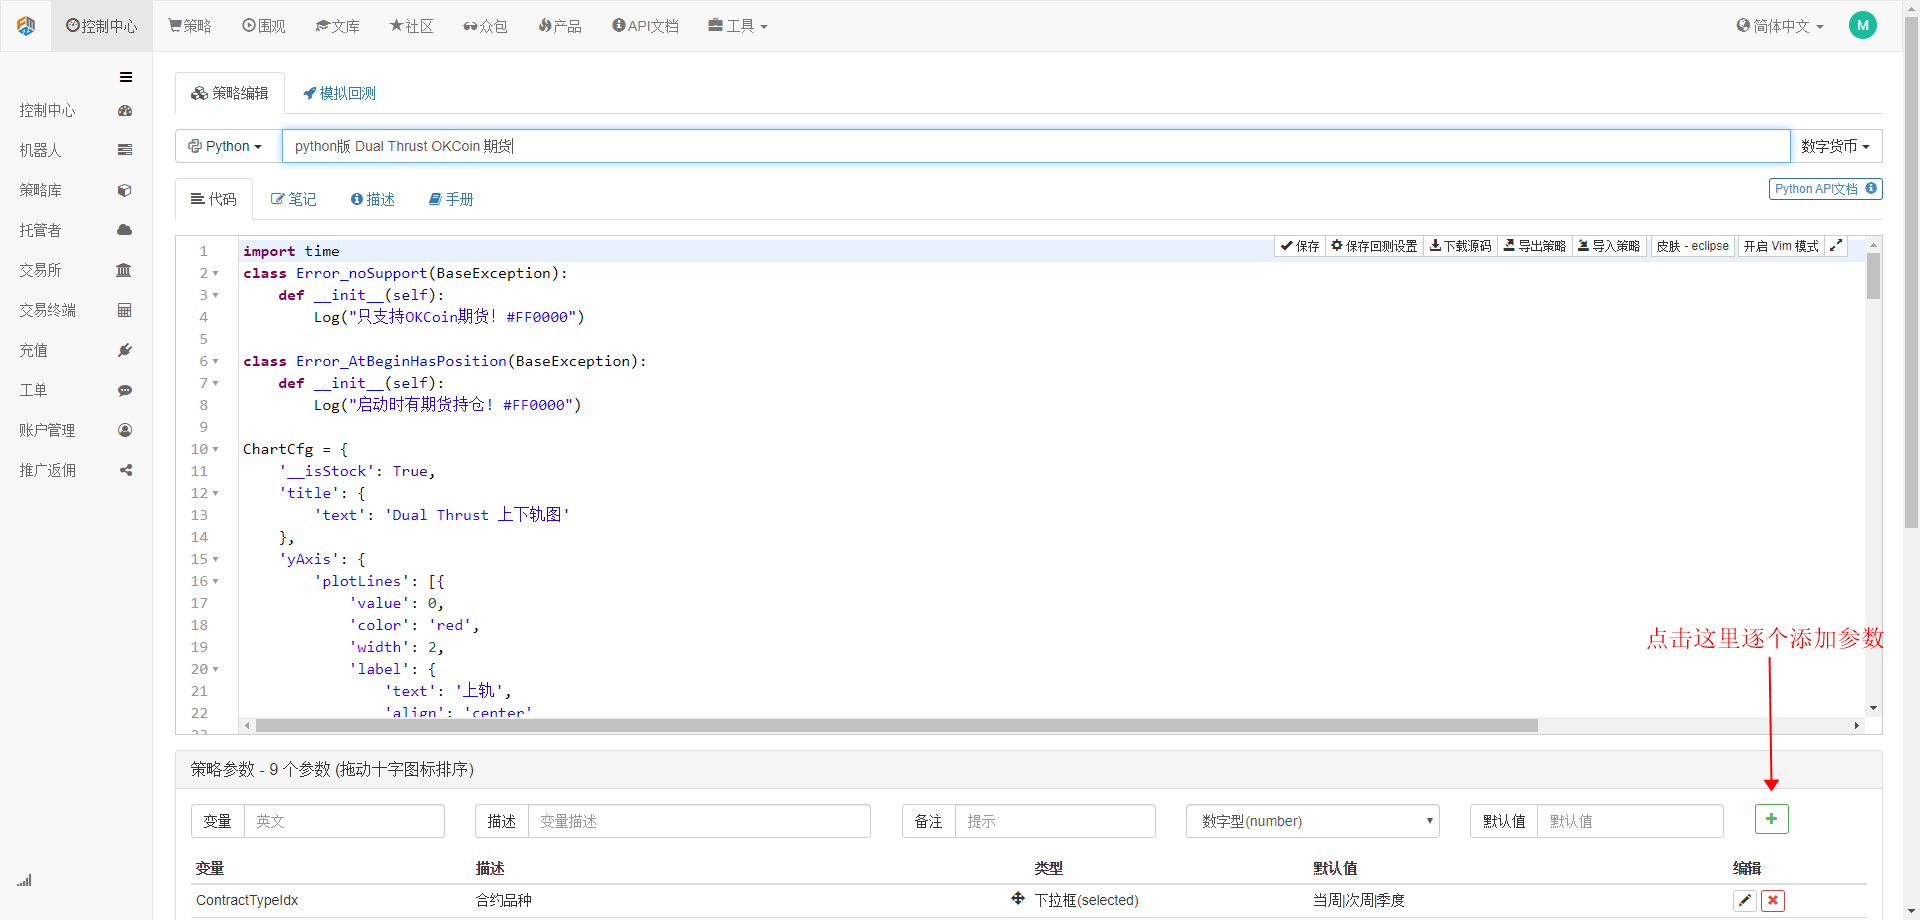
The following content needs to be added:
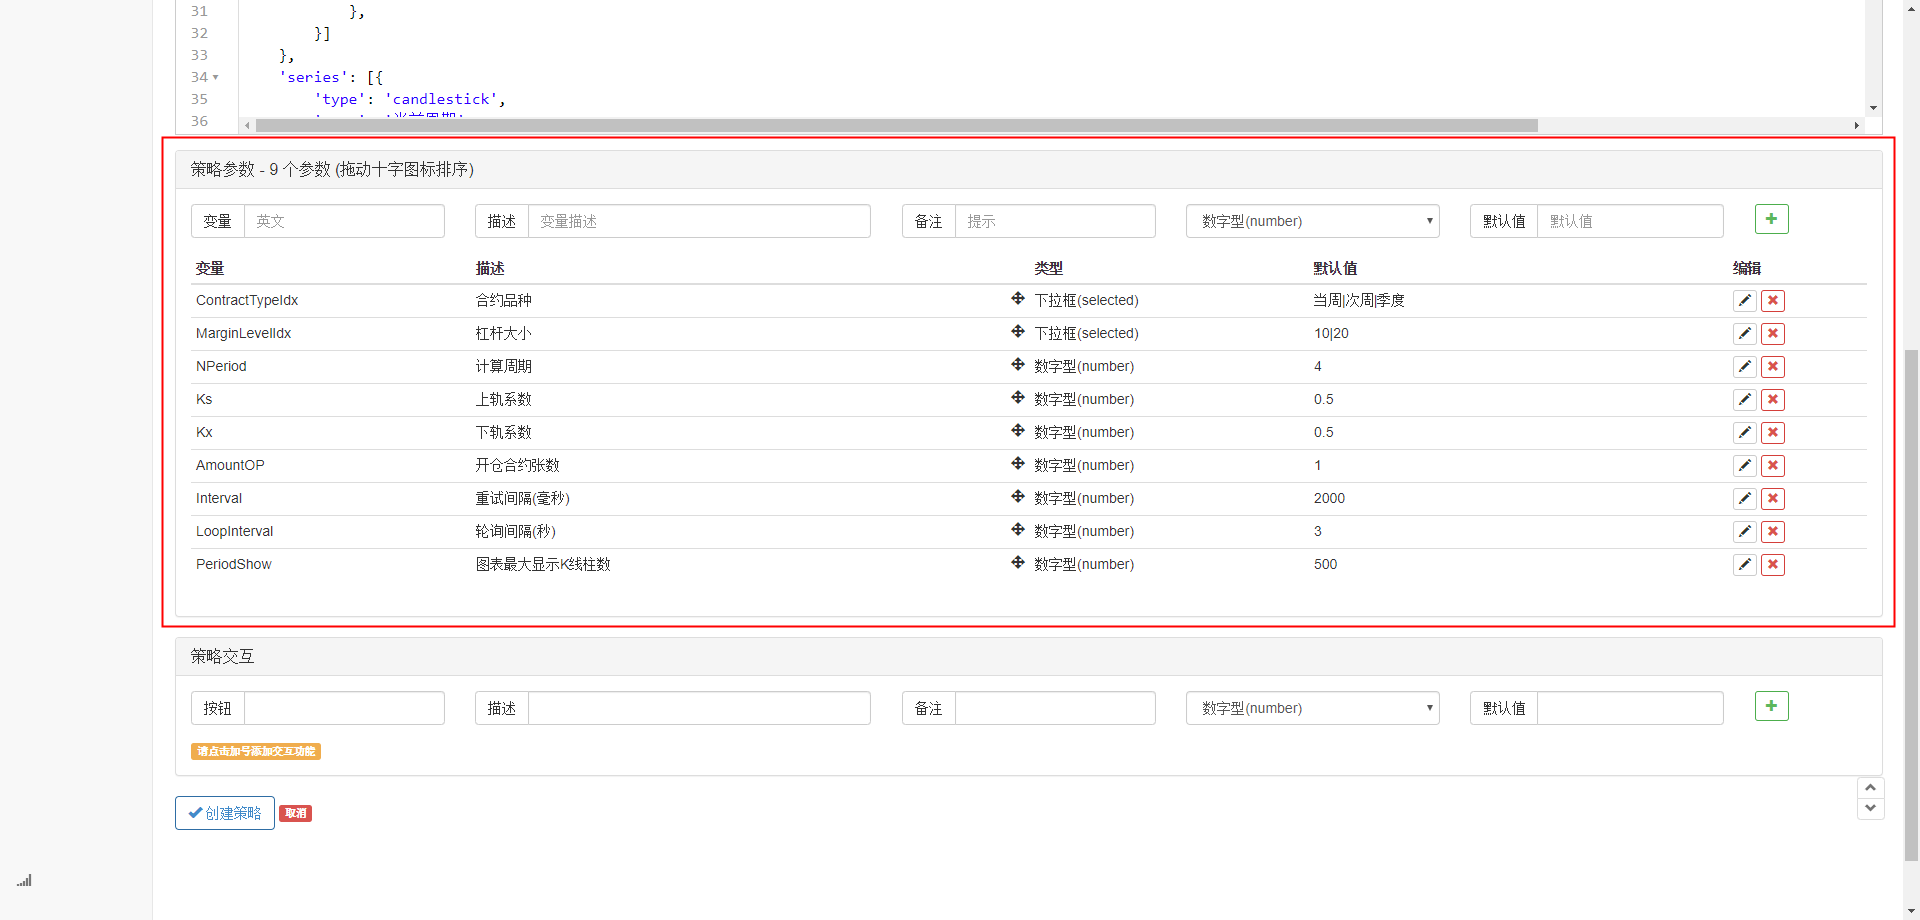
At this point, we've finally completed the writing part of the strategy, and next, let's start retesting the strategy.
Strategic retesting
After writing a strategy, the first thing we do is review it to see how it performs in the historical data, but please note, readers, that the results of the review do not equal future predictions, the review can only be used as a reference information to consider the effectiveness of our strategy. Once the market changes and the strategy starts to show large losses, we should identify the problem in time and then change the strategy to adapt to the new market environment, such as the threshold mentioned above.
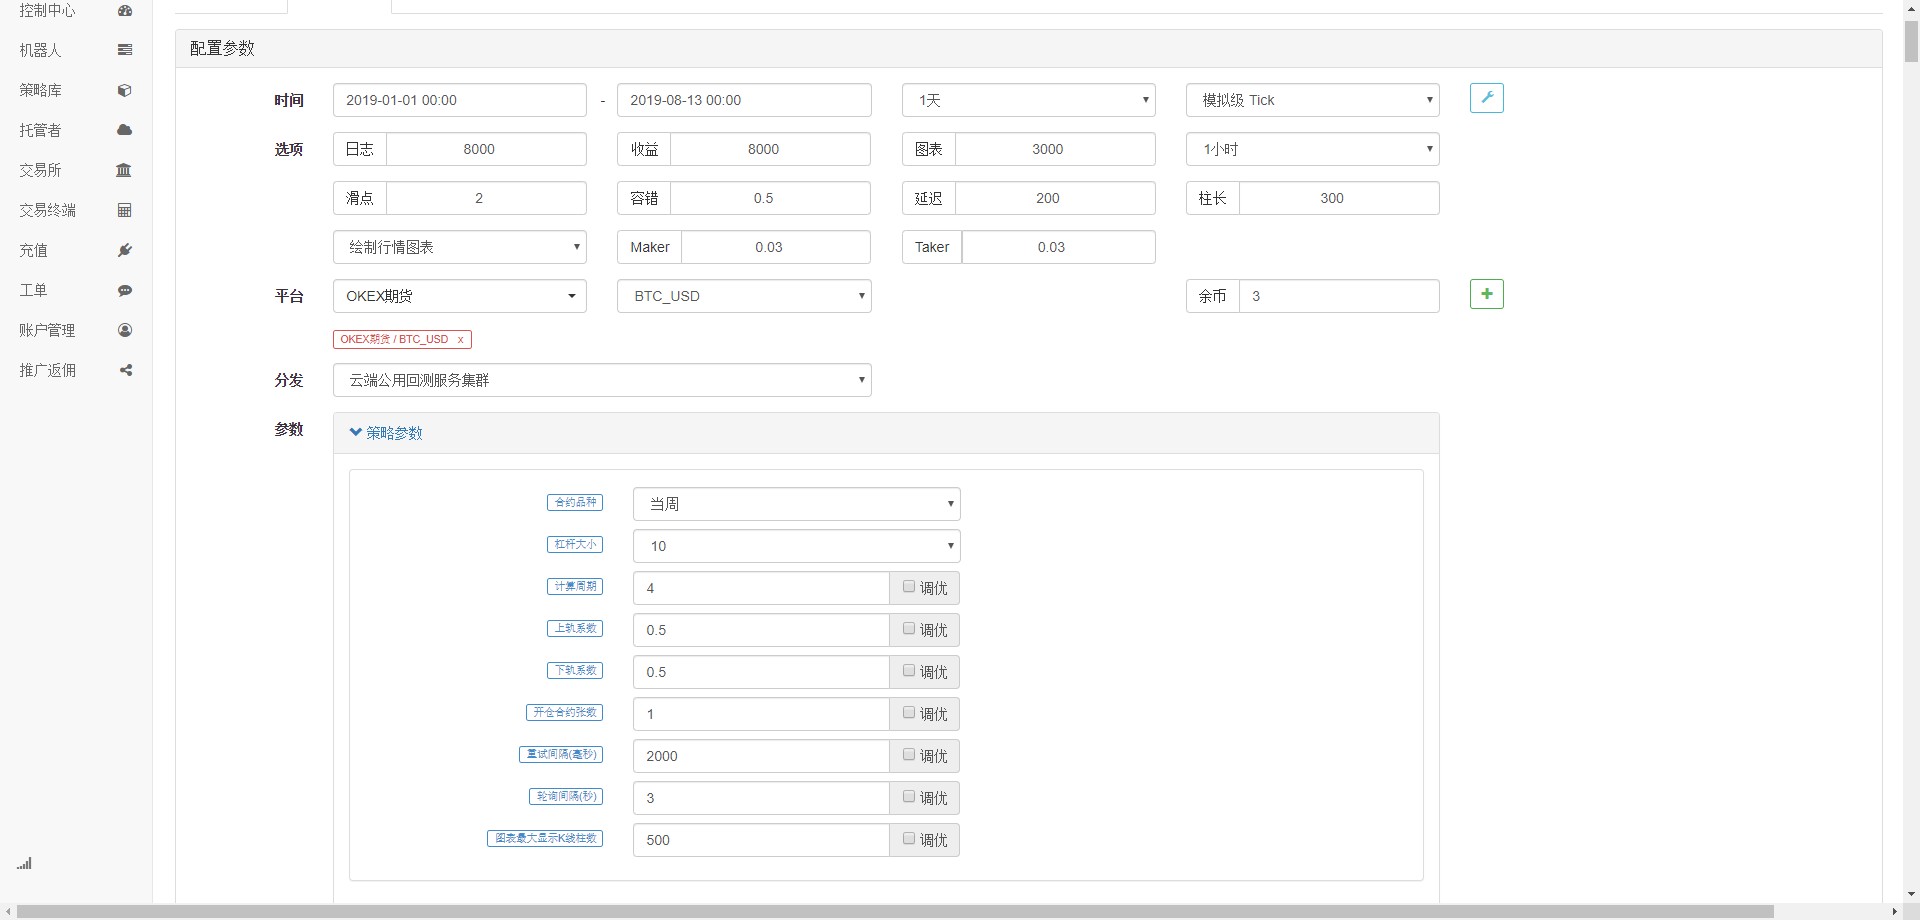
Click on the policy edit page for analogue debugging, where parameters can be adjusted according to different needs, making it convenient and quick to debug, especially for logically complex, parameter-rich policies, without having to go back to the source code, and make individual modifications.
We select the most recent half-year, click Add OKCoin futures exchange, select BTC trading indicator.
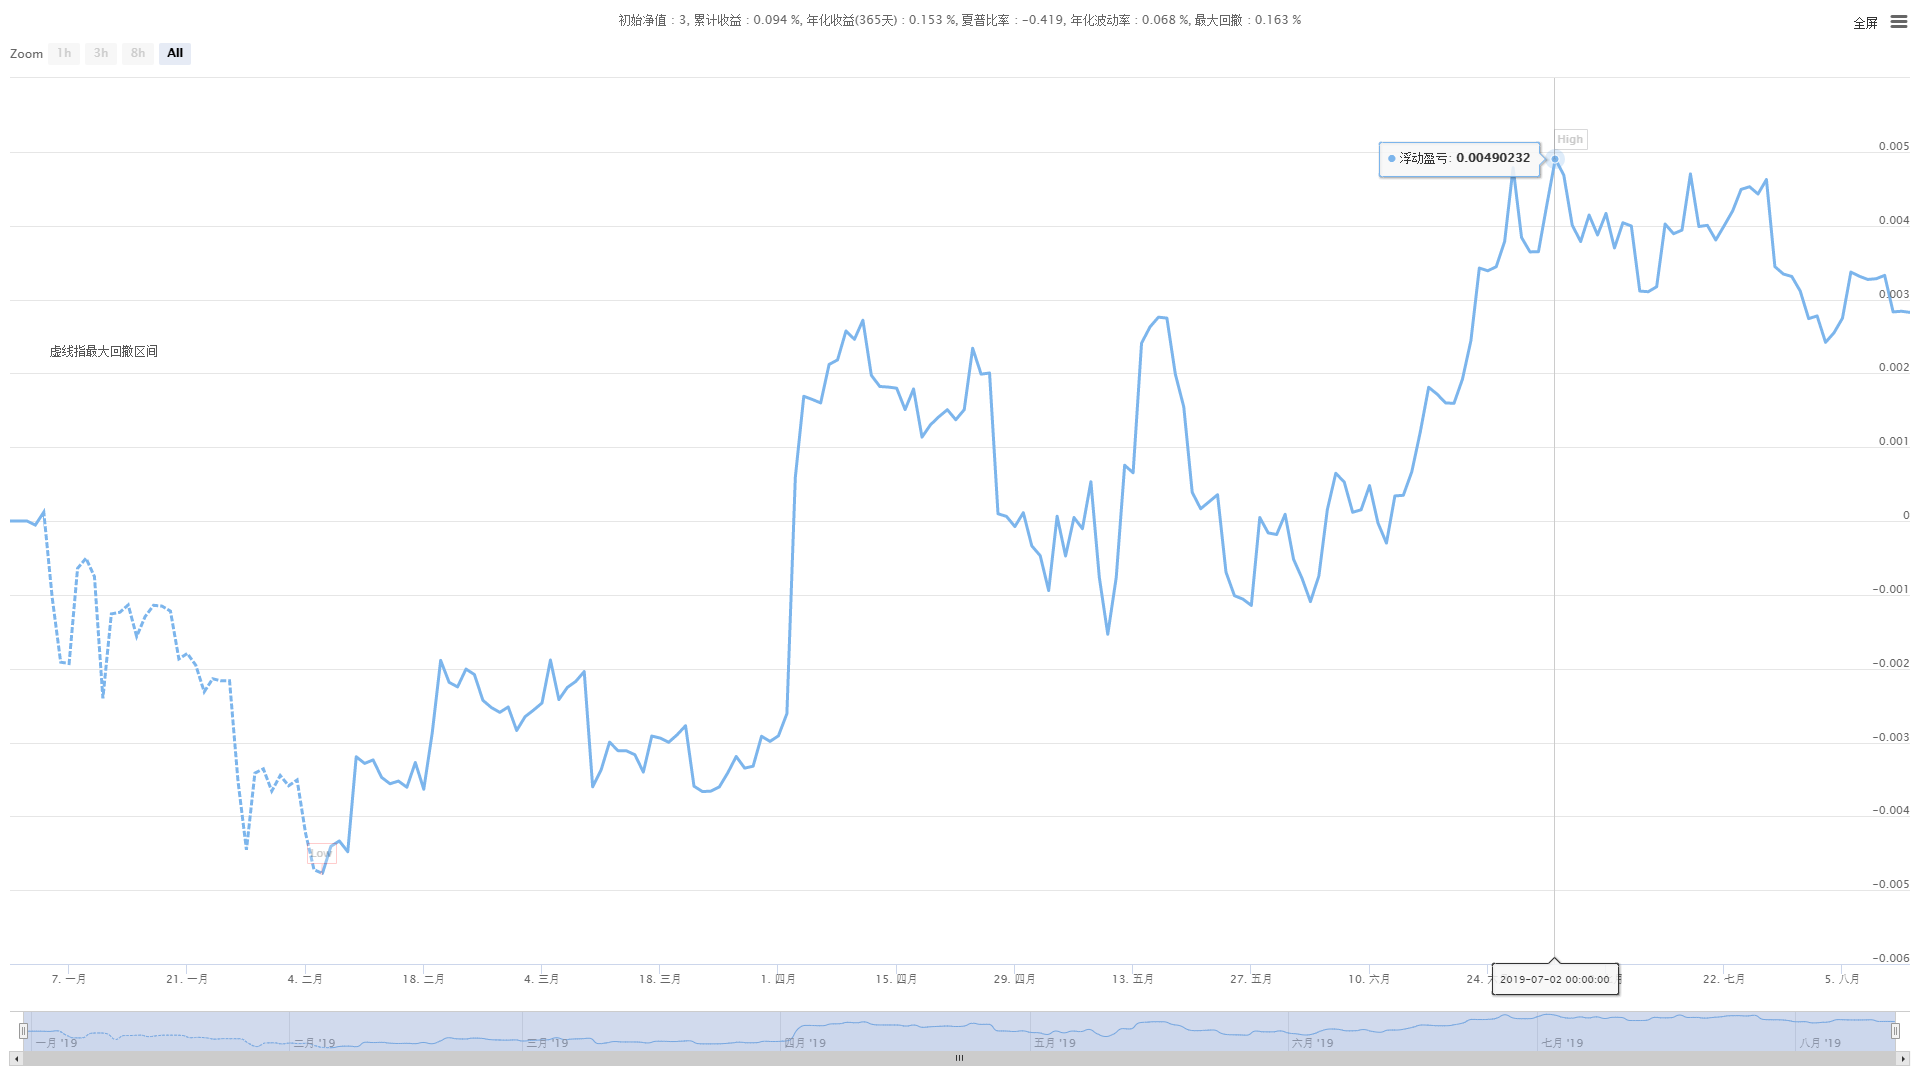
As you can see, the strategy has reaped good returns in the last six months due to the very good unilateral trend of BTC.

Friends with problems can come.https://www.fmz.com/bbsThe inventors of the Quantitative Platform have professional people ready to answer any questions you may have about the strategy or technology of the platform.
- Quantifying Fundamental Analysis in the Cryptocurrency Market: Let Data Speak for Itself!
- Quantified research on the basics of coin circles - stop believing in all kinds of crazy professors, data is objective!
- The inventor of the Quantitative Data Exploration Module, an essential tool in the field of quantitative trading.
- Mastering Everything - Introduction to FMZ New Version of Trading Terminal (with TRB Arbitrage Source Code)
- Get all the details about the new FMZ trading terminal (with the TRB suite source code)
- FMZ Quant: An Analysis of Common Requirements Design Examples in the Cryptocurrency Market (II)
- How to Exploit Brainless Selling Bots with a High-Frequency Strategy in 80 Lines of Code
- FMZ quantification: common demands on the cryptocurrency market design example analysis (II)
- How to exploit brainless robots for sale with high-frequency strategies of 80 lines of code
- FMZ Quant: An Analysis of Common Requirements Design Examples in the Cryptocurrency Market (I)
- FMZ quantification: common demands of the cryptocurrency market design instance analysis (1)
- Quantitative analysis of the digital currency market
- K-line data processing in programmatic transactions is trivial
MAIDOVEThis strategy should not have a stop-loss and a stop-loss policy?