The C++ version of the OKEX contract hedging strategy.
Author: The Little Dream, Created: 2019-08-26 14:30:47, Updated: 2023-10-19 21:09:01
The C++ version of the OKEX contract hedging strategy.
Speaking of hedging strategies, there are many different strategies, many different combinations, many different ideas in different markets. We started with the most classic cross-term hedging to explore the design ideas and concepts of hedging strategies. Today, the digital currency market is much more active than when the market began, and many contract exchanges have emerged, offering a large number of leveraged hedging opportunities.
-
The Principles of Strategy
The reason why the strategy is somewhat hardcore is that it is written in C++ and is slightly difficult to read. But it does not prevent the reader from learning the essence of the strategy design and thinking. The strategy is concise, the length of the code is moderate, only more than 500 lines. In terms of design, the strategy structure is reasonable, the coding density is low, it is easy to expand or optimize. Logical thinking is clear, such a design is not only easy to use and expand. As a teaching strategy, learning strategy design is also a good example. In addition, the company has also been involved in a number of other projects, such as the creation of a new website and the creation of a website. In addition, the government has also announced that it will be closing down the country's oil refinery. Once the basic principles are clear, the remainder is the strategy of how to trigger a hedge, how to equalize, how to increase the position. Hedging strategies focus primarily on fluctuations in the price of the underlying commodity, trading back the difference. However, there is the possibility of small, large or one-sided shocks. This creates uncertainty in hedging gains and losses, but the risk is still far less than a unilateral trend. Many of the optimizations for the long-term strategy are chosen from the position control level, from the opening position trigger. For example, the classic Brin indicator is used as a hedging strategy when the price fluctuates.
-
Code analysis of the strategy
The code is divided into four main sections.
- 1. List value definition, defining some state values, used for marking the state. Some functional functions that are not related to the policy idea, such as url encoding functions, time conversion functions, etc., are not related to the policy idea and are only used for data processing.
- 2.K线数据生成器类:策略由该生成器类对象生成的K线数据驱动。
- 3.对冲类:该类的对象可以执行具体的交易逻辑,对冲操作、策略细节的处理机制等。
- 4.策略主函数,也就是
mainThe function ≠ ∞mainThe function is the input function of the strategy, the main loop is executed within the function, and the function also performs an important operation, which is to access the websocket interface of the exchange, to obtain the pushed tick market data, as raw data for the K-line data generator.
With a comprehensive understanding of the strategy code, we can learn the complete design, ideas and techniques of the strategy by analyzing the various components step by step.
-
List values defined, other function functions
1 List of types
StateThe Declarationenum State { // 枚举类型 定义一些 状态 STATE_NA, // 非正常状态 STATE_IDLE, // 空闲 STATE_HOLD_LONG, // 持多仓 STATE_HOLD_SHORT, // 持空仓 };Since some functions in the code return a state, these states are all defined in the enumeration type.
StateThe middle. See the code.STATE_NAThis is a disorder of the brain.STATE_IDLEThe state of idle, i.e. the state in which a hedge can be operated.STATE_HOLD_LONGThis is the case for holding a proper hedging position.STATE_HOLD_SHORTThis is the state of holding a counter hedged position.2, String replacement, which is not called in this policy, is a backup tool function that mainly handles strings.
string replace(string s, const string from, const string& to)3, function is a function that converts to 16 digits
toHexinline unsigned char toHex(unsigned char x)4, the function that handles url encoding
std::string urlencode(const std::string& str)The time conversion function converts the time of the string format to the time frame.
uint64_t _Time(string &s) -
K-line data generator class
class BarFeeder {                                                                       // K线 数据生成器类
    public:
        BarFeeder(int period) : _period(period) {                                       // 构造函数,参数为 period 周期, 初始化列表中初始化
            _rs.Valid = true;                                                           // 构造函数体中初始化 K线数据的 Valid属性。
        }

        void feed(double price, Chart *c=nullptr, int chartIdx=0) {                     // 输入数据,nullptr 空指针类型,chartIdx 索引默认参数为 0
            uint64_t epoch = uint64_t(Unix() / _period) * _period * 1000;               // 秒级时间戳祛除不完整时间周期(不完整的_period 秒数),转为 毫秒级时间戳。
            bool newBar = false;                                                        // 标记 新K线Bar 的标记变量
            if (_rs.size() == 0 || _rs[_rs.size()-1].Time < epoch) {                    // 如果 K线数据 长度为 0 。 或者 最后一bar 的时间戳小于 epoch(K线最后一bar 比当前最近的周期时间戳还要靠前)
                Record r;                                                               // 声明一个 K线bar 结构
                r.Time = epoch;                                                         // 构造当前周期的K线bar
                r.Open = r.High = r.Low = r.Close = price;                              // 初始化 属性
                _rs.push_back(r);                                                       // K线bar 压入 K线数据结构
                if (_rs.size() > 2000) {                                                // 如果K线数据结构长度超过 2000 , 就剔除最早的数据。
                    _rs.erase(_rs.begin());
                }
                newBar = true;                                                          // 标记
            } else {                                                                    // 其它情况,不是出现新bar 的情况下的处理。
                Record &r = _rs[_rs.size() - 1];                                        // 引用 数据中最后一bar 的数据。
                r.High = max(r.High, price);                                            // 对引用数据的最高价更新操作。
                r.Low = min(r.Low, price);                                              // 对引用数据的最低价更新操作。
                r.Close = price;                                                        // 对引用数据的收盘价更新操作。
            }

            auto bar = _rs[_rs.size()-1];                                               // 取最后一柱数据 ,赋值给 bar 变量
            json point = {bar.Time, bar.Open, bar.High, bar.Low, bar.Close};            // 构造一个 json 类型数据
            if (c != nullptr) {                                                         // 图表对象指针不等于 空指针,执行以下。
               if (newBar) {                                                            // 根据标记判断,如果出现新Bar
                    c->add(chartIdx, point);                                            // 调用图表对象成员函数add,向图表对象中插入数据(新增K线bar)
                    c->reset(1000);                                                     // 只保留1000 bar的数据
                } else {
                    c->add(chartIdx, point, -1);                                        // 否则就更新(不是新bar),这个点(更新这个bar)。
                }
            }
        }
        Records & get() {                                                               // 成员函数,获取K线数据的方法。
            return _rs;                                                                 // 返回对象的私有变量 _rs 。(即 生成的K线数据)
        }
    private:
        int _period;
        Records _rs;
};
This class is primarily responsible for processing the acquired tick data into a K-line of difference, which is used to drive strategic hedging logic. Some readers may have questions, why use tick data? Why construct a K-line data generator like this? Is it bad to use K-line data directly? These questions have come up repeatedly, even when I started writing some hedging strategies. The K-line data for the difference in price of the two contracts is a statistic of the price change in the difference in price over a certain period, so it is not possible to simply take the data of the two contracts K-line for a subtraction operation, calculate the difference in the data on each K-line Bar, as the difference. The most obvious error is, for example, the highest price, the lowest price, of two contracts, is not necessarily at the same time. So the subtracted value is not very significant. So we need to use real-time tick data, real-time differential calculations, real-time statistics on price changes over a period (i.e. high and low yields on the K-line column); so we need a K-line data generator, separately as a class, that is good for processing logical separation.
-
Hedge classes
class Hedge {                                                                           // 对冲类,策略主要逻辑。
  public:
    Hedge() {                                                                           // 构造函数
        ...
    };

    State getState(string &symbolA, Depth &depthA, string &symbolB, Depth &depthB) {        // 获取状态,参数: 合约A名称 、合约A深度数据, 合约B名称、 合约B深度数据

        ...
    }
    bool Loop(string &symbolA, Depth &depthA, string &symbolB, Depth &depthB, string extra="") {       // 开平仓 策略主要逻辑

        ...
    }

  private:
    vector<double> _addArr;                                     // 对冲加仓列表
    string _state_desc[4] = {"NA", "IDLE", "LONG", "SHORT"};    // 状态值 描述信息
    int _countOpen = 0;                                 // 开仓次数
    int _countCover = 0;                                // 平仓次数
    int _lastCache = 0;                                 //
    int _hedgeCount = 0;                                // 对冲次数
    int _loopCount = 0;                                 // 循环计数(循环累计次数)
    double _holdPrice = 0;                              // 持仓价格
    BarFeeder _feederA = BarFeeder(DPeriod);            // A合约 行情 K线生成器
    BarFeeder _feederB = BarFeeder(DPeriod);            // B合约 行情 K线生成器
    State _st = STATE_NA;                               // 对冲类型 对象的 对冲持仓状态
    string _cfgStr;                                     // 图表配置 字符串
    double _holdAmount = 0;                             // 持仓量
    bool _isCover = false;                              // 是否平仓 标记
    bool _needCheckOrder = true;                        // 设置是否 检查订单
    Chart _c = Chart("");                               // 图表对象,并初始化
};
Because of the length of the code, a section was omitted, mainly to show the structure of this hedge class, and the constructor function Hedge was omitted, mainly for object initialization. The remainder, mainly for 2 function functions.
-
getState
This function mainly deals with order detection, order cancellation, position detection, position balancing, etc. Since in the process of hedging, it is impossible to avoid a single-legged situation (i.e. a contract is done, a contract is not done), if the detection is performed in the suborder logic, then the processing of orders or settlements, the strategic logic will be more chaotic. So another way of thinking was adopted when designing this part.
-
Loop
The transaction logic of the strategy is encapsulated in this function, where the call
getStateThe K-line data generator object is used to generate K-line data for the spread, to hedge open, close, and raise logics judgments. There are also some data update operations for the graph.
-
-
The strategy master function
void main() {

    ...

    string realSymbolA = exchange.SetContractType(symbolA)["instrument"];    // 获取设置的A合约(this_week / next_week / quarter ) ,在 OKEX 合约 当周、次周、季度 对应的真实合约ID 。
    string realSymbolB = exchange.SetContractType(symbolB)["instrument"];    // ...

    string qs = urlencode(json({{"op", "subscribe"}, {"args", {"futures/depth5:" + realSymbolA, "futures/depth5:" + realSymbolB}}}).dump());    // 对 ws 接口的要传的参数进行 json 编码、 url 编码
    Log("try connect to websocket");                                                                                                            // 打印连接 WS接口的信息。
    auto ws = Dial("wss://real.okex.com:10442/ws/v3|compress=gzip_raw&mode=recv&reconnect=true&payload="+qs);     // 调用FMZ API Dial 函数 访问  OKEX 期货的 WS 接口
    Log("connect to websocket success");

    Depth depthA, depthB;                               // 声明两个 深度数据结构的变量 用于储存A合约和B合约 的深度数据
    auto fillDepth = [](json &data, Depth &d) {         // 用接口返回的json 数据,构造 Depth 数据的代码。
        d.Valid = true;
        d.Asks.clear();
        d.Asks.push_back({atof(string(data["asks"][0][0]).c_str()), atof(string(data["asks"][0][1]).c_str())});
        d.Bids.clear();
        d.Bids.push_back({atof(string(data["bids"][0][0]).c_str()), atof(string(data["bids"][0][1]).c_str())});
    };
    string timeA;   // 时间 字符串 A
    string timeB;   // 时间 字符串 B
    while (true) {
        auto buf = ws.read();                           // 读取 WS接口 推送来的数据

        ...

}
The main task of the main function is to construct a main loop, which continuously receives ticks from the exchange's websocket interface, and then calls the member function of the hedge type object: the Loop function. The transaction logic in the Loop function is driven by the transaction data. It is important to note that the tick market described above is actually a subscription order thin depth data interface, which obtains order thin data for each file. However, the strategy only uses the first file data, which is almost the same as the tick market data. The strategy does not use the data of other files, nor does it use the number of orders in the first file. For more details, see the policy on how to subscribe to the websocket interface data and how to set it up.
string qs = urlencode(json({{"op", "subscribe"}, {"args", {"futures/depth5:" + realSymbolA, "futures/depth5:" + realSymbolB}}}).dump());
Log("try connect to websocket");
auto ws = Dial("wss://real.okex.com:10442/ws/v3|compress=gzip_raw&mode=recv&reconnect=true&payload="+qs);
Log("connect to websocket success");
The first thing to do is to encode the url of the json parameter for the subscription message sent to the subscription interface, which is:
payloadThe value of the parameter. Then the more important step is to call the API interface function of the inventor's quantized trading platform.DialThe function ≠ ∞DialThe function can be used to access the websocket interface of the exchange. Here we make some settings so that the websocket that is about to be created will have a disconnect automatic re-connection of the connection control object ws (the subscription message still uses the payload parameter value qs string).DialAdding configuration options to the function's parameter string.DialThe first part of the function parameter is as follows:wss://real.okex.com:10442/ws/v3This is the websocket interface address that needs to be accessed, and then used.
|I'm not going to do it.compress=gzip_raw&mode=recv&reconnect=true&payload="+qsAll of these are configuration parameters.Parameter name Describe compress compress is the compression mode, the OKEX websocket interface uses gzip_raw This mode is set to gzip_raw mode mode is the mode, optional dual, send, recv. There are three modes. reconnect reconnect indicates whether the reconnection is set, reconnect=true indicates whether the reconnection is enabled, and does not set the default non-reconnection. payload Payload is a subscription message that needs to be sent when the ws is reconnected. This is set up so that even if the websocket is disconnected, the inventor quantifies the trading platform. The host's underlying system automatically reconnects, obtaining the latest market data in a timely manner. It's easy to get caught up in every price fluctuation and quickly capture the right hedge market.
-
Position control
Position control is controlled by using a hedged position ratio similar to a "Boffinach" number line.
for (int i = 0; i < AddMax + 1; i++) {                                          // 构造 控制加仓数量的数据结构,类似 波菲纳契数列 对冲数量 比例。
    if (_addArr.size() < 2) {                                                   // 前两次加仓量变化为: 加一倍对冲数量 递增
        _addArr.push_back((i+1)*OpenAmount);
    }
    _addArr.push_back(_addArr[_addArr.size()-1] + _addArr[_addArr.size()-2]);   // 最后 两个加仓数量相加,算出当前的加仓数量储存到 _addArr数据结构中。
}
It can be seen that each time the number of raised positions is increased, it is the sum of the last two positions. Such position control can be achieved by increasing the relative number of leverage hedges and spreading the positions, thus capturing small positions with small fluctuations and large positions with large fluctuations.
-
Holding: Stop loss and stop profit
The price of a fixed stop loss, stop loss. Holding the spread until the leverage position is reached, the stop loss position is stopped, the stop loss position is done.
-
In and out of the market, cycle design
Parameters NPeriod The period controlled by NPeriod exercises some dynamic control over the strategy's open positions.
-
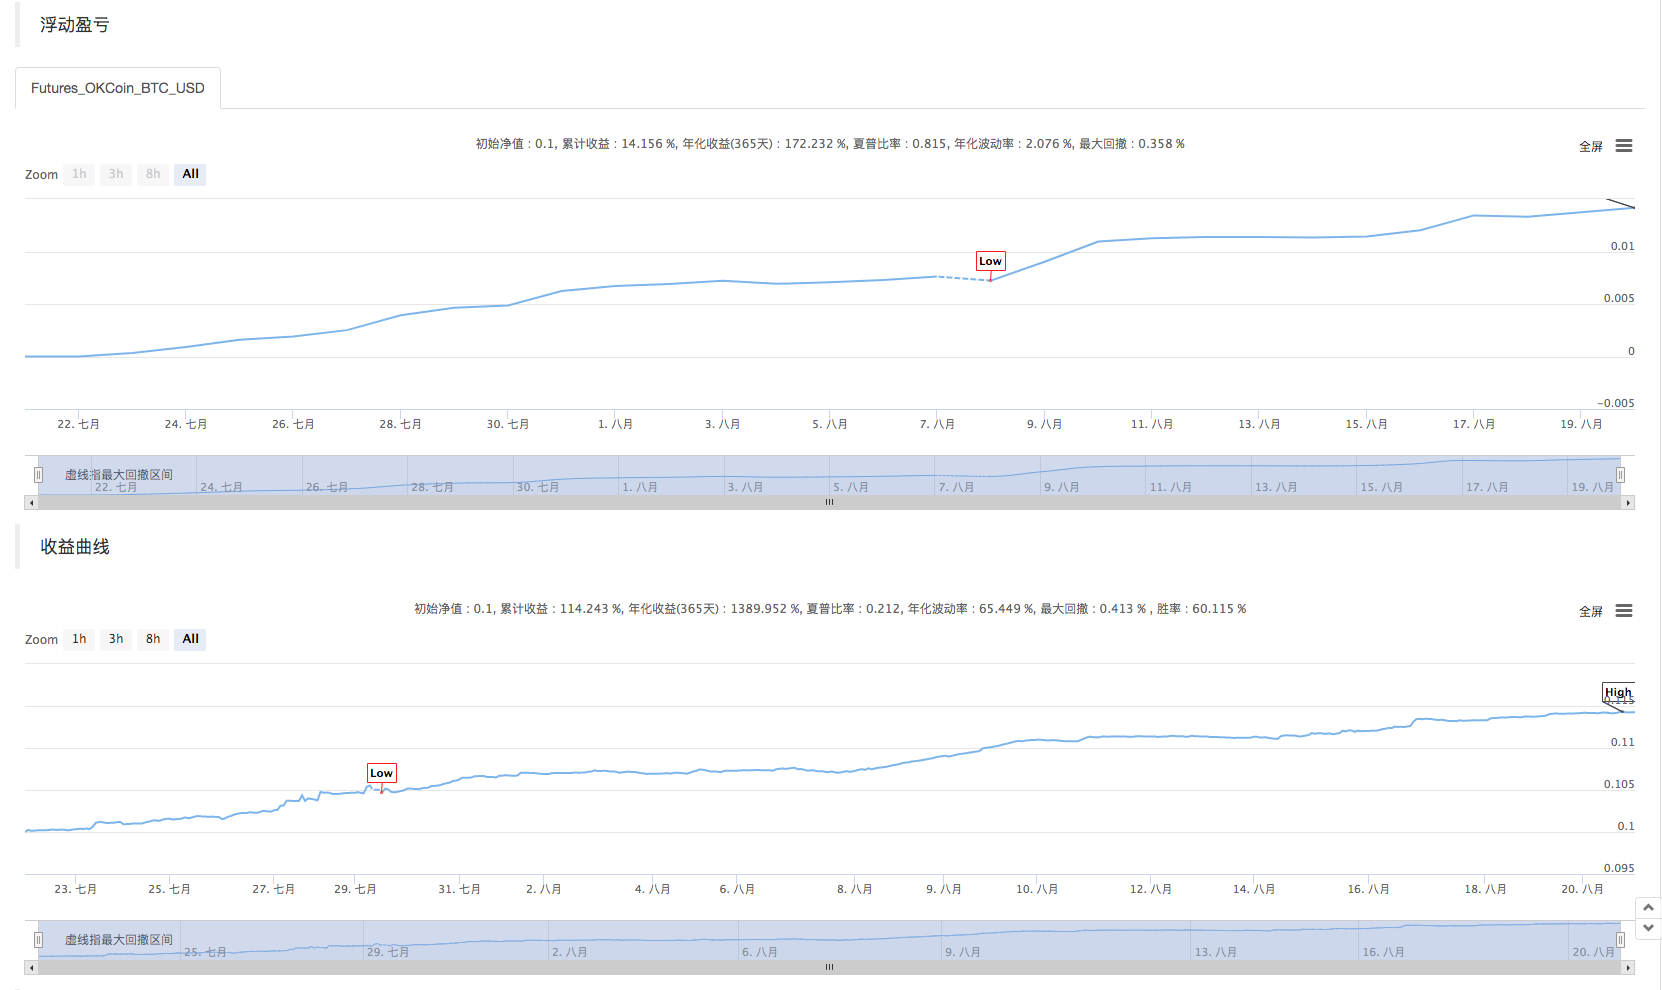
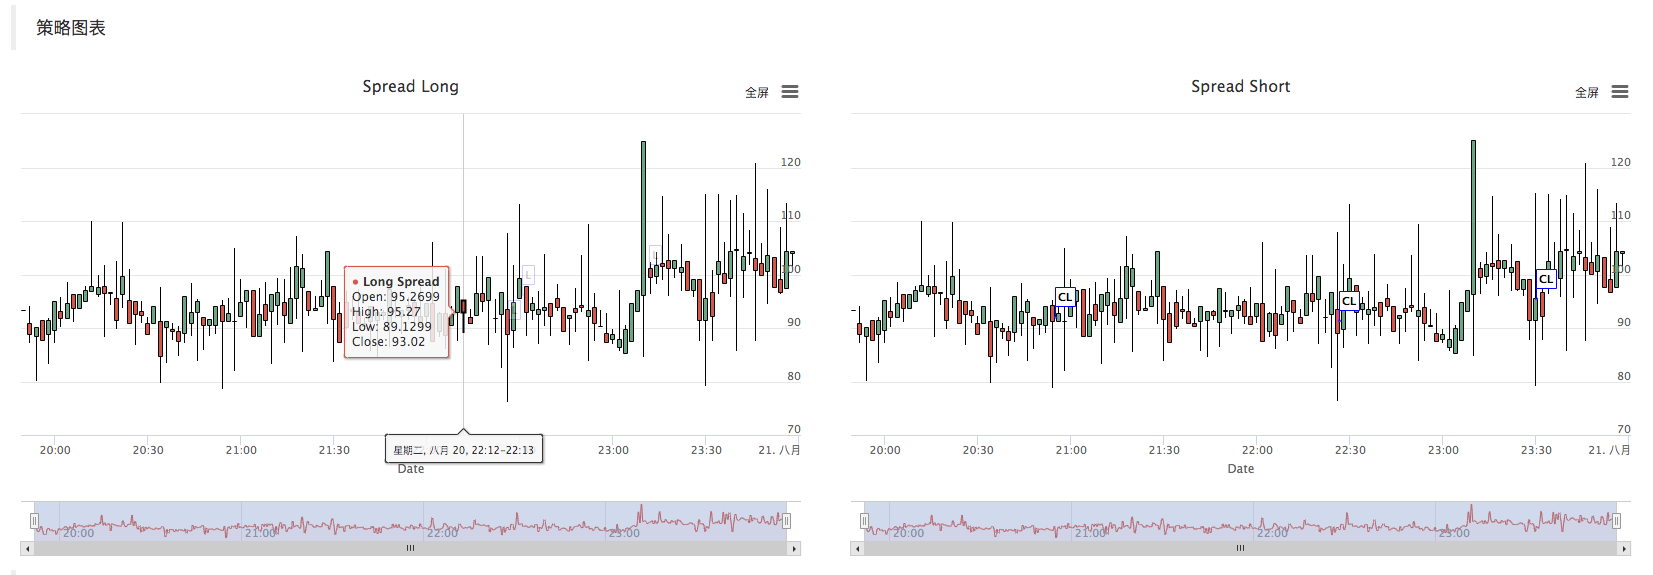
Strategy chart
The strategy automatically generates a K-line chart of the spread, marking the relevant transaction information.
The C++ policy for custom graph drawing is also very simple, as can be seen in the constructor function of the hedge class, where we use the well-written graph configuration string_cfgStr configuration for the graph object_c, _c is the private member of the hedge class called the inventor to quantify the custom graph API interface function when initialized.
ChartGraph objects constructed by functions._cfgStr = R"EOF( [{ "extension": { "layout": "single", "col": 6, "height": "500px"}, "rangeSelector": {"enabled": false}, "tooltip": {"xDateFormat": "%Y-%m-%d %H:%M:%S, %A"}, "plotOptions": {"candlestick": {"color": "#d75442", "upColor": "#6ba583"}}, "chart":{"type":"line"}, "title":{"text":"Spread Long"}, "xAxis":{"title":{"text":"Date"}}, "series":[ {"type":"candlestick", "name":"Long Spread","data":[], "id":"dataseriesA"}, {"type":"flags","data":[], "onSeries": "dataseriesA"} ] }, { "extension": { "layout": "single", "col": 6, "height": "500px"}, "rangeSelector": {"enabled": false}, "tooltip": {"xDateFormat": "%Y-%m-%d %H:%M:%S, %A"}, "plotOptions": {"candlestick": {"color": "#d75442", "upColor": "#6ba583"}}, "chart":{"type":"line"}, "title":{"text":"Spread Short"}, "xAxis":{"title":{"text":"Date"}}, "series":[ {"type":"candlestick", "name":"Long Spread","data":[], "id":"dataseriesA"}, {"type":"flags","data":[], "onSeries": "dataseriesA"} ] } ] )EOF"; _c.update(_cfgStr); // 用图表配置 更新图表对象 _c.reset(); // 重置图表数据。- Calling
_c.update(_cfgStr);Configure the chart object using _cfgStr. - Calling
_c.reset();Reinstall the chart data.
When the policy code needs to insert data into a graph, it can also update the graph data by directly calling the _c object's member function, or by passing the _c reference as an argument, and then calling the _c object's member function ((method)). For example:
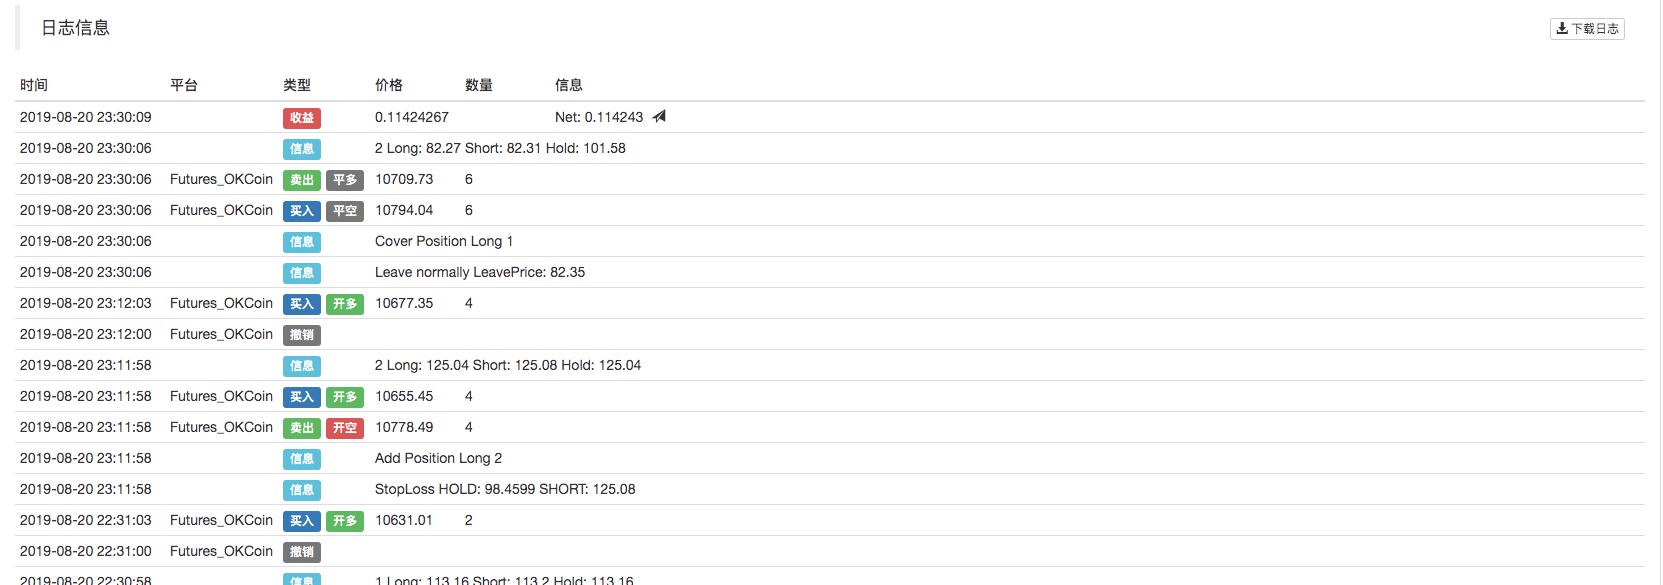
_c.add(chartIdx, {{"x", UnixNano()/1000000}, {"title", action}, {"text", format("diff: %f", opPrice)}, {"color", color}});After the transaction is completed, a label record is printed on the K-line chart.
Here, drawing K strings is done by calling a member function of the BarFeeder class
feedWhen the graph object _c is referenced as a parameter, it is passed.void feed(double price, Chart *c=nullptr, int chartIdx=0)That is,
feedThe shape parameter of the function c ⋅json point = {bar.Time, bar.Open, bar.High, bar.Low, bar.Close}; // 构造一个 json 类型数据 if (c != nullptr) { // 图表对象指针不等于 空指针,执行以下。 if (newBar) { // 根据标记判断,如果出现新Bar c->add(chartIdx, point); // 调用图表对象成员函数add,向图表对象中插入数据(新增K线bar) c->reset(1000); // 只保留1000 bar个数据 } else { c->add(chartIdx, point, -1); // 否则就更新(不是新bar),这个点(更新这个bar)。 } }By calling the graph object _c
addA member function that inserts new K-lineBar data into a graph. The code is:c->add(chartIdx, point); - Calling
-
Reassessment
This policy is for learning purposes only. When using the real disk, please make your own modifications and optimizations according to the real disk situation.
The policy address:https://www.fmz.com/strategy/163447
More interesting tips can be found at Inventors Quantify Trading Platform:https://www.fmz.com
- Quantifying Fundamental Analysis in the Cryptocurrency Market: Let Data Speak for Itself!
- Quantified research on the basics of coin circles - stop believing in all kinds of crazy professors, data is objective!
- The inventor of the Quantitative Data Exploration Module, an essential tool in the field of quantitative trading.
- Mastering Everything - Introduction to FMZ New Version of Trading Terminal (with TRB Arbitrage Source Code)
- Get all the details about the new FMZ trading terminal (with the TRB suite source code)
- FMZ Quant: An Analysis of Common Requirements Design Examples in the Cryptocurrency Market (II)
- How to Exploit Brainless Selling Bots with a High-Frequency Strategy in 80 Lines of Code
- FMZ quantification: common demands on the cryptocurrency market design example analysis (II)
- How to exploit brainless robots for sale with high-frequency strategies of 80 lines of code
- FMZ Quant: An Analysis of Common Requirements Design Examples in the Cryptocurrency Market (I)
- FMZ quantification: common demands of the cryptocurrency market design instance analysis (1)