Analysis of the strategy of the Dongguan corridor in the context of research
Author: Goodness, Created: 2019-10-11 16:11:17, Updated: 2023-10-18 19:57:41
Strategy briefing
Of the many trading strategies, the Dongguan channel strategy is probably one of the most classic breakthrough strategies, having been popularised as early as 1970, when foreign-owned firms conducted simulation tests and research on mainstream programmatic trading strategies. The results showed that the Dongguan channel strategy was the most successful of all strategy tests.
Later, in the United States, another training of the most famous mermaid traders in the history of trading took place, which was a huge success. The mermaid's trading methods were secret at the time, but it was more than a decade later that the mermaid trading laws were made public, and it was discovered that the mermaids were using an improved version of the Don Quixote channel strategy.
The most common type of breakout trading strategy is to use the relationship between price and the relative position of support and resistance to determine the point of purchase and sale of a particular trade. The Dongjian channel strategy in this section is based on this principle.
Don Quijote's rules of conduct
The Dongqian channel is a trend indicator, with a slightly similar appearance and signal to the Braintree indicator. However, the Dongqian price channel is built on the basis of the highest and lowest prices in a periodic interval. For example, when calculating the maximum value of the highest price of the most recent 50 K lines, a trajectory is formed; when calculating the minimum value of the lowest price of the most recent 50 K lines, a trajectory is formed.
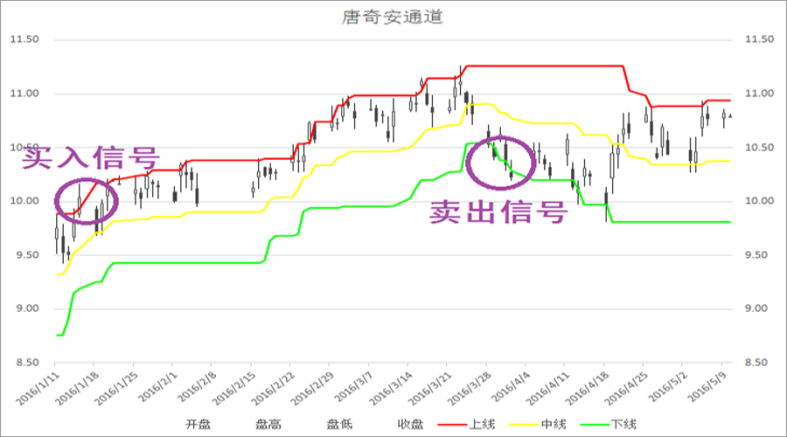
As shown above: The indicator consists of a curve of 3 different colors, the default is the highest and lowest price in 20 cycles to show the volatility of the market price, when the channel is narrow indicates the market volatility is smaller, and the reverse channel width indicates the market volatility is larger.
If the price breaks above the trajectory, it is a buy signal; conversely, if the price breaks below the trajectory, it is a sell signal. Since its up and down trajectory is calculated by the highest and lowest prices, in general, prices rarely rise and fall simultaneously on the up and down channel lines. In most cases, prices move along the up or down trajectory unilaterally, or between the up and down trajectories.
Strategic logic
There are many ways to use the Dongguan channel, which can be used alone or in combination with other indicators. In this section, we will use the simplest method of use. That is, when the price breaks through the uptrend from the bottom, i.e. breaks through the upper pressure line, we think that the multilateral forces are strengthening, a wave of uptrend has formed, which generates a buy and sell signal; when the price breaks through the downtrend from the top, i.e. breaks the support line, we think that the uptrend is strengthening, a wave of downtrend has formed, which generates an open position signal.
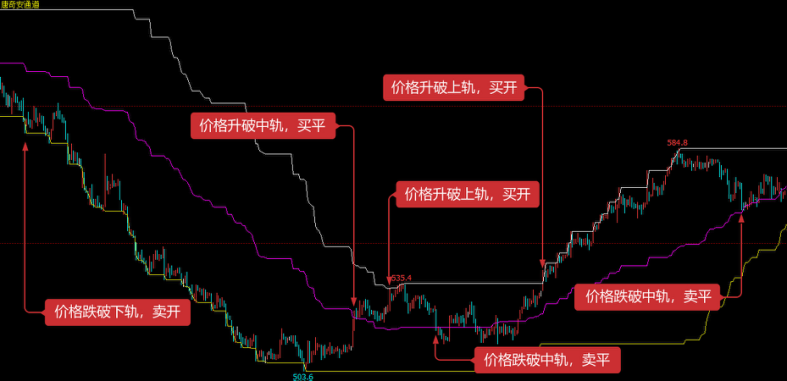
If the price falls back to the middle of the Dongguan channel after the buy-in, we think that the multilateral forces are weakening, or the air force is strengthening, and a sell-off signal is generated; if the price falls back to the middle of the Dongguan channel after the sell-off position, we think that the air force is weakening, or the multilateral forces are strengthening, and the buy-out signal is generated.
Conditions of sale
- Multiple openings: if there is no holding and the closing price is higher than the upside
- Opening a position empty: if there is no holding and the closing price is below the trajectory
- Multiple placement: if you hold multiple orders and the closing price is lower than the mid-range
- Blank placement: if the order is empty and the closing price is higher than the mid-range
Implementation of the strategy code
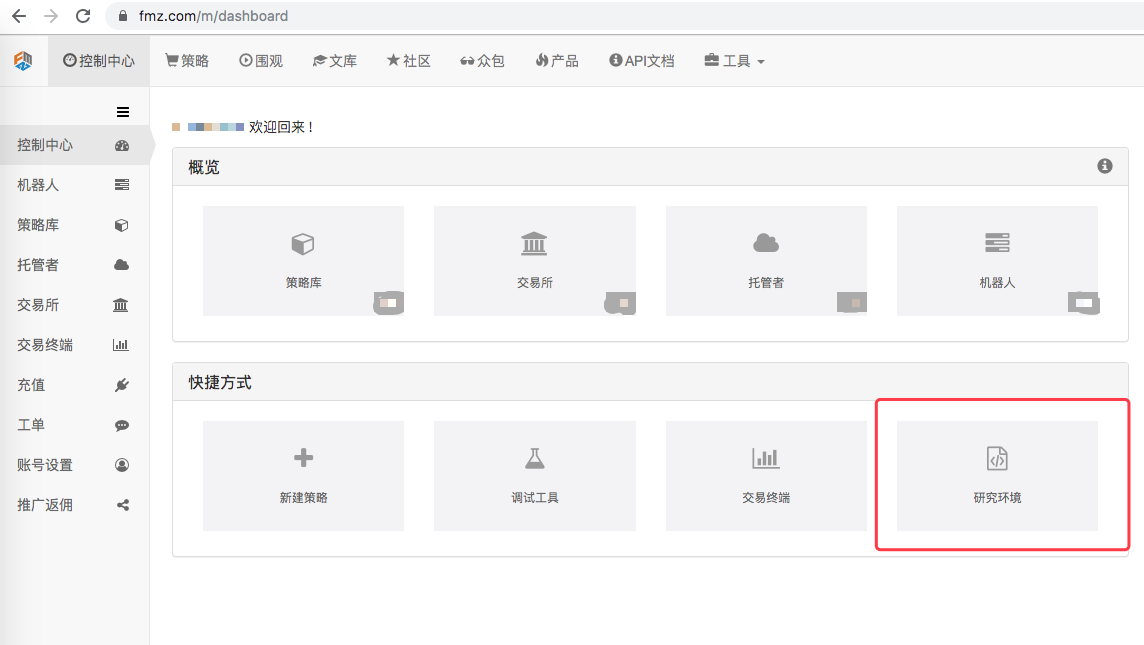
Next, in our research environment of inventors quantifying platforms, we understand this strategy step by step.
For a look into the research environment of the inventor quantification platform, see the following diagram:
from fmz import *
task = VCtx('''backtest
start: 2019-08-01 09:00:00
end: 2019-10-10 15:00:00
period: 5m
exchanges: [{"eid":"Futures_CTP","currency":"FUTURES"}]
''')
# 创建回测环境
# 以上红色部分内容的关于回测信息的范例格式,可以在发明者量化平台的策略编写页面中点击“保存回测设置”获取
# 首先,我们需要获取持仓信息,我们定义一个mp()函数用来干这件事
def mp():
positions = exchange.GetPosition() # 获取持仓数组
if len(positions) == 0: # 如果持仓数组的长度是0
return 0 # 证明是空仓,返回0
for i in range(len(positions)): # 遍历持仓数组
if (positions[i]['Type'] == PD_LONG) or (positions[i]['Type'] == PD_LONG_YD):
return 1 # 如果有多单,返回1
elif (positions[i]['Type'] == PD_SHORT) or (positions[i]['Type'] == PD_SHORT_YD):
return -1 # 如果有空单,返回-1
print(positions)
mp() # 接下来,我们执行一下这个获取持仓信息函数,可以看到,结果为0,也就是目前为空仓状态0
# 我们以当前螺纹钢主力合约为例子,开始测试这个策略

exchange.SetContractType("rb888") # 设置品种代码,主力合约为合约代码后加数字888
{'CombinationType': 0,
'CreateDate': 0,
'DeliveryMonth': 9,
'DeliveryYear': 0,
'EndDelivDate': 0,
'ExchangeID': 'SHFE',
'ExchangeInstID': 'rb888',
'ExpireDate': 0,
'InstLifePhase': 49,
'InstrumentID': 'rb888',
'InstrumentName': 'rb连续',
'IsTrading': 1,
'LongMarginRatio': 0.06,
'MaxLimitOrderVolume': 500,
'MaxMarginSideAlgorithm': 49,
'MaxMarketOrderVolume': 30,
'MinLimitOrderVolume': 1,
'MinMarketOrderVolume': 1,
'OpenDate': 0,
'OptionsType': 48,
'PositionDateType': 49,
'PositionType': 50,
'PriceTick': 1,
'ProductClass': 49,
'ProductID': 'rb',
'ShortMarginRatio': 0.06,
'StartDelivDate': 0,
'StrikePrice': 0,
'UnderlyingInstrID': 'rb',
'UnderlyingMultiple': 1,
'VolumeMultiple': 10}接下来我们获取k线数组,因为根据策略逻辑,我们需要行情运行了一段时间,再进行逻辑判断,这样有便于我们的策略逻辑更好的适应行情,这里我们就暂且把50根K线作为起始要求吧。发明者量化的K线信息是以数组的形式储存的,数组里包含最高价,最低价,开盘价,收盘价和成交量等等信息,关于这部分的内容请查看发明者量化的官方API文档:https://www.fmz.com/api
# 接下来我们定义一个变量,让它来存储K线数组

records = exchange.GetRecords() # 获取K线数组
# 按照策略逻辑描述,我们用收盘价来作为开仓的价格,所以我们需要计算最新K线的收盘价

close = records[len(records) - 1].Close # 获取最新K线收盘价
close
3846.0
然后,我们需要以收盘价为标准计算50根k线中最高价的最大值和最低价的最小值
upper = TA.Highest(records, 50, 'High') # 获取50周期最高价的最大值
upper
3903.0
lower = TA.Lowest(records, 50, 'Low') # 获取50周期最低价的最小值
lower
3856.0
接着,我们需要计算这条通道的上轨和下轨的均值
middle = (upper + lower) / 2 # 计算上轨和下轨的均值
middle
3879.5
以上,关于此策略需要计算的部分我们已经全部完成,接下来,我们就要开始逻辑判断开仓条件,以及根据逻辑判断的结果进行实际的开仓操作。这里需要注意的是,我们需要用到发明者量化平台的国内商品期货模版,由于当下是研究环境,无法支持这个模版,我们暂且写出来,但是运行会报错,在发明者量化平台的策略编写页面进行实际编码时,导入此模版没有任何问题,模版地址为:https://www.fmz.com/strategy/24288 各位在发明者量化策略编写页面进行编码时,需要把此模版先复制到自己的策略库,然后在回测时勾选上,这里请各位读者注意
obj = ext.NewPositionManager() # 使用发明者量化交易类库,这里运行时会报错,不用理会,当下是研究环境,
                               # 实际编码过程中不会出现此问题,以下同此,不再注释。
接下来是策略的判断逻辑,并且根据逻辑进行开仓与平仓操作
if positions > 0 and close < middle: # 如果持多单,并且收盘价跌破中轨
            obj.CoverAll() # 平掉所有仓位
        if positions < 0 and close > middle: # 如果持空单,并且收盘价升破中轨
            obj.CoverAll() # 平掉所有仓位
        if positions == 0: # 如果是空仓
            if close > upper: # 如果收盘价升破上轨
                obj.OpenLong("rb888", 1) # 买开
            elif close < lower: # 如果收盘价跌破下轨
                obj.OpenShort("rb888", 1) # 卖开
# 完整的策略代码:
def mp():
positions = exchange.GetPosition() # 获取持仓数组
if len(positions) == 0: # 如果持仓数组的长度是0
return 0 # 证明是空仓,返回0
for i in range(len(positions)): # 遍历持仓数组
if (positions[i]['Type'] == PD_LONG) or (positions[i]['Type'] == PD_LONG_YD):
return 1 # 如果有多单,返回1
elif (positions[i]['Type'] == PD_SHORT) or (positions[i]['Type'] == PD_SHORT_YD):
return -1 # 如果有空单,返回-1
def main(): # 主函数
exchange.SetContractType("rb888") # 设置品种代码,主力合约为合约代码后加数字888
while True: # 进入循环
records = exchange.GetRecords() # 获取K线数组
if len(records) < 50: continue # 如果K线少于50根,就跳过本次循环
close = records[len(records) - 1].Close # 获取最新K线收盘价
positions = mp() # 获取持仓信息函数
upper = TA.Highest(records, 50, 'High') # 获取50周期最高价的最大值
lower = TA.Lowest(records, 50, 'Low') # 获取50周期最低价的最小值
middle = (upper + lower) / 2 # 计算上轨和下轨的均值
obj = ext.NewPositionManager() # 使用交易类库
if positions > 0 and close < middle: # 如果持多单,并且收盘价跌破中轨
obj.CoverAll() # 平掉所有仓位
if positions < 0 and close > middle: # 如果持空单,并且收盘价升破中轨
obj.CoverAll() # 平掉所有仓位
if positions == 0: # 如果是空仓
if close > upper: # 如果收盘价升破上轨
obj.OpenLong("rb888", 1) # 买开
elif close < lower: # 如果收盘价跌破下轨
obj.OpenShort("rb888", 1) # 卖开- Quantifying Fundamental Analysis in the Cryptocurrency Market: Let Data Speak for Itself!
- Quantified research on the basics of coin circles - stop believing in all kinds of crazy professors, data is objective!
- The inventor of the Quantitative Data Exploration Module, an essential tool in the field of quantitative trading.
- Mastering Everything - Introduction to FMZ New Version of Trading Terminal (with TRB Arbitrage Source Code)
- Get all the details about the new FMZ trading terminal (with the TRB suite source code)
- FMZ Quant: An Analysis of Common Requirements Design Examples in the Cryptocurrency Market (II)
- How to Exploit Brainless Selling Bots with a High-Frequency Strategy in 80 Lines of Code
- FMZ quantification: common demands on the cryptocurrency market design example analysis (II)
- How to exploit brainless robots for sale with high-frequency strategies of 80 lines of code
- FMZ Quant: An Analysis of Common Requirements Design Examples in the Cryptocurrency Market (I)
- FMZ quantification: common demands of the cryptocurrency market design instance analysis (1)