Hands-on teaches you how to implement a data collector
Author: The Little Dream, Created: 2020-04-16 12:44:03, Updated: 2023-10-11 19:57:00
Support for research strategies, design strategies and retrospective analysis in programmatic trading, quantitative trading. All the data on the market is collected and not realistic, after all, the data is too large. For the digital currency market, the inventors support a limited number of exchanges, retrospective data of trading pairs on the quantitative trading platform.
This can address several needs, such as:
- Data sources can be provided to multiple robots, which can mitigate the frequency at which each robot accesses an exchange interface.
- You can get a sufficient number of K-bars when the robot starts, and you no longer have to worry about having too few K-bars when the robot starts.
- Data from the small currency market can be collected and used to provide custom data sources to inventors of quantitative trading platforms to use the retesting strategy.
- Wait a second.
I'm planning to implement it in Python, why? Because it's convenient:) If there is a need, get involved!
Get ready
-
Python's Python library
Because you want to use the database to do persistent saving.
MongoDBThis database requires a driver for the collection program written in Python. Installed in PythonpymongoIt's not that simple. -
Install MongoDB on the hosted device
For example: Mac installs MongoDB, of course the Win system installs MongoDB, there are many tutorials online to install on Apple's MAC system:
-
Downloaded The link to download:https://www.mongodb.com/download-center?jmp=nav#community
-
Uncompressed After downloading, uncompress to the directory:
/usr/local。 -
Configure the environment variables The terminal input:
open -e .bash_profileIn the meantime, I'm going to open the file and write:export PATH=${PATH}:/usr/local/MongoDB/binAfter saving, terminal usesource .bash_profileThe changes are effective. -
Manually configure database file directories and log directories Create a directory
/usr/local/data/dbThe corresponding folder in the middle. Create a directory/usr/local/data/logsIn the corresponding folders. -
Editing the profile
mongo.conf:#bind_ip_all = true # 任何机器可以连接 bind_ip = 127.0.0.1 # 本机可以访问 port = 27017 # 实例运行在27017端口(默认) dbpath = /usr/local/data/db # 数据文件夹存放地址(db要预先创建) logpath = /usr/local/data/logs/mongodb.log # 日志文件地址 logappend = false # 启动时 添加还是重写日志文件 fork = false # 是否后台运行 auth = false # 开启校验用户 -
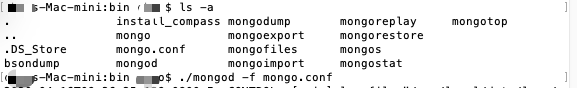
Running the MongoDB service
The order:
./mongod -f mongo.conf -
Stop the service
use admin;
db.shutdownServer();
Implementing the collector process
The compiler operates as a Python robot strategy on the inventor's quantified trading platform. Due to the limited level of Python itself, only a simple example is implemented to demonstrate the idea of this article.
The collector policy code:
import pymongo
import json
def main():
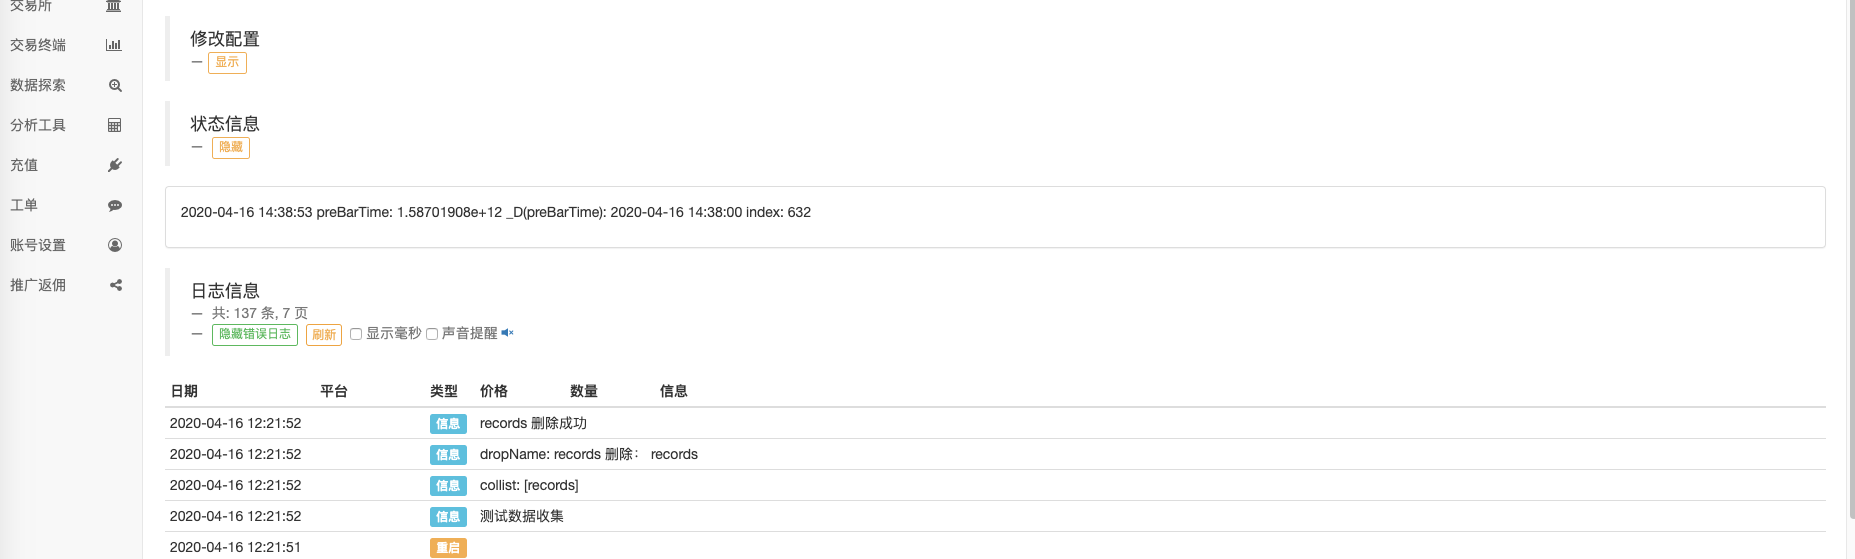
Log("测试数据收集")
# 连接数据库服务
myDBClient = pymongo.MongoClient("mongodb://localhost:27017") # mongodb://127.0.0.1:27017
# 创建数据库
huobi_DB = myDBClient["huobi"]
# 打印目前数据库表
collist = huobi_DB.list_collection_names()
Log("collist:", collist)
# 检测是否删除表
arrDropNames = json.loads(dropNames)
if isinstance(arrDropNames, list):
for i in range(len(arrDropNames)):
dropName = arrDropNames[i]
if isinstance(dropName, str):
if not dropName in collist:
continue
tab = huobi_DB[dropName]
Log("dropName:", dropName, "删除:", dropName)
ret = tab.drop()
collist = huobi_DB.list_collection_names()
if dropName in collist:
Log(dropName, "删除失败")
else :
Log(dropName, "删除成功")
# 创建records表
huobi_DB_Records = huobi_DB["records"]
# 请求数据
preBarTime = 0
index = 1
while True:
r = _C(exchange.GetRecords)
if len(r) < 2:
Sleep(1000)
continue
if preBarTime == 0:
# 首次写入所有BAR数据
for i in range(len(r) - 1):
# 逐根写入
bar = r[i]
huobi_DB_Records.insert_one({"index": index, "High": bar["High"], "Low": bar["Low"], "Open": bar["Open"], "Close": bar["Close"], "Time": bar["Time"], "Volume": bar["Volume"]})
index += 1
preBarTime = r[-1]["Time"]
elif preBarTime != r[-1]["Time"]:
bar = r[-2]
huobi_DB_Records.insert_one({"index": index, "High": bar["High"], "Low": bar["Low"], "Open": bar["Open"], "Close": bar["Close"], "Time": bar["Time"], "Volume": bar["Volume"]})
index += 1
preBarTime = r[-1]["Time"]
LogStatus(_D(), "preBarTime:", preBarTime, "_D(preBarTime):", _D(preBarTime/1000), "index:", index)
Sleep(10000)
The full policy address is:Links
Use of data
In the meantime, we're working on a strategy to create a robot that uses data.
Please note: Select"Drawing class library"If you don't have one, you can copy one to your policy library.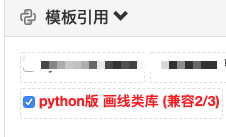
import pymongo
import json
def main():
Log("测试使用数据库数据")
# 连接数据库服务
myDBClient = pymongo.MongoClient("mongodb://localhost:27017") # mongodb://127.0.0.1:27017
# 创建数据库
huobi_DB = myDBClient["huobi"]
# 打印目前数据库表
collist = huobi_DB.list_collection_names()
Log("collist:", collist)
# 查询数据打印
huobi_DB_Records = huobi_DB["records"]
while True:
arrRecords = []
for x in huobi_DB_Records.find():
bar = {
"High": x["High"],
"Low": x["Low"],
"Close": x["Close"],
"Open": x["Open"],
"Time": x["Time"],
"Volume": x["Volume"]
}
arrRecords.append(bar)
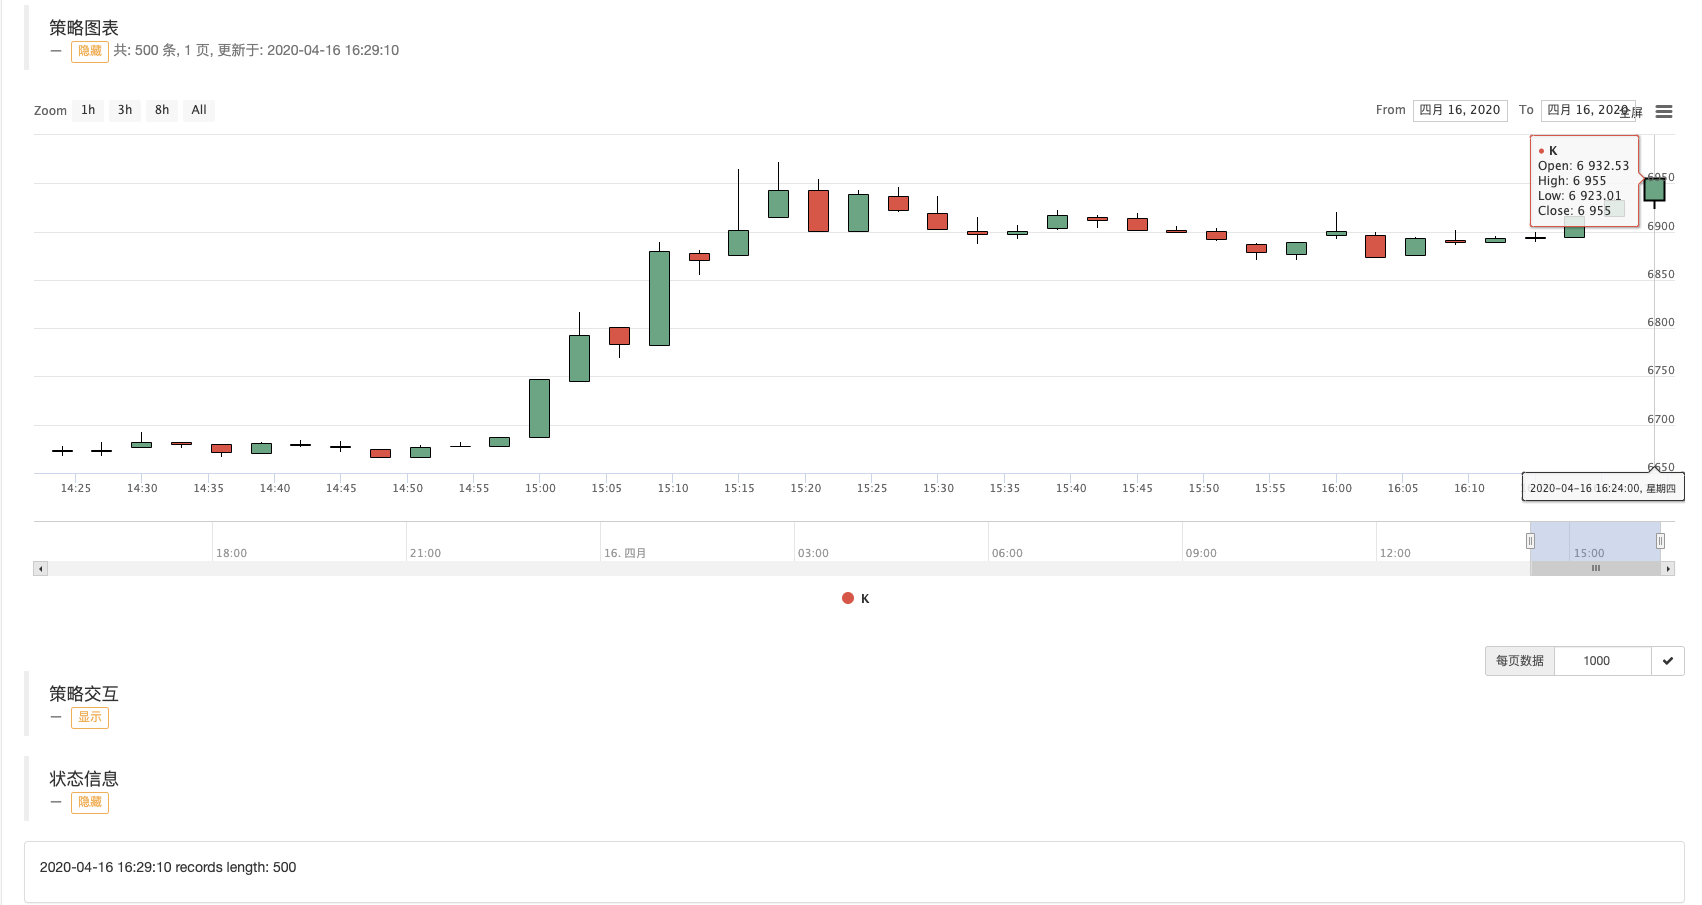
# 使用画线类库,把取到的K线数据画出来
ext.PlotRecords(arrRecords, "K")
LogStatus(_D(), "records length:", len(arrRecords))
Sleep(10000)
It can be seen that the strategy of using data in the bot code is not to access any exchange interface, to obtain data by accessing the database, the market collector program does not record the data of the current BAR, it collects the data of the already completed state of the K-line BAR, which can be slightly modified if the current BAR real-time data is needed. The current example code, just to demonstrate that all data records in a table in a database are retrieved when accessed, so that as the time of data collection increases and more data is collected, all queries that come out will affect performance to some extent.
Running
Running the Administrator
It's running on the host device.MongoDBDatabase services are provided./mongod -f mongo.conf
Collector running, simulator of inventors collecting quantitative trading platformswexAppWhat?BTC_USDTThe transaction pairs:
The address:wexApp
A robot using the database data: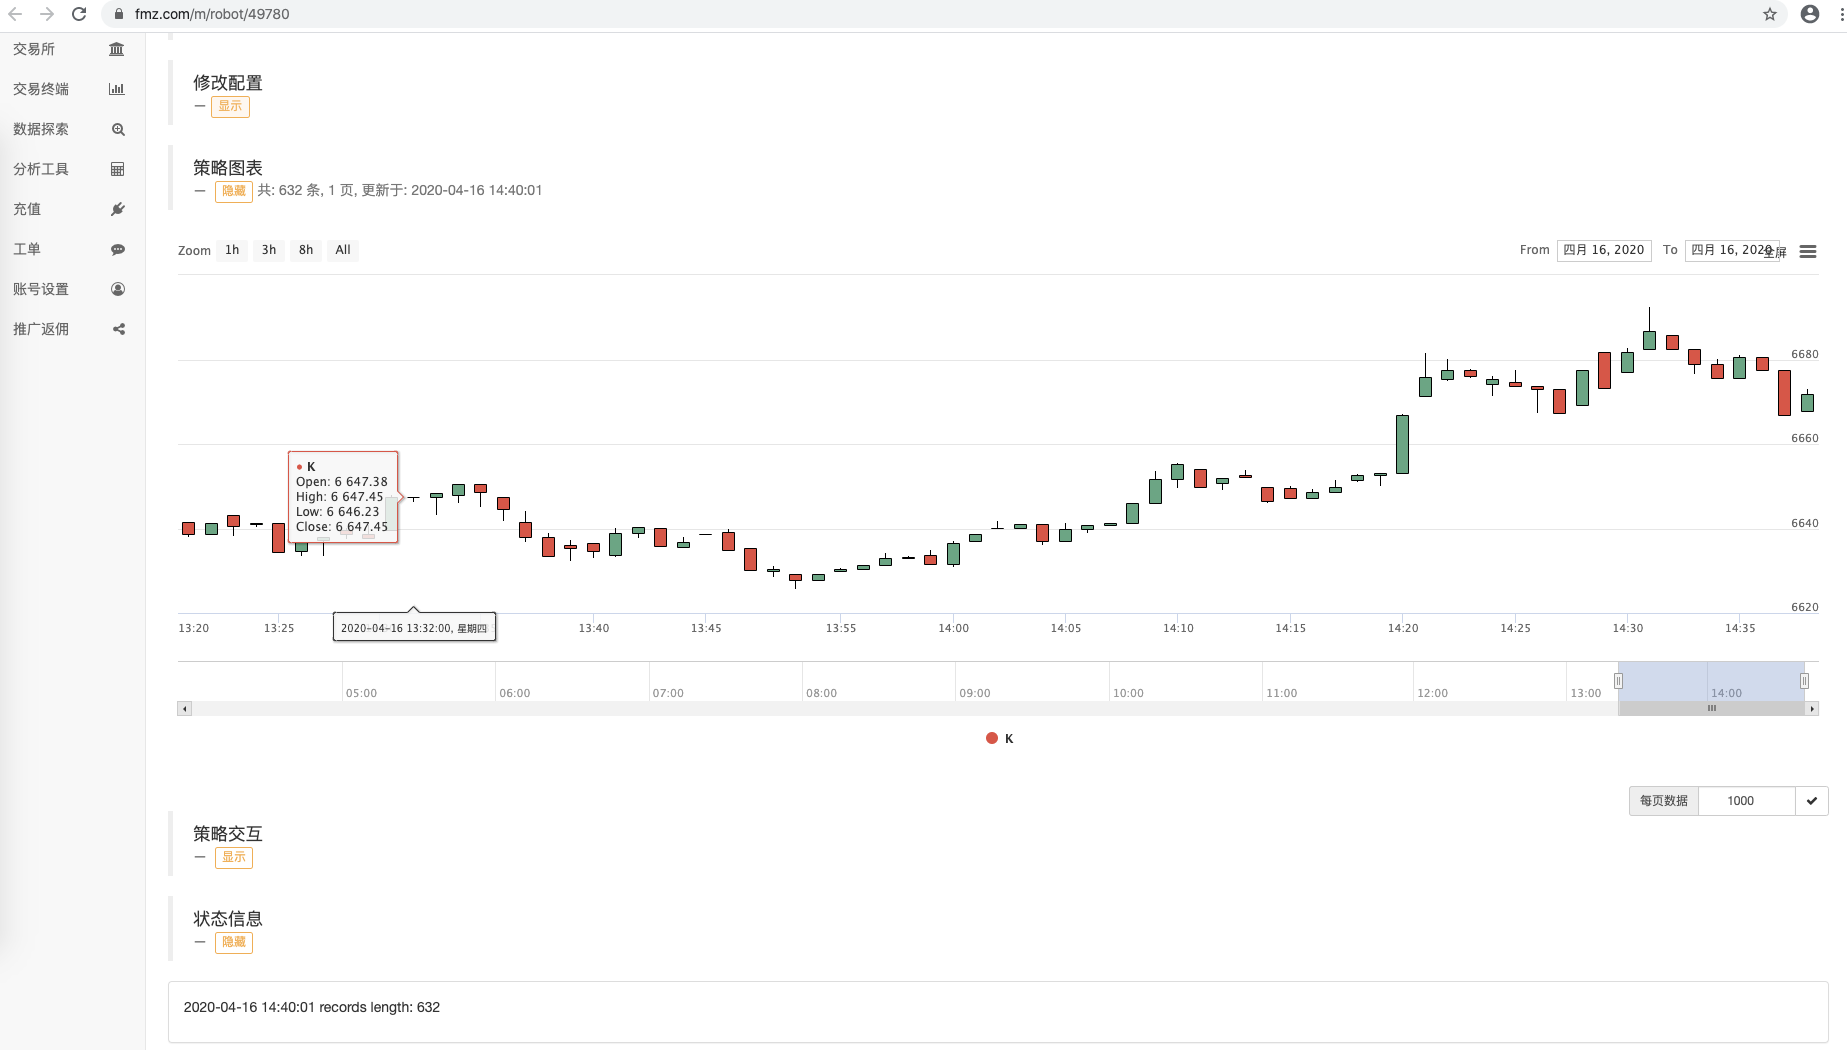
Robot B using the database data: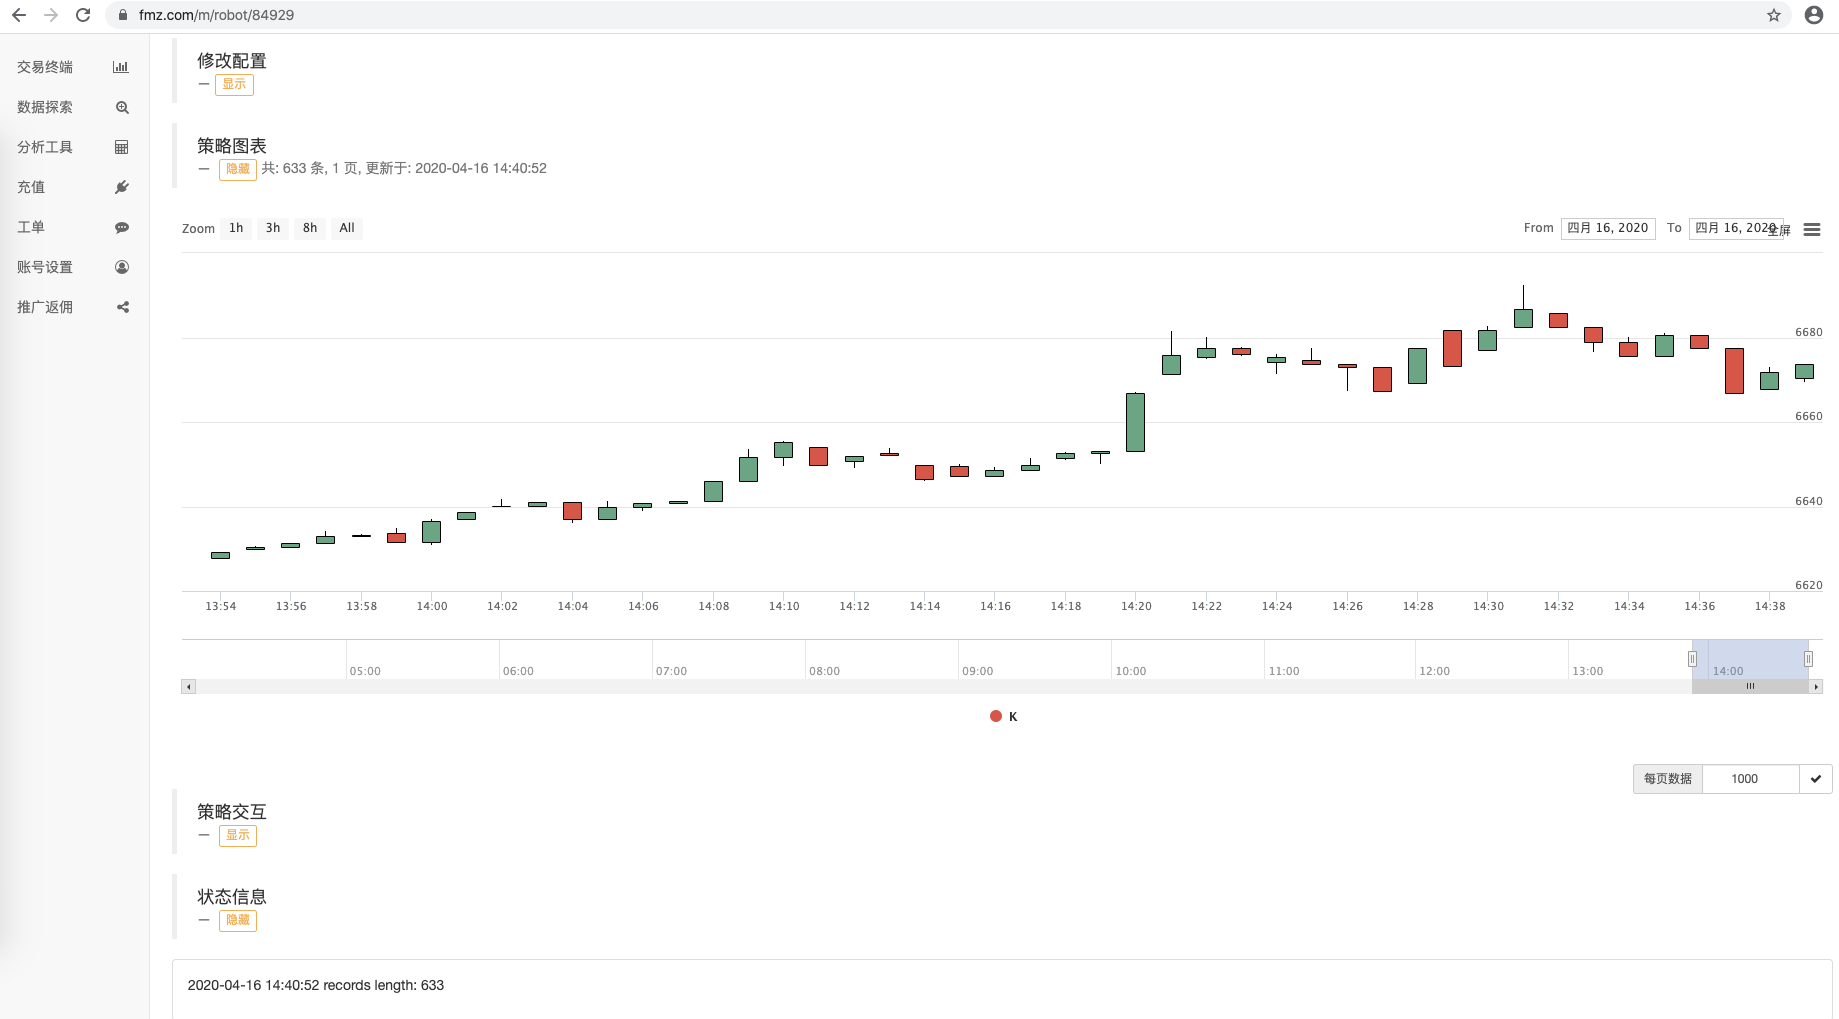
wexAppThis page is about: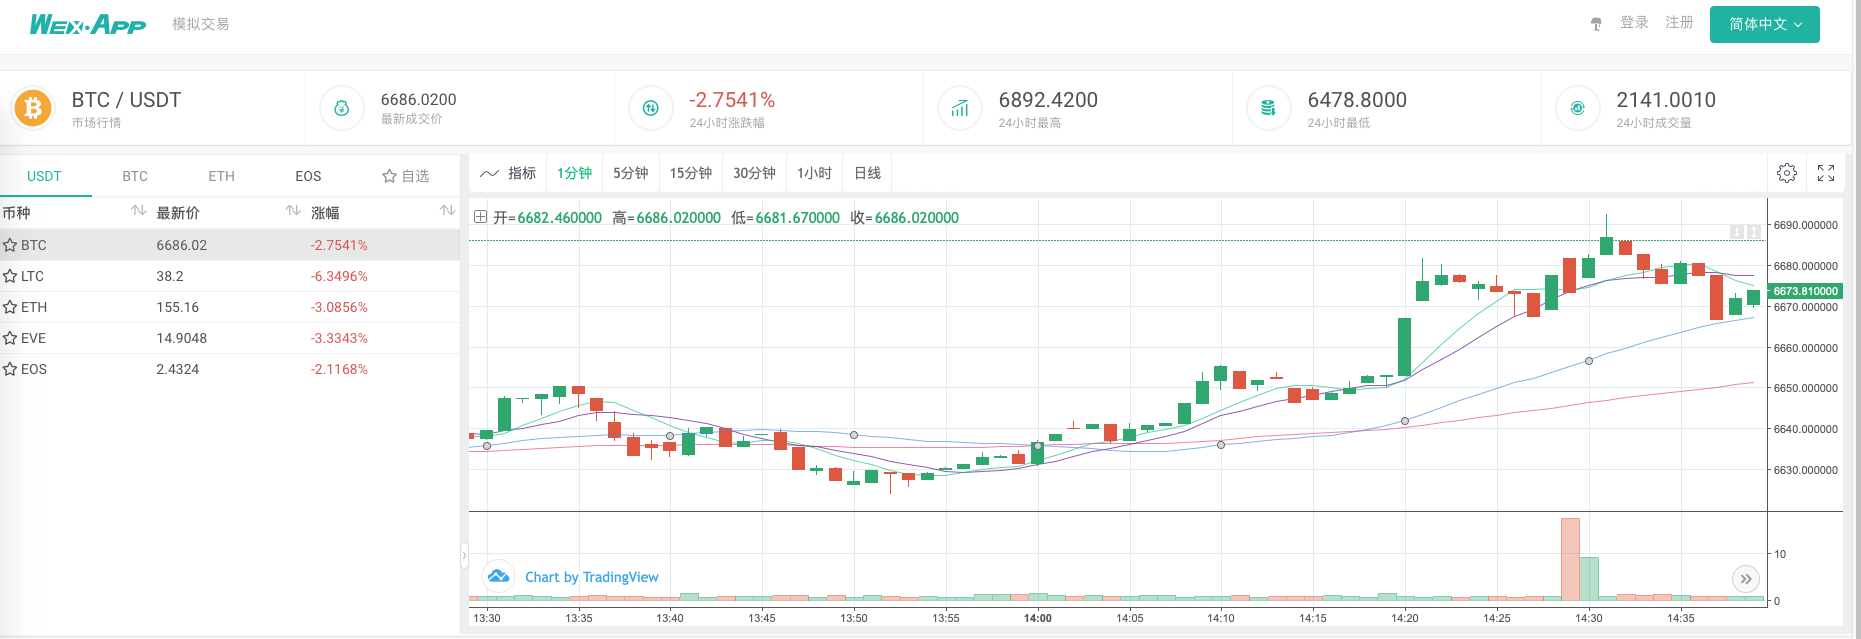
As you can see in the diagram, robots with different IDs share K-line data using one data source.
Collect K-line data of any period
By relying on the powerful capabilities of the inventor's quantized trading platform, we can easily achieve the collection of arbitrary cycle K-line data. For example, if I want to collect a 3-minute K-line, what if the exchange doesn't have a 3-minute K-line?
We modified the configuration of the collector robot, set the K-line cycle to 3 minutes, and the inventor of the quantitative trading platform automatically synthesizes 3 minutes of K-line to the collector program.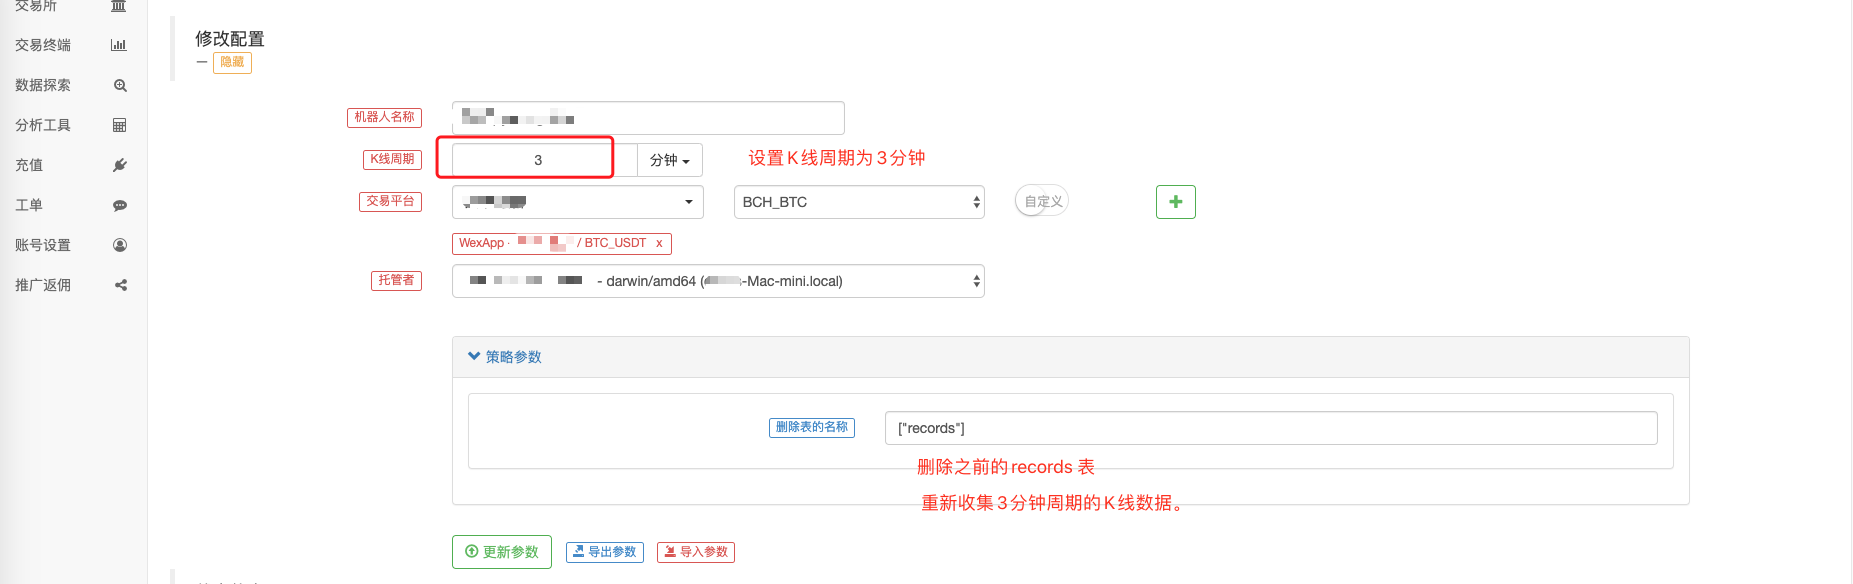
We use the parameters.删除表的名称, set to:["records"]Delete previously collected 1-minute K-line data tables.
Start up收集器程序Starting again使用数据的策略机器人。
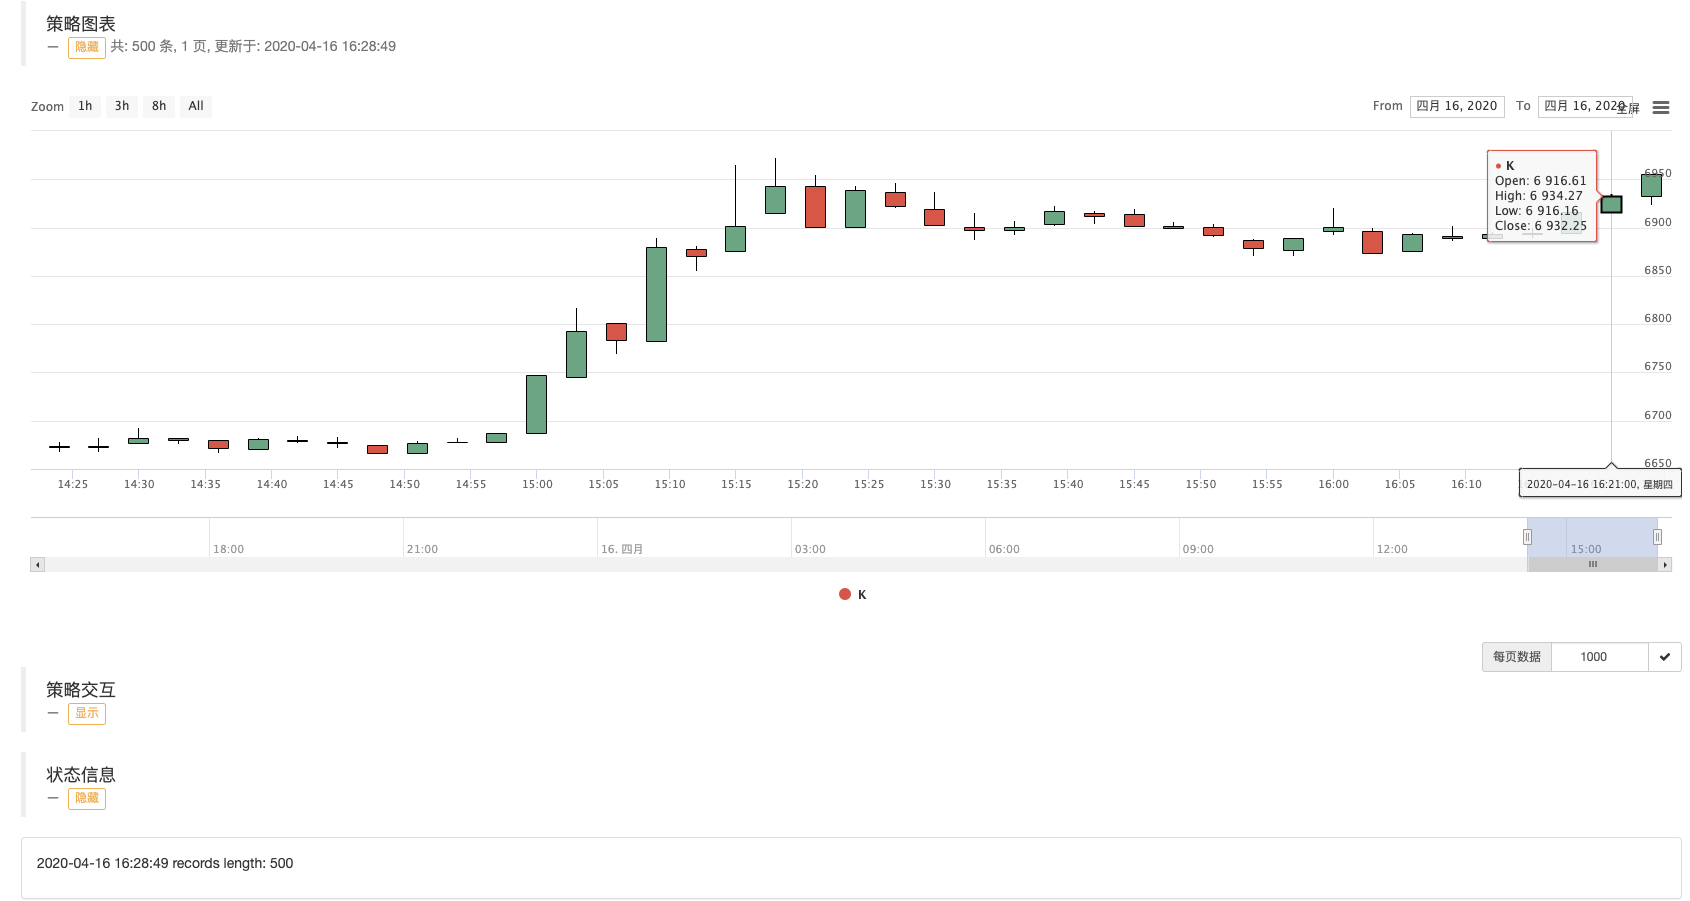
You can see the K-line graph drawn, where the interval between the BARs is 3 minutes, and each BAR is a K-line column with a 3-minute cycle.
In the next phase, we will try to implement the need for custom data sources. Thank you for reading.
- Quantifying Fundamental Analysis in the Cryptocurrency Market: Let Data Speak for Itself!
- Quantified research on the basics of coin circles - stop believing in all kinds of crazy professors, data is objective!
- The inventor of the Quantitative Data Exploration Module, an essential tool in the field of quantitative trading.
- Mastering Everything - Introduction to FMZ New Version of Trading Terminal (with TRB Arbitrage Source Code)
- Get all the details about the new FMZ trading terminal (with the TRB suite source code)
- FMZ Quant: An Analysis of Common Requirements Design Examples in the Cryptocurrency Market (II)
- How to Exploit Brainless Selling Bots with a High-Frequency Strategy in 80 Lines of Code
- FMZ quantification: common demands on the cryptocurrency market design example analysis (II)
- How to exploit brainless robots for sale with high-frequency strategies of 80 lines of code
- FMZ Quant: An Analysis of Common Requirements Design Examples in the Cryptocurrency Market (I)
- FMZ quantification: common demands of the cryptocurrency market design instance analysis (1)
- JavaScript version of the SuperTrend policy
- [Millennium War] Currency exchange multi-currency hedging strategies Recent recaps and results of the minute-level K-line review ((Part 4)
- [Millennium War] Bitcoin futures do nothing and do more and more and more and more and more and more and more and more and more and more and more and more and more and more and more and more and more and more and more and more and more]
- [Millennium War] Bitcoin futures do nothing and do more and more and more and more and more and more and more and more and more and more and more and more.
- [Millennium War] Research on multi-currency hedging strategies in the field of currency exchange (part 1)
- 98 undergraduate coins and the way to quantify
xukitty Wonderful
zltimThe top
zltimThe top
homilyThank you.
dsaidasiThe top
The Little DreamThanks for the support, I'm python, I'm a little white, I'm throwing the dice, I'm hoping for a better implementation or suggestion.