JavaScript policy retrieval in the Chrome browser by DevTools debugging
Author: The Little Dream, Created: 2022-06-22 14:23:26, Updated: 2023-09-18 20:24:01
JavaScript policy retrieval in the Chrome browser by DevTools debugging
For debugging policies in feedback systems, it is usually only possible to useLog()Function: DEBUG is very inefficient and difficult for beginners with little experience in program testing.JavaScriptIn the case of language debugger strategiesChromeBrowsers have better support. It is possible to perform interrupt debugging, single-step debugging, variable value monitoring, expression monitoring, etc.JavascriptDEBUG when the language policy is retested. Note that only on FMZJavascriptThe language strategy supports this debug method.
The FMZ platformdebuggerInstructions
Inserted in the policy code of the JavaScript language on FMZdebuggerInstructions that can interrupt the execution of a program during a retest.
We use the following test strategy code:
/*backtest
start: 2022-03-21 09:00:00
end: 2022-06-21 15:00:00
period: 30m
basePeriod: 15m
exchanges: [{"eid":"Binance","currency":"BTC_USDT"}]
*/

function main() {
    var n = 1
    while (true) {
        var t = exchange.GetTicker()
        debugger
        var r = exchange.GetRecords()
        if (n == 1) {
            // 下买单,此处有错误,会报错,返回null,GetTicker返回数据t,只有Buy属性,没有buy属性,属性名区分大小写
            var id = exchange.Buy(t.buy, 0.1)
            var orderBuy = exchange.GetOrder(id)
        }
        Sleep(500)
    }
}
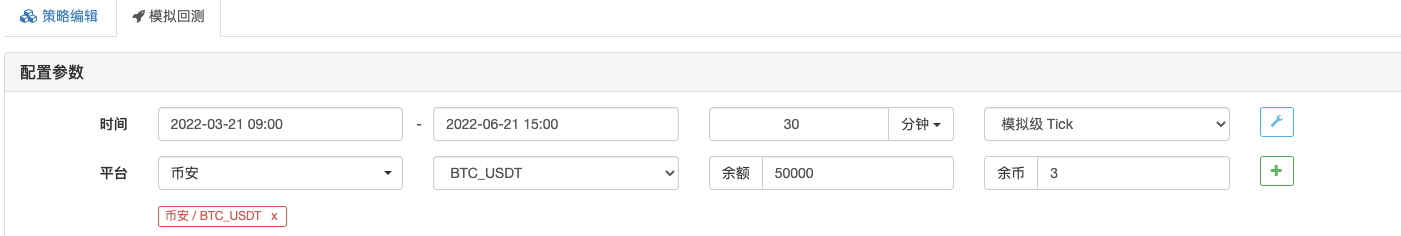
From retesting the configuration code
/*backtest
start: 2022-03-21 09:00:00
end: 2022-06-21 15:00:00
period: 30m
basePeriod: 15m
exchanges: [{"eid":"Binance","currency":"BTC_USDT"}]
*/
You can see that the exchange we added when we reviewed is Binance (Binance) spot, configured as in the screenshot:
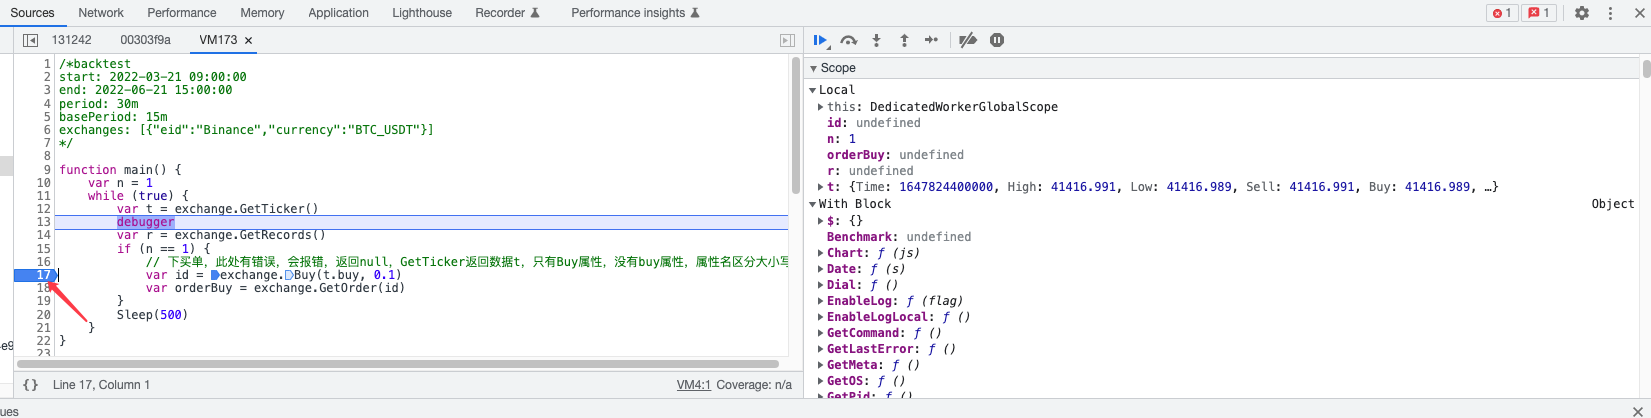
So if we keep looking at the strategy code, we can see thatvar t = exchange.GetTicker()And we wrote it down.debuggerInstruction, which is equivalent to a break point, where the program stops executing until it reaches this point.debuggerHowever, it is not recommended to do this, just by typing a break in a certain location, and subsequent breaks can be set in the browser's DevTools debug function.
You need to open the Chrome browser firstDevToolsRepeat the test, set in the policy code.debuggerI'm not sure if this is a good idea or not.debuggerThis is ignored, and the retrieved policy cannot be interrupted to stop at the interrupt position. Open.DevToolsAfter reviewing the policy, the policy program will be interrupted at the first set.debuggerLocation:debuggerIt can also be set in the global scope of the policy code.
We're going to open up the Chrome browser.DevToolsThere are two ways to use the tool:
-
First, we use the right-click button to open the pop-up menu.
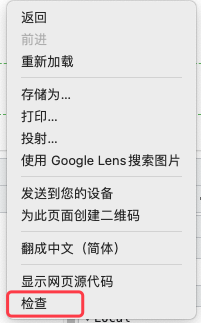
We click on "Check" and the DevTools interface is displayed.
-
2 Use the shortcut key
You can also use the shortcut key to open it and press
Command+Option+I (Mac)orControl+Shift+I(Windows、Linux)Open upDevTools。
Open upDevToolsThis is what happened after:
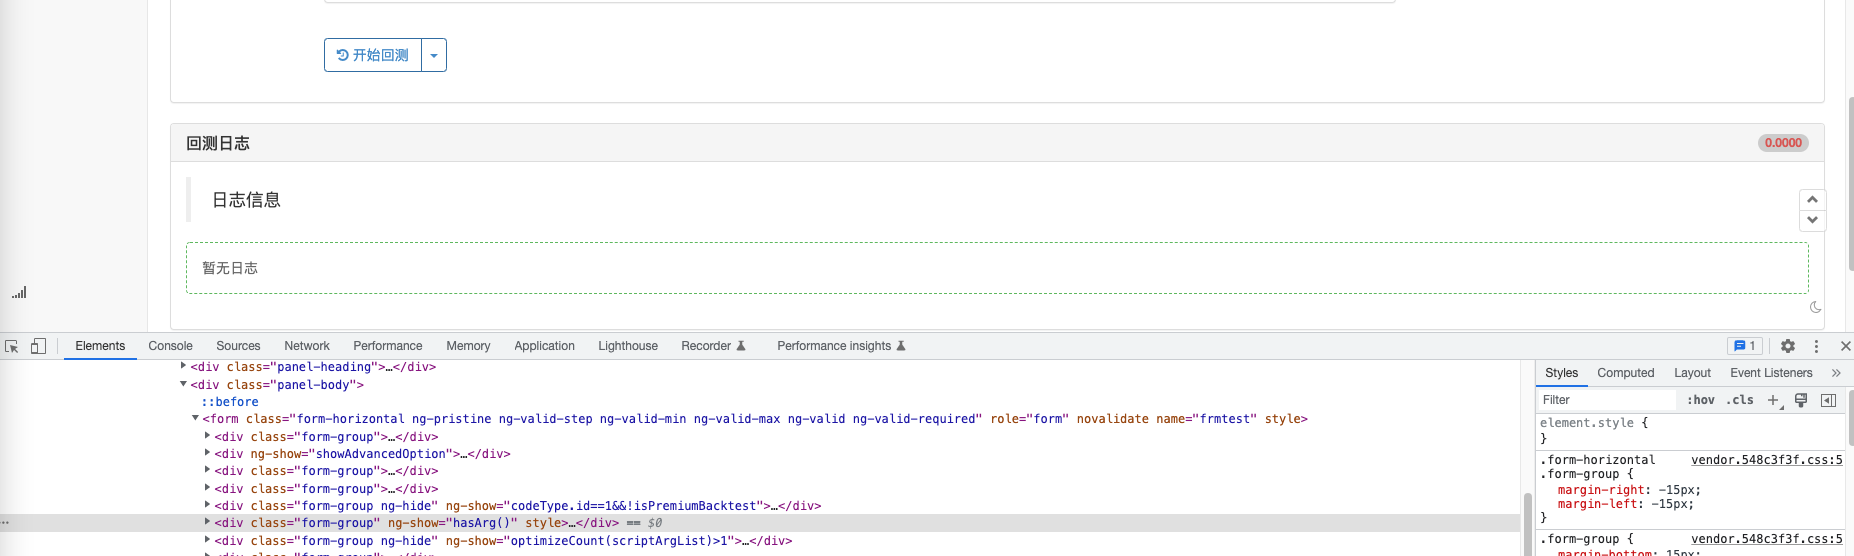
Interface for DEBUG in the browser for JavaScript language policy
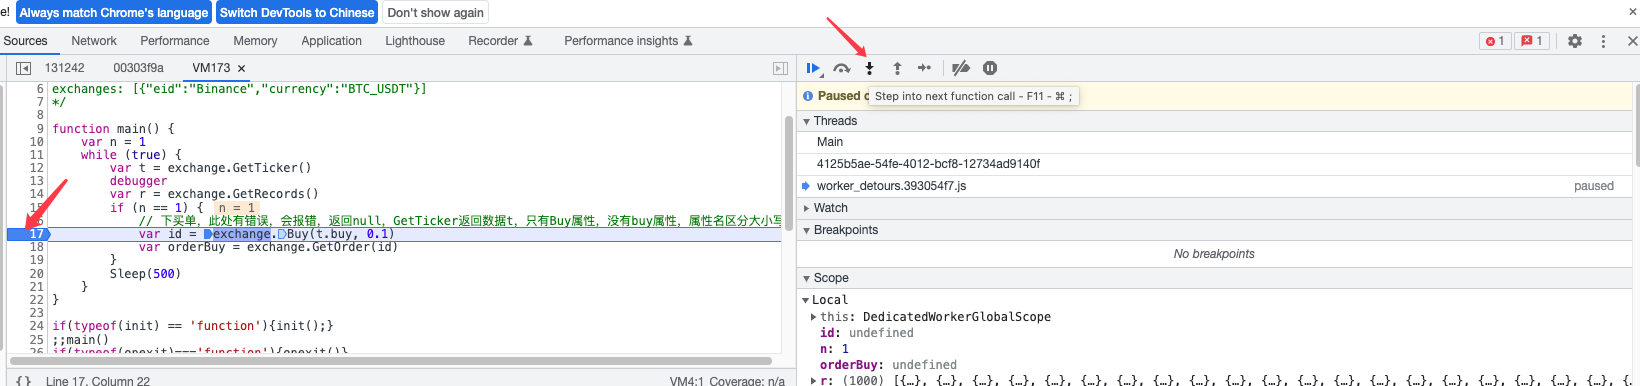
And then the test above, when we click the "Start Retest" button, the retest policy is set in the code because it's set in the code.debuggerInstruction, policy interrupt at the corresponding location and wait. The retrieval is like stuck dead, as shown below:
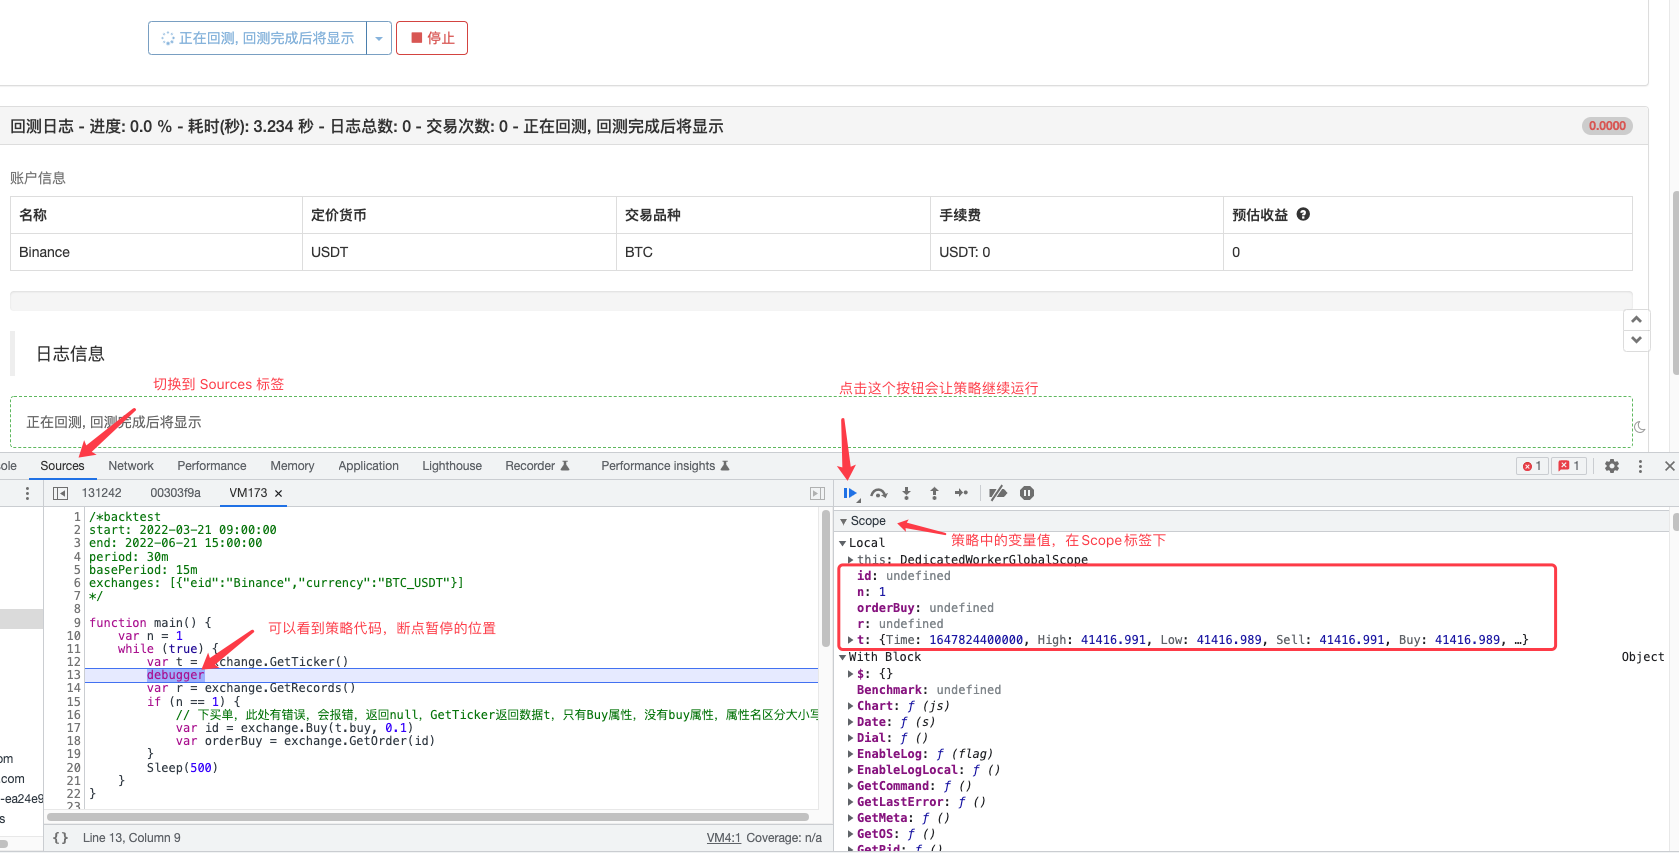
You can see that in the strategydebuggerMarking the location of the interrupt, the entire program only executes the n assignment as 1, t assignment asGetTickerThe function returns transactional data. The red box in the diagram above shows the values of the specific variables, so it is easy to see the values of each variable when the policy is running.
Manually set the breakpoint debugging
We can click on the line number on the left side of the code and add a period.
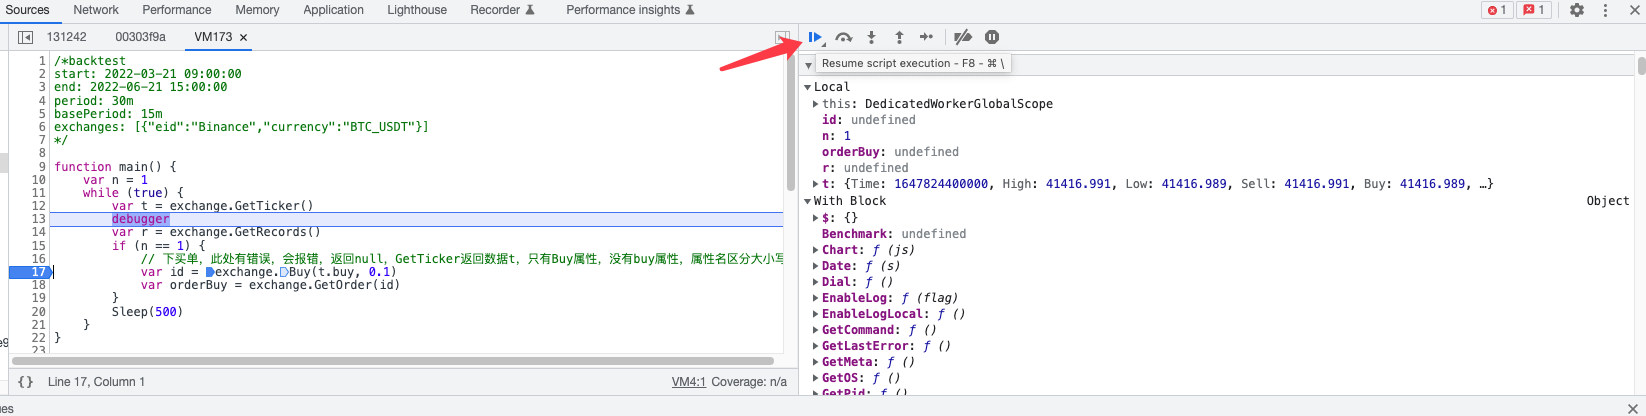
Clicking "resume script execution" resumes the script execution, the program will run to the next breakpoint, and the retest will end if there is no breakpoint or the program has an error that causes an exception.
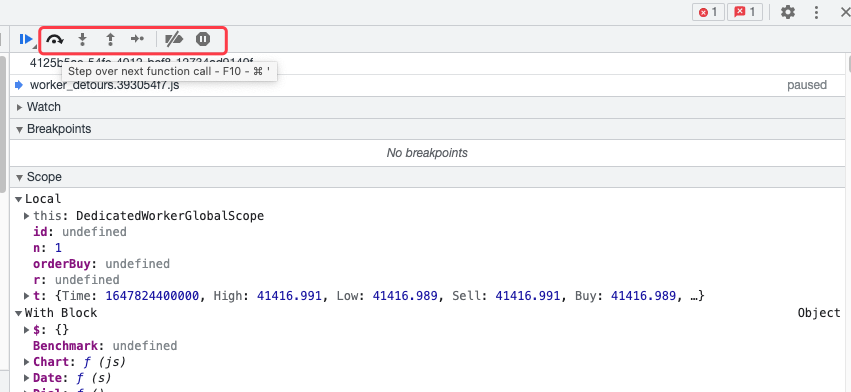
There are also several buttons that can be implemented: skip the next function, go to the next function call, skip the current function call, single-step execution, ignore all breaks, etc.
DEBUG this test code.
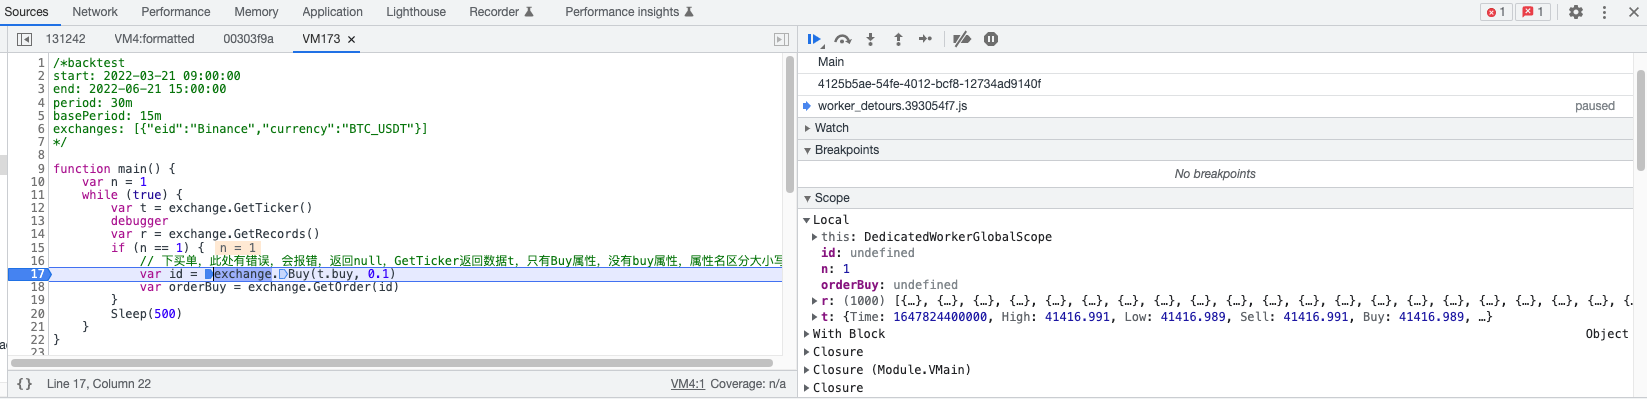
At this point, when we continue to click the "resume script execution" button to continue execution, the policy will run an exception, the retest ends, and a "exceptional error message" is printed.
main:17:31 - TypeError: Cannot convert "undefined" to double
This is a common mistake for beginners to make when writing a structural attribute name without distinguishing between upper and lower case.
var id = exchange.Buy(t.buy, 0.1) // 下买单,此处有错误,会报错,返回null,GetTicker返回数据t,只有Buy属性,没有buy属性。
导致传入exchange.Buy函数的价格是一个undefined变量,引起程序异常,回测结束。
This line of code is not executed when the program stops at the break point. We continue by clicking the "step into next function call" button.
跳转到exchange.Buy函数调用中。
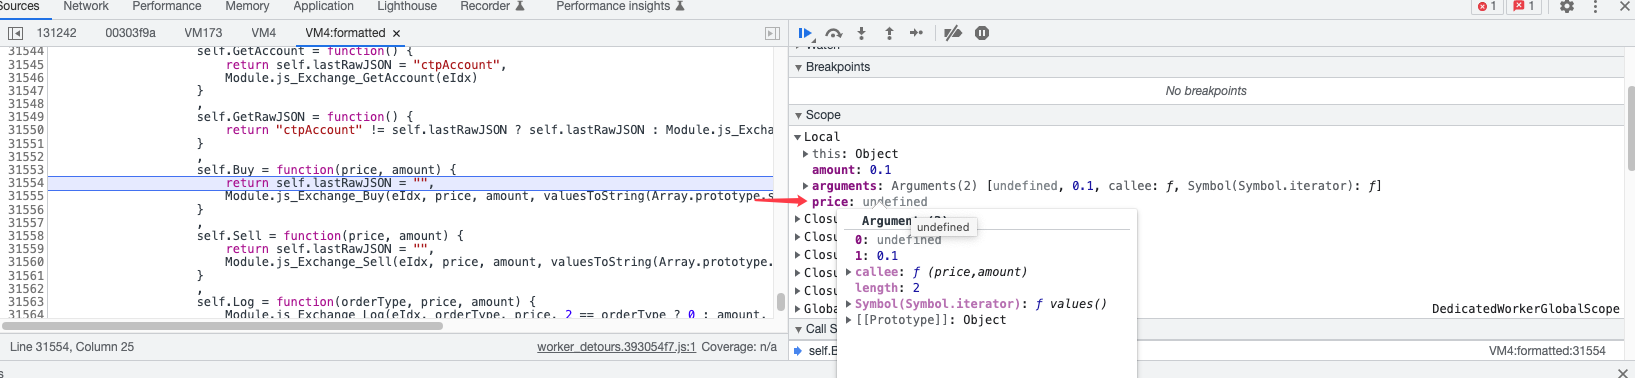
See price as an undefined variable.
Using the above method, it is easy to find out the program's BUG step by step. Many common mistakes made by beginners: for example, the index access of the array crosses the boundary, refers to undefined variables, expressions write errors, etc. This way it is easy to DEBUG the program.
- Quantifying Fundamental Analysis in the Cryptocurrency Market: Let Data Speak for Itself!
- Quantified research on the basics of coin circles - stop believing in all kinds of crazy professors, data is objective!
- The inventor of the Quantitative Data Exploration Module, an essential tool in the field of quantitative trading.
- Mastering Everything - Introduction to FMZ New Version of Trading Terminal (with TRB Arbitrage Source Code)
- Get all the details about the new FMZ trading terminal (with the TRB suite source code)
- FMZ Quant: An Analysis of Common Requirements Design Examples in the Cryptocurrency Market (II)
- How to Exploit Brainless Selling Bots with a High-Frequency Strategy in 80 Lines of Code
- FMZ quantification: common demands on the cryptocurrency market design example analysis (II)
- How to exploit brainless robots for sale with high-frequency strategies of 80 lines of code
- FMZ Quant: An Analysis of Common Requirements Design Examples in the Cryptocurrency Market (I)
- FMZ quantification: common demands of the cryptocurrency market design instance analysis (1)
- JavaScript strategy backtesting is debugged in DevTools of Chrome browser
- Visualizing modules to build trading strategies - in depth
fmzeroThe bedroom, can you do that, 666?