This is the first time that the U.S. government has taken a similar approach.
Author: Peanut butter and jelly, Date: 2020-04-18 22:54:45Tags: ATR
The full T-Shine public domain, translated by T-Shine Special Policy. Below is a transcript of the video. If you want to know more about the "Quantified World of Thousands" get more strategic source code! I'm also going to advertise for myself. Publications "Quantitative logs of soybeans" I'm not going to go into detail about how I'm going to do this. I'm sure you'll get more benefits.
It's just I'm going to demo! I'm going to demo! Aunt Demo! What is this? Parents, be careful with the real deal!
With a good volatility rate, it's as simple as that to run and win the BTC jackpot! The original, The Ocean Ocean, The Quantified World of Thousands 3 days ago Quantitative strategy research and development is actually a two-way street, very difficult for those just starting out, difficult not only to code at the level of the magic wand, but also difficult at the level of strategic logical thinking. Both are important and should not be biased.
Hello to all the thousands of quantities!
This is the second edition of this special edition, and we are honored to be invited to the O'Reilly O'Reilly Museum to present: How to use the volatility factor to easily win the BTC market, and achieve a decreasing dimensional attack on Bitcoin!
Liu Shen comes from a traditional quantity investment institution, has also been deeply involved in the coin exchange business, has a rich experience and unique insights in the field of quantification. The content of this issue covers the revelation of ideas, coding realization and personal realization, etc.
The following applause: Please tell us about your volatility strategy.
01
—
The Preface
Hello, today I have the privilege of pushing the article in the thousands of quantum publications, and also thank you for the invitation of the owner of T (one of the thousands of foreign numbers).
The owner of T said to write a quantified, and not give any scope, really do not know where to write from. Then start from your favorite topic to discuss with others. Quantification indicators and strategies (that can be assisted and automated), of course, finally we also add an old saying: investing in the market is risky, to enter the market need to be careful, the strategy is only to provide ideas and lessons, profit and loss.
After the disclaimer, we begin the actual topic below.
02
—
A simple volatility strategy
People who know me know that I personally don't like alpha games, I'm more of a beta player, and I'm more interested in beta research. So why, e.........mmmmm, I don't know.
The development of quantitative strategies is actually two-sided, it is very difficult for people who are just starting out, it is difficult not only to code at the level of the magic bullet, but also difficult to think strategically at the level of the algorithm. Both are important and should not be biased. Today's strategy is actually inspired by a research paper from HuaThai many years ago.
The strategy algorithm uses the principle of rolling yield fluctuations in the fall of the price of the logarithmic periodic slope, according to which the range is calculated to find the highest and lowest values of the rolling periodic slope, the highest value as the up pipeline, the lowest value as the down pipeline, break the up pipeline, open a position.
The specific graphical visualization interface can be found in the following PPT. The graphic was drawn by myself using Pyecharts.
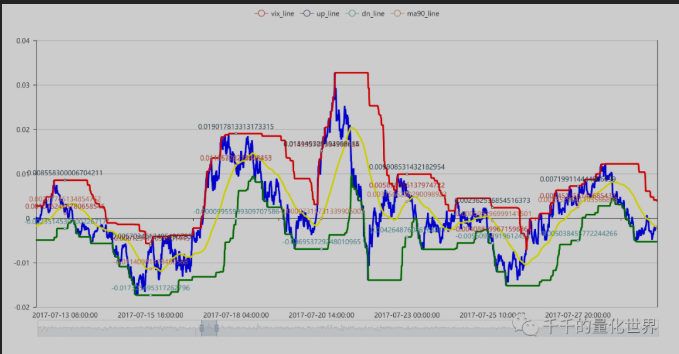
In fact, this strategy is the same as the one I used before doing broad-based ETFs, and of course also used to buy and sell stocks when choosing an index, and then moved directly to the coin circle, and was surprised to find that it really reduces the impact, the parameters do not need to change.
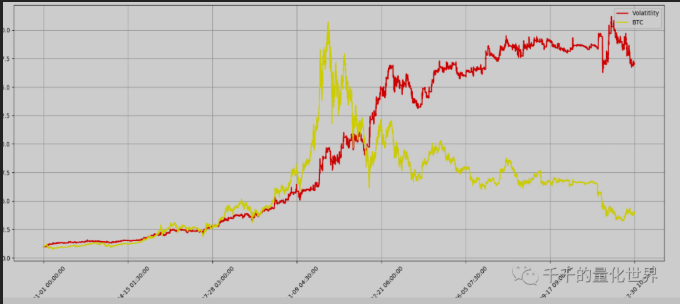
The following graph shows the performance of the review for the year, with a screenshot of the code logic for specific parts:
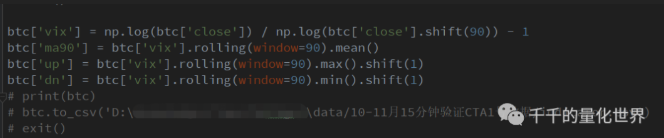
The above is actually the reading of the data and the calculation of the indicator data through the pandas.
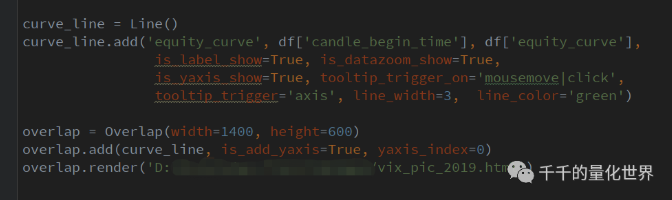
Once the calculation is complete, the data can be output via the pd.to_csv function and the pyecharts used in the screenshot above can be visualized. Note: I used the old version of pyecharts.
All the specific strategies, visualizations, and performance indicator codes are chatter T-shirts.
03
—
Quantifying
First, good tactics are not afraid of publicity, and this is not a war-level weapon development that will decide life and death, so I and some other agencies or individuals, are not afraid of so-called secret tactics, because in my opinion, CTA has no secrets. This version is the oldest version, and several versions have been upgraded on this basis, for example, adding other conditions of judgment and deterrence, etc., and of course including other varieties of cycle parameters adjustments, etc.
Secondly, many people, whether new or new or even old players, need inspiration, including factor mining of stocks, ideas for timing strategies, etc. These often come from subjective experience, research papers, communication exchanges within the circle, etc.
Finally, to sum up, quantification was originally a byproduct, and programmatic transactions belonged to the subset of quantification, as far back as the university (circa 2009), when TB, pyramid, etc. were being hunted, and if it continues today, it can be said that this part of the earliest prophetic forecasters is 10 years old, not including those who brought back the high-frequency strategies and systems from Wall Street. Therefore, the quantification strategy or programmatic strategy in China has been going on for some time, but in the current market share and players, and policy support, quantification is still a very small part of existence, despite the fact that many analytical and strategic models are built.
Lastly, thank you to the Quantified Quadrant community for their trust in my profession and for the article invitation. If you have any specific code and strategy questions, please email me personally or T Quadrant, I'm also in the T Quadrant group.
Finally, thank you again for the wonderful explanation!
If you haven't joined the Qt discussion group yet, please join the group and get the information!
It's a beautiful building!

WeChat wiped out The issue of public attention
/*backtest
start: 2019-04-18 00:00:00
end: 2020-04-17 23:59:00
period: 15m
exchanges: [{"eid":"Futures_BitMEX","currency":"XBT_USD"}]
*/

// 胖友们!! 实盘前请注意!! 此内容仅是吕神翻译demo, 上实盘请自行添加相关内容.
// 是Demo!!! 实盘谨慎!!!

// 初始化
exchange.SetContractType('XBTUSD')
var vix_arr = []
var vix_ma = []
var vix_ma_up = []
var vix_ma_dw = []
var LastBarTime = 0
var isFirst = true

function initVix() {
    records = _C(exchange.GetRecords)
    Log(records.length)
    if (records && records.length > 2 * N + 2) {
        // 初始化前N个vix值
        for (var i = -2; i < N - 1; i++) {
            Bar = records[records.length - N + i]
            lastNbar = records[records.length - N + i - N]
            Vix()
        }
    }
    // Log("vix_arr", vix_arr.length, vix_arr)
    // Log("vix_ma", vix_ma.length, vix_ma)
    // Log("vix_ma_up", vix_ma_up.length, vix_ma_up)
    // Log("vix_ma_dw", vix_ma_dw.length, vix_ma_dw)
}

// 获取交易所信息
function UpdateInfo() {
    account = _C(exchange.GetAccount)
    pos = _C(exchange.GetPosition)
    records = _C(exchange.GetRecords)
    Bar = records[records.length - 1]
    lastNbar = records[records.length - N]
    ticker = _C(exchange.GetTicker)
}

// 计算波动率及上下轨
function Vix() {
    // 当每K结束时计算
    if (LastBarTime !== Bar.Time) {
        // 当K达到计算根数开始计算vix_arr
        if (records && records.length > N) {
            // 获取vix 当前close自然对数 除以 前90根自然对数 减一
            vix = Math.log(Bar.Close) / Math.log(lastNbar.Close) - 1
            vix_arr.push(vix)
            //Log("vix_arr", vix_arr)
        }
        // 当vix_arr达到计算根数时开始计算vix_ma
        if (vix_arr && vix_arr.length > N) {
            // 获取对应周期vix算其移动平均值
            vix_ma = TA.MA(vix_arr, N)
            // 去除ma中的null值
            vix_ma = vix_ma.filter(function(val) {
                return !(!val || val === "");
            })
            //Log("vix_ma", vix_ma)
            // 获取上下通道
            vix_up = TA.Highest(vix_arr, N)
            vix_dw = TA.Lowest(vix_arr, N)
            vix_ma_up.push(vix_up)
            vix_ma_dw.push(vix_dw)
            // Log("vix_ma_up", vix_ma_up)
            //Log("vix_ma_dw", vix_ma_dw)
            // 限制所有数组长度
            if (vix_arr.length > 2000) {
                vix_arr.splice(0, 1);
            }
            if (vix_ma.length > 2000) {
                vix_ma.splice(0, 1);
            }
            if (vix_ma_up.length > 2000) {
                vix_ma_up.splice(0, 1);
            }
            if (vix_ma_dw.length > 2000) {
                vix_ma_dw.splice(0, 1);
            }
        }
        LastBarTime = Bar.Time
    }
}

// 画线
function PlotMA_Kline(records, isFirst) {
    //$.PlotRecords(records, "K")
    if (isFirst) {
        for (var i = records.length - 1 - N; i <= records.length - 1; i++) {
            if (vix_ma[i] !== null) {
                $.PlotLine("vix_arr", vix_arr[i], records[i].Time)
                $.PlotLine("vix_ma", vix_ma[i], records[i].Time)
                $.PlotLine("vix_ma_up", vix_ma_up[i], records[i].Time)
                $.PlotLine("vix_ma_dw", vix_ma_dw[i], records[i].Time)
            }
        }
        PreBarTime = records[records.length - 1].Time
    } else {
        if (PreBarTime !== records[records.length - 1].Time) {
            $.PlotLine("vix_arr", vix_arr[vix_arr.length - 2], records[records.length - 2].Time)
            $.PlotLine("vix_ma", vix_ma[vix_ma.length - 2], records[records.length - 2].Time)
            $.PlotLine("vix_ma_up", vix_ma_up[vix_ma_up.length - 2], records[records.length - 2].Time)
            $.PlotLine("vix_ma_dw", vix_ma_dw[vix_ma_dw.length - 2], records[records.length - 2].Time)
            PreBarTime = records[records.length - 1].Time
        }
        $.PlotLine("vix_arr", vix_arr[vix_arr.length - 1], records[records.length - 1].Time)
        $.PlotLine("vix_ma", vix_ma[vix_ma.length - 1], records[records.length - 1].Time)
        $.PlotLine("vix_ma_up", vix_ma_up[vix_ma_up.length - 1], records[records.length - 1].Time)
        $.PlotLine("vix_ma_dw", vix_ma_dw[vix_ma_dw.length - 1], records[records.length - 1].Time)
    }
}

// 交易逻辑
function onTick() {
    // 无仓位时
    if (pos.length == 0) {
        // Long 当前K线的收盘价 > 上轨 && 之前K线的收盘价 <= 上轨
        if (vix_arr[vix_arr.length - 1] > vix_ma_up[vix_ma_up.length - 1] &&
            vix_arr[vix_arr.length - 2] <= vix_ma_up[vix_ma_up.length - 2]) {
            exchange.SetDirection("buy")
            exchange.Buy(ticker.Sell, Amount)
            $.PlotFlag(new Date().getTime(), 'Buy', 'BK')
        }
        // Short 当前K线的收盘价 < 下轨 && 之前K线的收盘价 >= 下轨
        if (vix_arr[vix_arr.length - 1] < vix_ma_dw[vix_ma_dw.length - 1] &&
            vix_arr[vix_arr.length - 2] >= vix_ma_dw[vix_ma_dw.length - 2]) {
            exchange.SetDirection("sell")
            exchange.Sell(ticker.Buy, Amount)
            $.PlotFlag(new Date().getTime(), 'Sell', 'SK')
        }
    }
    // 多仓时
    if (pos.length > 0 && pos[0].Type == 0) {
        // 平多 当前K线的收盘价 < 中轨 && 之前K线的收盘价 >= 中轨
        if (vix_arr[vix_arr.length - 1] < vix_ma[vix_ma.length - 1] &&
            vix_arr[vix_arr.length - 2] >= vix_ma[vix_ma.length - 2]) {
            exchange.SetDirection("closebuy")
            exchange.Sell(ticker.Buy, pos[0].Amount)
            $.PlotFlag(new Date().getTime(), 'Sell', 'SBK')
        }
    }
    // 空仓时
    if (pos.length > 0 && pos[0].Type == 1) {
        // 平空 当前K线的收盘价 > 中轨 && 之前K线的收盘价 <= 中轨
        if (vix_arr[vix_arr.length - 1] > vix_ma[vix_ma.length - 1] &&
            vix_arr[vix_arr.length - 2] <= vix_ma[vix_ma.length - 2]) {
            exchange.SetDirection("closesell")
            exchange.Buy(ticker.Sell, pos[0].Amount)
            $.PlotFlag(new Date().getTime(), 'Buy', 'PSK')
        }
    }
}

function main() {
    initVix()
    while (1) {
        UpdateInfo()
        Vix()
        onTick()
        if (records) {
            PlotMA_Kline(records, isFirst)
            //Log('画线')
            isFirst = false
        }
        Sleep(5 * 1000)
    }
}
- EMA trend tracking (quarterly for the week)
- Digital currency futures trading library (test version)
- TradingViewWebHook signals execution strategies (including tutorials)
- Buy and sell on a rotating basis
- Binance Sustainable Multicurrency Hedging Strategy (Doing a lot of overshooting to do a lot of overshooting) (Python version)
- The SuperTrend Strategy is taught.
- Three lines of code implementing Argos machine learning to quickly interpret industry news
- Locally stored
- The coin-throwing strategy (●'
'●) - SuperTrend V1
- RecordsCollector (teaching)
- A complicated example of a hybrid graph
- The super-falling super-high super-bull version
- Binance Strategy Two: Removing highs and lows
- Ordered the contract
- Binance Sustainable Multicurrency Hedging Strategy Original version (Doing more overshooting do more overshooting) 13th April latest stop loss module
- Binance Sustainable Multicurrency Hedging Strategy (Do or Do Multi-Currency Index) 10 April Improved Bug, needs to be updated
- MACD low buy high sell automatically slide stop loss
- The first time a new currency was posted on the exchange
- Multiplatform hedging to stabilize leverage
Inventors quantifiedI'm going to cross over to https://www.fmz.com/strategy/361827
rootmeThe beans are always beautiful.
A cup of black teaThis strategy doesn't seem to have much to do with volatility.
homilyI can't describe the fluctuation rate, barely a relationship of the amplitude of the fluctuation, except for me 90 cycles ago. The opening method of HH, LL is the operation of the Dongch'an channel DC, and the placement is chosen using a uniform strategy. The implicit volatility, or leave it to the experts to describe.
Light cloudsBean Sister, will you take the bag?
shzyhyYou ask me if I support it, I certainly do.
shzyhyYou ask me if I support it, I certainly do.
Light cloudsGood for you.
Peanut butter and jellyI'm going to have to wait until the end of the year for the next half of the year.
Light cloudsI'm going to have to go to the hospital.
Peanut butter and jelly (^U^)ノ~YO
Peanut butter and jellyI don't have the time right now, I don't have the time to think about it, but I'm not really good at coding, so I can't use series. I'm not going to lie to you.