Realización del indicador de Fisher en JavaScript y trazado en FMZ
El autor:No lo sé., Creado: 2022-04-07 16:04:22, Actualizado:Realización del indicador de Fisher en JavaScript y trazado en FMZ
Durante el análisis técnico en el comercio, todos los comerciantes toman los datos de precios de las acciones como datos normalmente distribuidos para analizar y estudiar.Fisher Transformationes un método que puede transformar los datos de precios en algo similar a una distribución normal.Fisher TransformationLas señales de negociación pueden enviarse mediante la interrelación de los indicadores del día de hoy y del día anterior.
Hay tantas referencias sobreFisher Transformationen Baidu y Zhihu, que no se explicará aquí en detalle.
Algoritmo del indicador:
-
El precio medio de hoy:
mid=(low + high) / 2 -
Confirme el período de cálculo; puede utilizar 10 días por período.
lowestLow = the lowest price in the period,highestHigh = the highest price in the period. -
Definir el parámetro de cambio de precios (en el que
ratioes una constante de 0 a 1; por ejemplo, puede elegir 0.5 o 0.33):(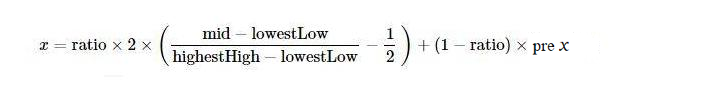
-
Aplicación
Fishertransformación al parámetro de cambio de preciox, y elFisherel indicador puede obtenerse: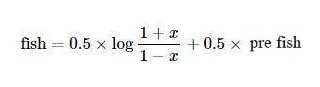
Utilice JavaScript para realizar el algoritmo
De acuerdo con el algoritmo del indicador, realizarlo paso a paso.preX, preFish, se establecen inicialmente en 0.Math.loges el logaritmo basado en la constante natural e Además, la modificación de x no se menciona en el algoritmo anterior, y casi ignoré este problema durante la escritura:
Modificar el valor de x; si el valor es superior a 0,99, se establece por la fuerza a 0,999; si es menor a -0,99, se establece a -0,999.
        if (x > 0.99) {
            x = 0.999
        } else if (x < -0.99) {
            x = -0.999
        }
Esta es la primera vez que veo el algoritmo y el indicador, después de portarlo de acuerdo con el algoritmo. No he verificado la implementación, y los estudiantes que están interesados en la investigación pueden verificar si hay errores. Muchas gracias por señalar errores, si los hay.
Código fuente deFisher Transformalgoritmo del indicador:
function getHighest(arr, period) {
    if (arr.length == 0 || arr.length - period < 0) {
        return null
    }
    var beginIndex = arr.length - period
    var ret = arr[beginIndex].High
    for (var i = 0 ; i < arr.length - 1 ; i++) {
        if (arr[i + 1].High > ret) {
            ret = arr[i + 1].High
        }
    }
    return ret
}

function getLowest(arr, period) {
    if (arr.length == 0 || arr.length - period < 0) {
        return null
    }
    var beginIndex = arr.length - period
    var ret = arr[beginIndex].Low
    for (var i = 0 ; i < arr.length - 1 ; i++) {
        if (arr[i + 1].Low < ret) {
            ret = arr[i + 1].Low
        }
    }
    return ret
}

function calcFisher(records, ratio, period) {
    var preFish = 0
    var preX = 0
    var arrFish = []
    // when the K-line length is not long enough to meet the K-line period
    if (records.length < period) {
        for (var i = 0 ; i < records.length ; i++) {
            arrFish.push(0)
        }
        return arrFish
    }

    // traverse K-lines
    for (var i = 0 ; i < records.length ; i++) {
        var fish = 0
        var x = 0
        var bar = records[i]
        var mid = (bar.High + bar.Low) / 2
        // when the current BAR is not enough for period to calculate
        if (i < period - 1) {
            fish = 0
            preFish = 0
            arrFish.push(fish)
            continue
        }

        // calculate the highest price and the lowest price in the period
        var bars = []
        for (var j = 0 ; j <= i ; j++) {
            bars.push(records[j])
        }
        var lowestLow = getLowest(bars, period)
        var highestHigh = getHighest(bars, period)

        // price change parameter x
        x = ratio * 2 * ((mid - lowestLow) / (highestHigh - lowestLow) - 0.5) + (1 - ratio) * preX
        if (x > 0.99) {
            x = 0.999
        } else if (x < -0.99) {
            x = -0.999
        }
        preX = x
        fish = 0.5 * Math.log((1 + x) / (1 - x)) + 0.5 * preFish
        preFish = fish
        arrFish.push(fish)
    }
    return arrFish
}
Trama
Es muy fácil de trazar en FMZ; se puede referir a un montón de ejemplos en el cuadrado de la estrategia:https://www.fmz.com/square, y también puede buscar las estrategias que necesita.
var cfg = {    // used to initially configure the chart objects (namely chart settings)
    plotOptions: {
        candlestick: {
            color: '#d75442',  // color value
            upColor: '#6ba583' // color vlaue
        }
    },
    title: { text: 'Fisher Transform'},     //title
    subtitle: {text: ''},     //subtitle
    plotOptions: {
        candlestick: {
        tooltip: {
            pointFormat:
            '<span style="color:{point.color}">\u25CF</span> <b> {series.name}</b><br/>' +
            'open: {point.open}<br/>' +
            'highest: {point.high}<br/>' +
            'lowest: {point.low}<br/>' +
            'close: {point.close}<br/>'
            }
        }
    },
    yAxis: [{
        title: {
            text: 'K-line market quote'
        },
        height: '70%',
        lineWidth: 1
    }, {
        title: {
            text: 'Fisher Transform'
        },
        top: '75%',
        height: '30%',
        offset: 0,
        lineWidth: 1
    }],
    series: [//series
        {
            type: 'candlestick',
            yAxis: 0,
            name: 'K-line',
            id: 'KLine',
            // control the candlestick color of fall
            color: 'green',
            lineColor: 'green',
            // control the candlestick color of rise
            upColor: 'red',
            upLineColor: 'red',
            data: []
        },{
            type: 'line',         // set the type of the current data series as: line
            yAxis: 1,             // the y axis for use is the y axis with index 0 (in highcharts, there can be multiple y axis, and here it indicates the y axis with index 0)
            showInLegend: true,   //
            name: 'fish',          // set according the parameter label  passed by the function
            lineWidth: 1,
            data: [],             // data item of the data series
            tooltip: {            // tip for tool
                valueDecimals: 2  //  the decimals of the value reserve 5
            }
        },{
            type: 'line',         // set the type of the current data series as: line
            yAxis: 1,             // the y axis for use is the y axis with index 0 (in highcharts, there can be multiple y axis, and here it indicates the y axis with index 0)
            showInLegend: true,   //
            name: 'preFish',      // set according the parameter label  passed by the function
            lineWidth: 1,
            data: [],             // data item of the data series
            tooltip: {            // tip for tool
                valueDecimals: 2  // the decimals of the value reserve 5
            }
        }
    ]
}

var chart = Chart(cfg)
function main() {
    var ts = 0
    chart.reset()
    while (true) {
        var r = exchange.GetRecords()
        var fisher = calcFisher(r, 0.33, 10)
        if (!r || !fisher) {
            Sleep(500)
            continue
        }

        for (var i = 0; i < r.length; i++){
            if (ts == r[i].Time) {
                chart.add([0,[r[i].Time, r[i].Open, r[i].High, r[i].Low, r[i].Close], -1])
                chart.add([1,[r[i].Time, fisher[i]], -1])
                if (i - 1 >= 0) {
                    chart.add([2,[r[i].Time, fisher[i - 1]], -1])
                }
            }else if (ts < r[i].Time) {
                chart.add([0,[r[i].Time, r[i].Open, r[i].High, r[i].Low, r[i].Close]])
                chart.add([1,[r[i].Time, fisher[i]]])
                if (i - 1 >= 0) {
                    chart.add([2,[r[i].Time, fisher[i - 1]]])
                }
                ts = r[i].Time
            }
        }
    }
}
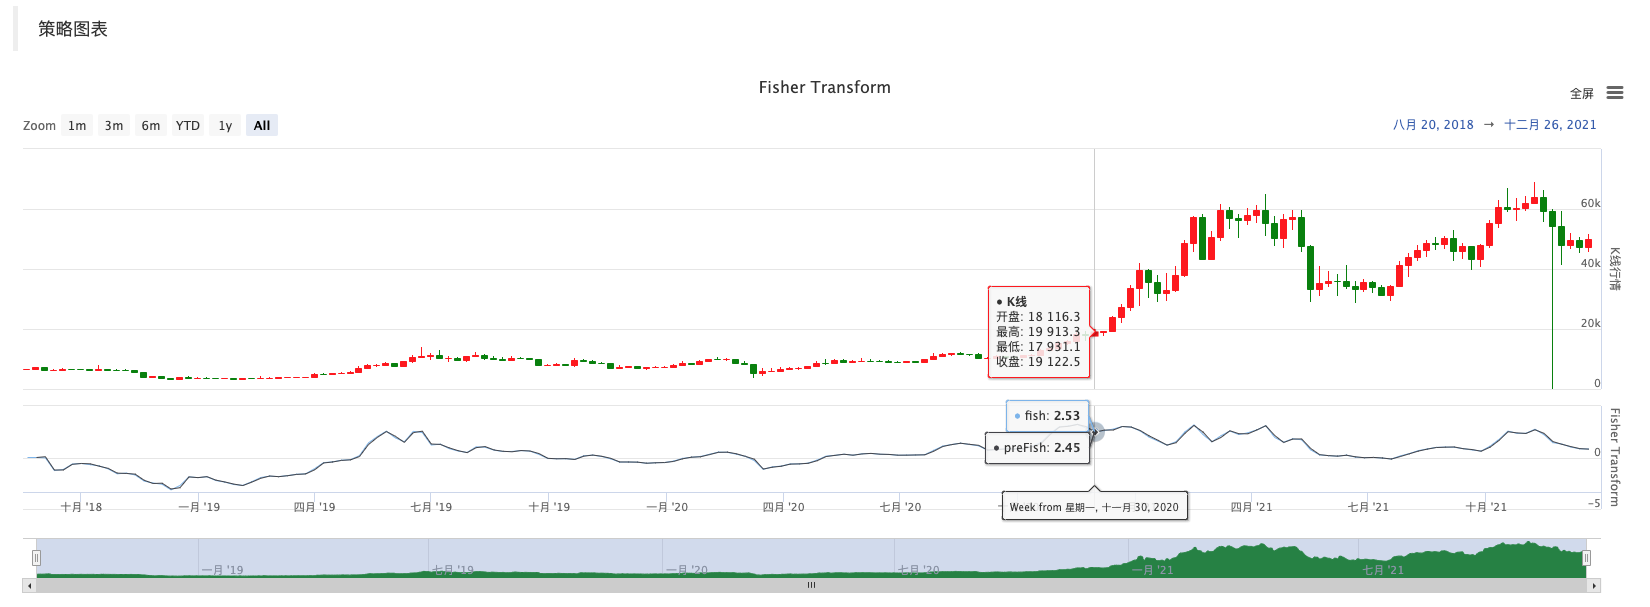
Por lo tanto, es muy conveniente estudiar datos, visualización de gráficos y diseño de estrategias en FMZ. Aquí comienzo la discusión para más ideas, así que bienvenidos maestros y estudiantes aquí para dejar comentarios.
- Contrato de criptomonedas bot de supervisión de órdenes sencillo
- Cuando se quiere obtener el tiempo de entrada correspondiente con getdepth
- Ignorado, resuelto
- El problema del valor facial
- Ejemplo de diseño de estrategia dYdX
- Exploración inicial de la aplicación de Python Crawler en FMZ
Crawling Contenido del anuncio de Binance - Investigación de diseño de estrategias de cobertura y ejemplo de órdenes de spot y futuros pendientes
- Situación reciente y funcionamiento recomendado de la estrategia de tasas de financiación
- Estrategia de punto de quiebre de promedio móvil doble de futuros de criptomonedas (Teaching)
- Estrategia de media móvil doble de símbolos múltiples de criptomoneda al contado (Teaching)
- El administrador
- Revisión del TAQ de criptomonedas 2021 y estrategia perdida más simple de aumento de 10 veces
- Estrategia ART de futuros de criptomonedas de símbolos múltiples (Enseñanza)
- ¡Actualice! Estrategia de futuros de criptomonedas Martingale
- La función Getrecords no puede obtener el gráfico de K en segundos
- Diseño de un sistema de gestión sincrónica basado en órdenes de FMZ (2)
- Los datos de volumen que Getticker ha devuelto no son correctos.
- Diseño de un sistema de gestión sincrónica basado en órdenes FMZ (1)
- Diseñar una biblioteca de gráficos múltiples
- Entorno de disco