Stratégie ART multi-symbole sur les contrats à terme de crypto-monnaie (enseignement)
Auteur:Je suis désolée., Créé à partir de: 2022-04-07 11:09:42, Mis à jour à partir de: 2022-04-07 16:15:14Stratégie ART multi-symbole sur les contrats à terme de crypto-monnaie (enseignement)
Récemment, certains utilisateurs de notre plateforme sont très impatients de porter une stratégie Mylanguage dans une stratégie JavaScript, afin que de nombreuses idées d'optimisation puissent être ajoutées de manière flexible. Ils souhaitent même étendre une stratégie dans une version multi-symbole. Parce que les stratégies Mylanguage sont généralement des stratégies de tendance et que beaucoup sont exécutées dans un modèle de prix proche. Ces stratégies demandent une interface API de plateforme pas très fréquemment, ce qui est plus approprié pour le port dans une version de stratégie multi-symbole. Dans l'article, nous prenons une stratégie Mylanguage simple comme exemple et la portons dans une version simple du langage JavaScript. Le but principal est d'enseigner, de backtest et de recherche.
La stratégie Mylangauge doit être transférée
TR:=MAX(MAX((H-L),ABS(REF(C,1)-H)),ABS(REF(C,1)-L));
ATR:=EMA(TR,LENGTH2);

MIDLINE^^EMA((H + L + C)/3,LENGTH1);
UPBAND^^MIDLINE + N*ATR;
DOWNBAND^^MIDLINE - N*ATR;


BKVOL=0 AND C>=UPBAND AND REF(C,1)<REF(UPBAND,1),BPK;
SKVOL=0 AND C<=DOWNBAND AND REF(C,1)>REF(DOWNBAND,1),SPK;

BKVOL>0 AND C<=MIDLINE,SP(BKVOL);
SKVOL>0 AND C>=MIDLINE,BP(SKVOL);
// stop loss
C>=SKPRICE*(1+SLOSS*0.01),BP;
C<=BKPRICE*(1-SLOSS*0.01),SP;
AUTOFILTER;
La logique de la stratégie est très simple. Tout d'abord, selon les paramètres, calculez l'ATR, puis calculez les valeurs moyennes des prix les plus élevés, les plus bas, les prix de clôture et d'ouverture de tous les BAR de la ligne K, par lesquels l'indicateur EMA sera calculé. Enfin, sur la base de l'ATR et du ratio N dans les paramètres, calculez upBand et downBand.
La position ouverte et la position inversée sont basées sur le prix de clôture traversant la bande ascendante et la bande descendante. Lorsque le prix de clôture atteint la ligne médiane, position close; lorsque le prix de clôture atteint le prix de stop loss, position close (selon SLOSS pour stop loss; lorsque SLOSS est 1, cela signifie 0,01, à savoir 1%). La stratégie est exécutée dans le modèle de prix de clôture.
Après avoir compris les exigences stratégiques et les idées de Mylanguage, nous pouvons commencer à le transporter.
Prototype de stratégie portuaire et de conception
Le code de prototype de stratégie n'est pas trop long, seulement 1 à 200 lignes.
// parse params, from string to object
var arrParam = JSON.parse(params)
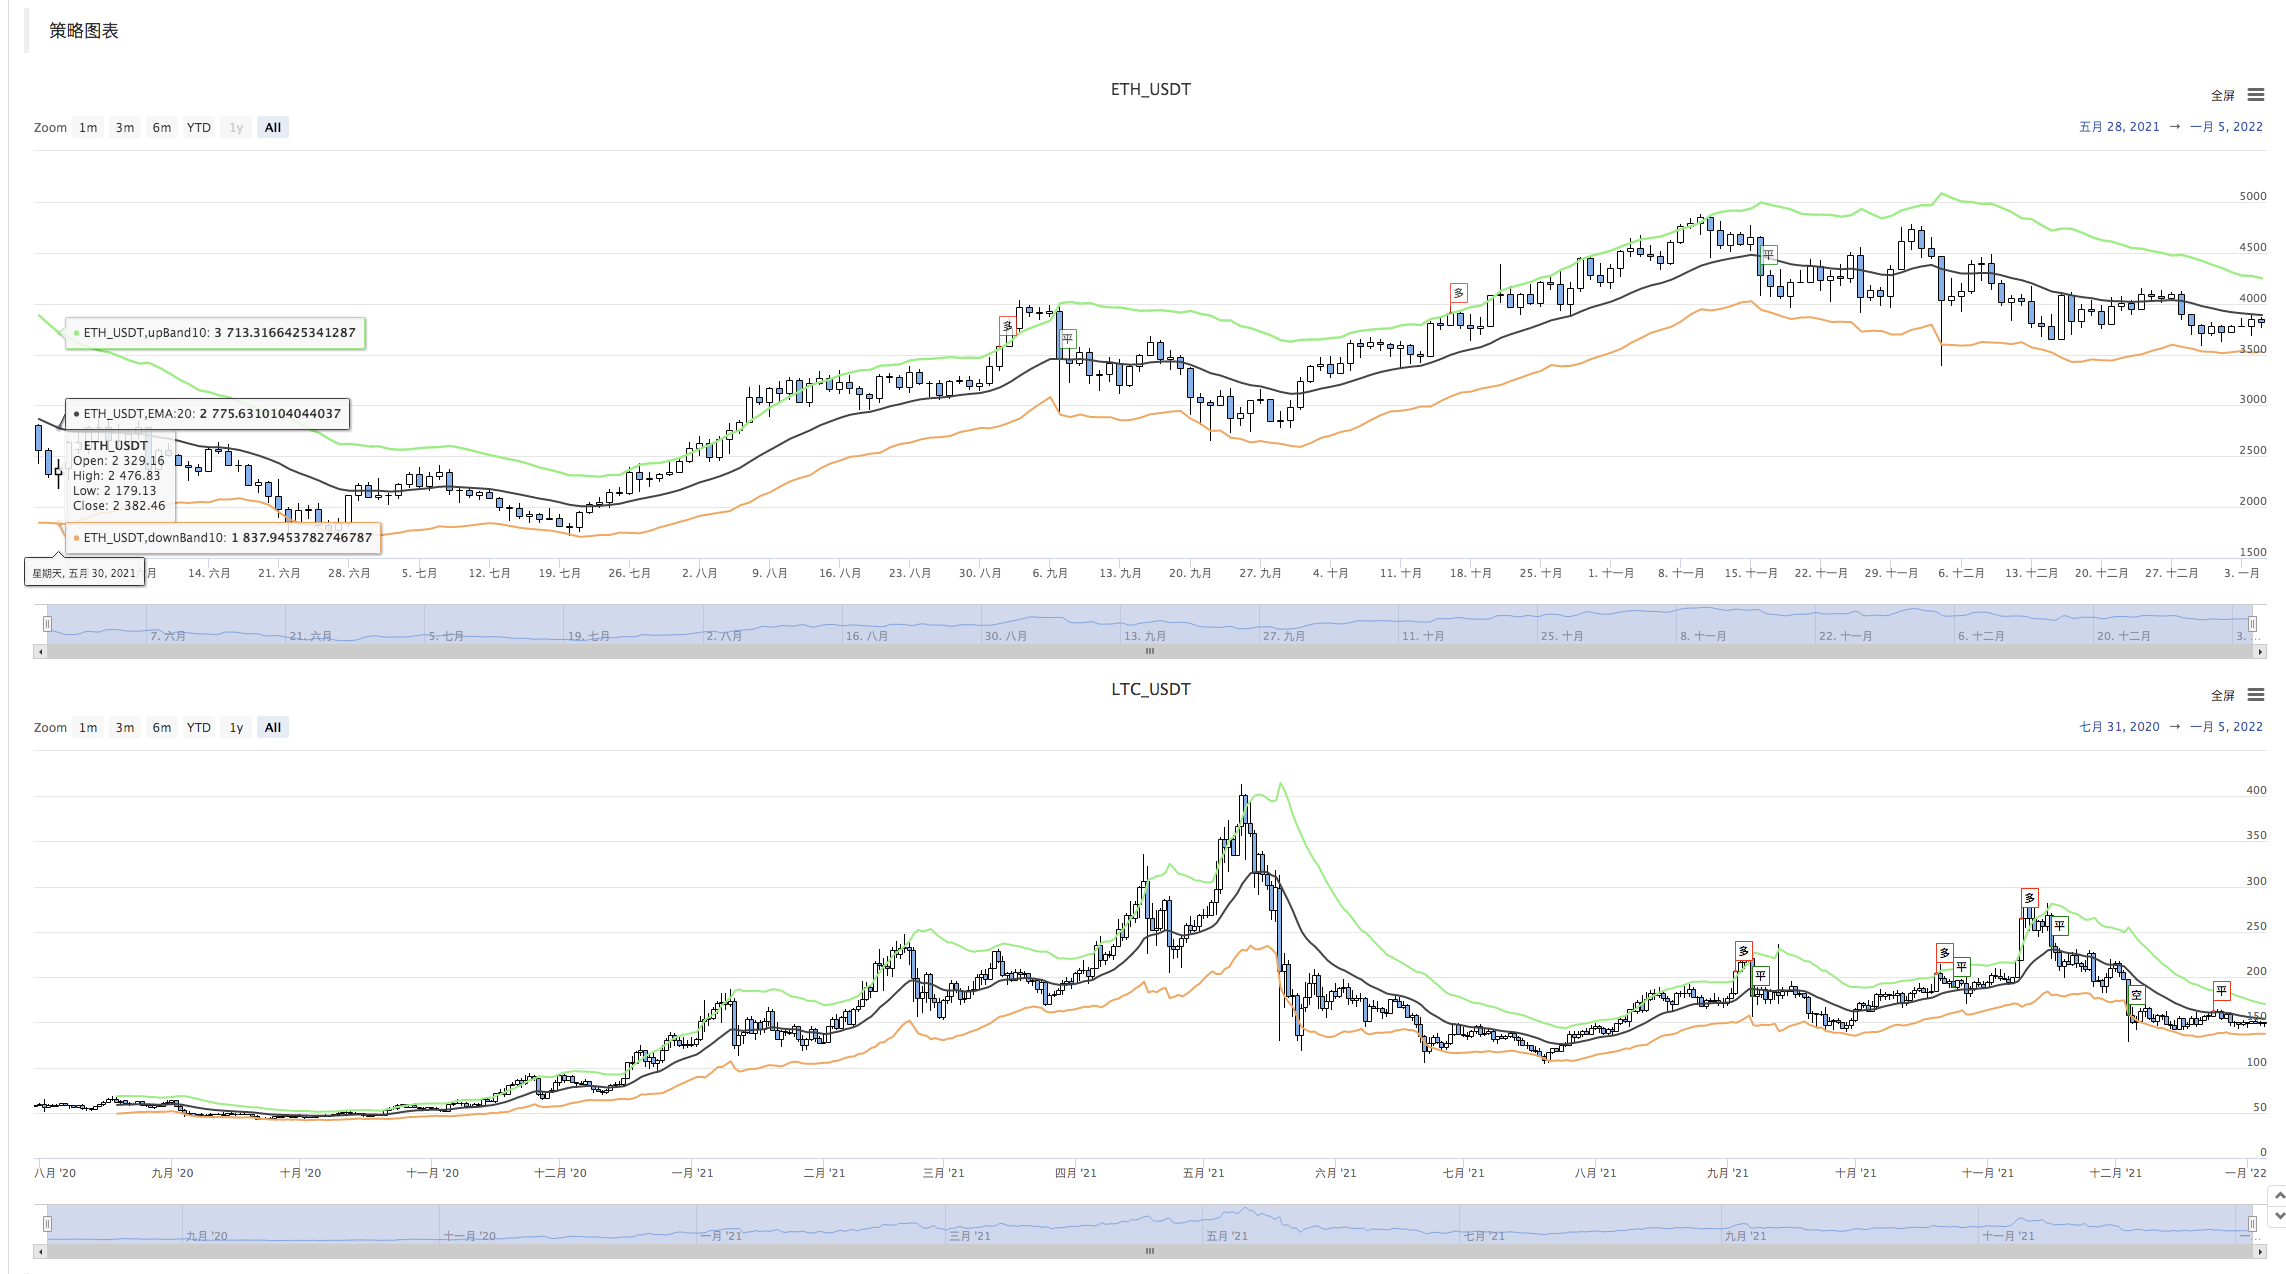
// the function creates the chart configuration
function createChartConfig(symbol, atrPeriod, emaPeriod, index) { // symbol: trading pair; atrPeriod: ATR parameter period; emaPeriod: EMA parameter period; index: index of the corresponding exchange object
var chart = {
__isStock: true,
extension: {
layout: 'single',
height: 600,
},
title : { text : symbol},
xAxis: { type: 'datetime'},
series : [
{
type: 'candlestick', // K-line data series
name: symbol,
id: symbol + "-" + index,
data: []
}, {
type: 'line', // EMA
name: symbol + ',EMA:' + emaPeriod,
data: [],
}, {
type: 'line', // upBand
name: symbol + ',upBand' + atrPeriod,
data: []
}, {
type: 'line', // downBand
name: symbol + ',downBand' + atrPeriod,
data: []
}, {
type: 'flags',
onSeries: symbol + "-" + index,
data: [],
}
]
}
return chart
}
// main logic
function process(e, kIndex, c) { // e is the exchange object, such as exchanges[0] ... ; kIndex is the data series of K-line data in the chart; c is the chart object
// obtain K-line data
var r = e.GetRecords(e.param.period)
if (!r || r.length < e.param.atrPeriod + 2 || r.length < e.param.emaPeriod + 2) {
// if K-line data length is insufficient, return
return
}
// calculate ATR indicator
var atr = TA.ATR(r, e.param.atrPeriod)
var arrAvgPrice = []
_.each(r, function(bar) {
arrAvgPrice.push((bar.High + bar.Low + bar.Close) / 3)
})
// calculate EMA indicator
var midLine = TA.EMA(arrAvgPrice, e.param.emaPeriod)
// calculate upBand and downBand
var upBand = []
var downBand = []
_.each(midLine, function(mid, index) {
if (index < e.param.emaPeriod - 1 || index < e.param.atrPeriod - 1) {
upBand.push(NaN)
downBand.push(NaN)
return
}
upBand.push(mid + e.param.trackRatio * atr[index])
downBand.push(mid - e.param.trackRatio * atr[index])
})
// plot
for (var i = 0 ; i < r.length ; i++) {
if (r[i].Time == e.state.lastBarTime) {
// update
c.add(kIndex, [r[i].Time, r[i].Open, r[i].High, r[i].Low, r[i].Close], -1)
c.add(kIndex + 1, [r[i].Time, midLine[i]], -1)
c.add(kIndex + 2, [r[i].Time, upBand[i]], -1)
c.add(kIndex + 3, [r[i].Time, downBand[i]], -1)
} else if (r[i].Time > e.state.lastBarTime) {
// add
e.state.lastBarTime = r[i].Time
c.add(kIndex, [r[i].Time, r[i].Open, r[i].High, r[i].Low, r[i].Close])
c.add(kIndex + 1, [r[i].Time, midLine[i]])
c.add(kIndex + 2, [r[i].Time, upBand[i]])
c.add(kIndex + 3, [r[i].Time, downBand[i]])
}
}
// detect position
var pos = e.GetPosition()
if (!pos) {
return
}
var holdAmount = 0
var holdPrice = 0
if (pos.length > 1) {
throw "Long and short positions are detected simultaneously!"
} else if (pos.length != 0) {
holdAmount = pos[0].Type == PD_LONG ? pos[0].Amount : -pos[0].Amount
holdPrice = pos[0].Price
}
if (e.state.preBar == -1) {
e.state.preBar = r[r.length - 1].Time
}
// detect signal
if (e.state.preBar != r[r.length - 1].Time) { // close price model
if (holdAmount <= 0 && r[r.length - 3].Close < upBand[upBand.length - 3] && r[r.length - 2].Close > upBand[upBand.length - 2]) { // close price up cross the upBand
if (holdAmount < 0) { // holding short, close position
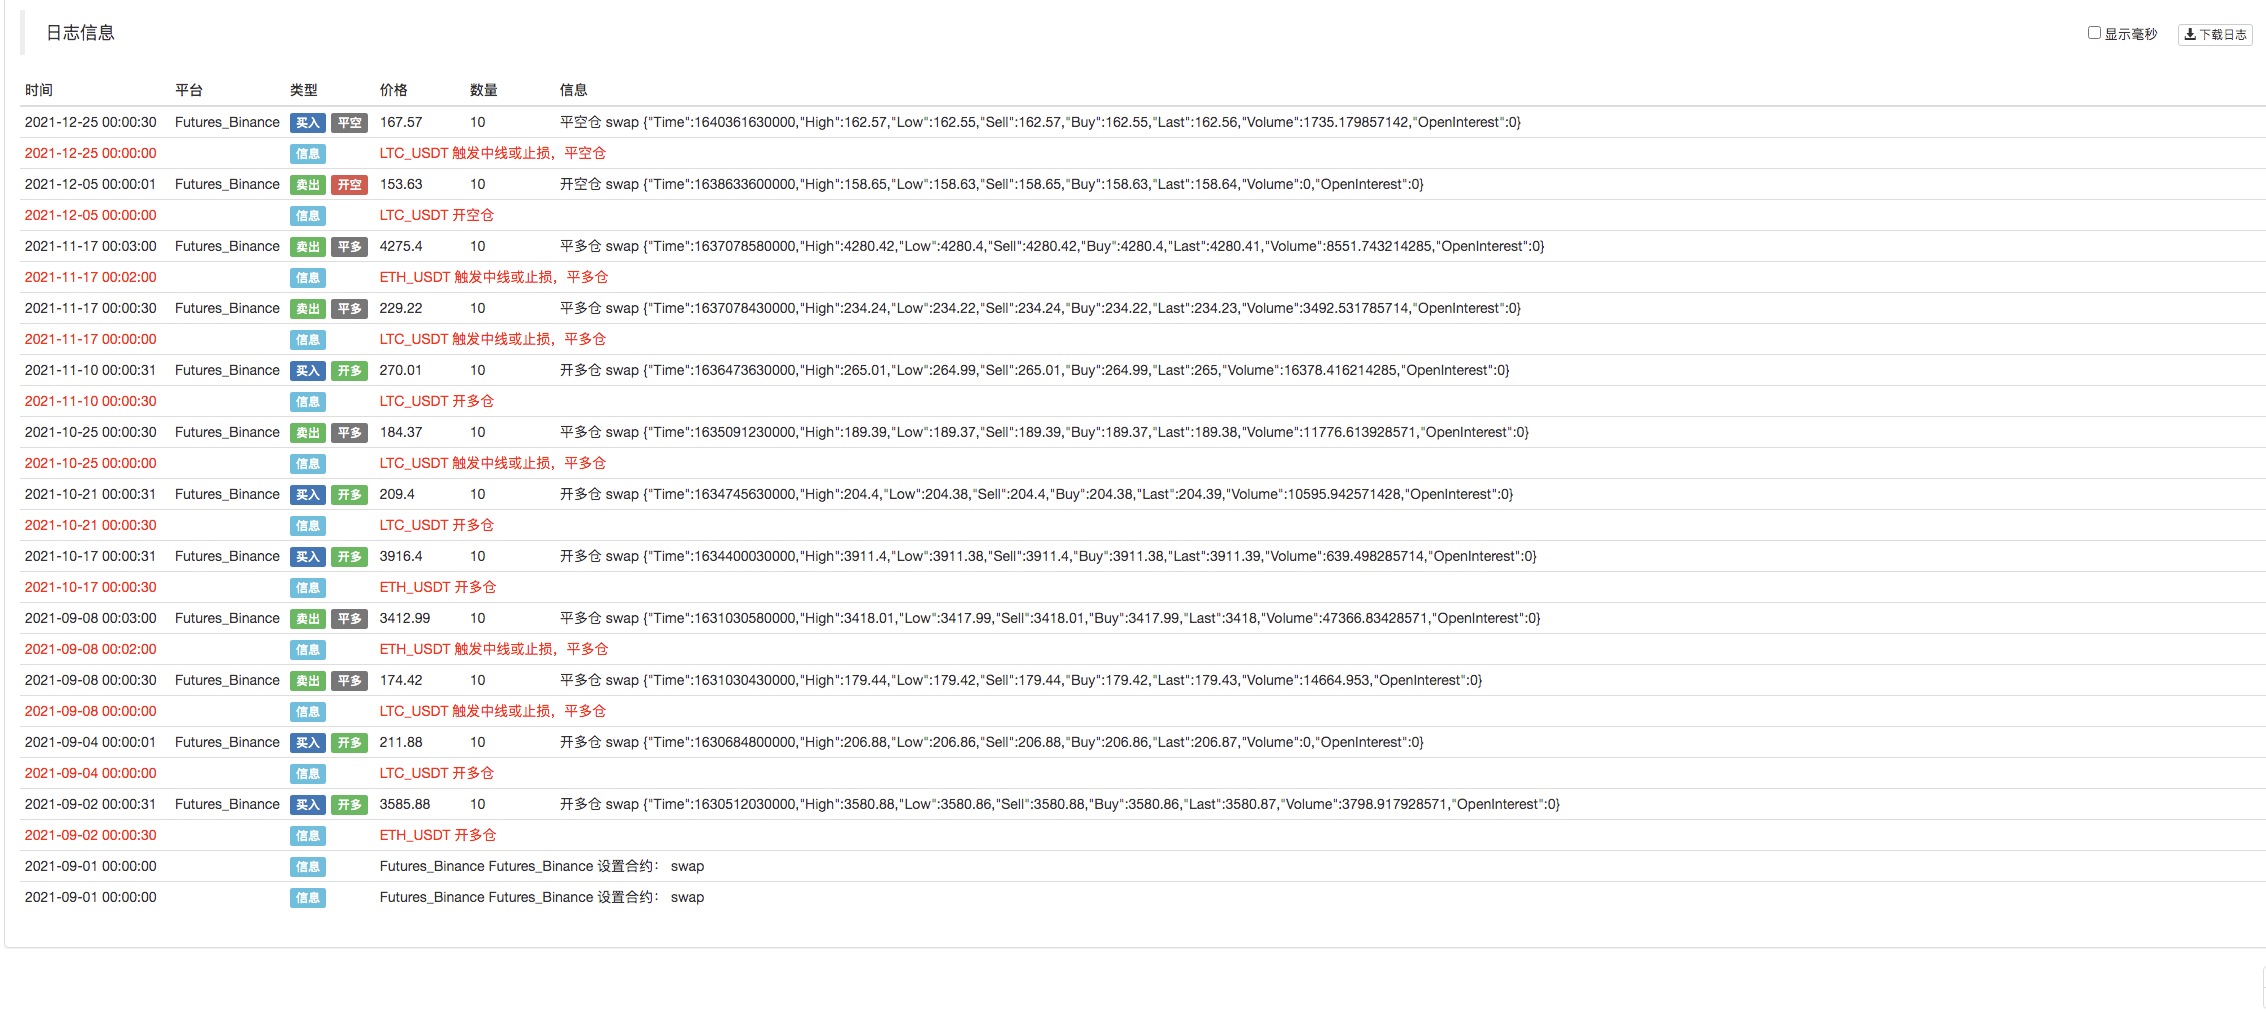
Log(e.GetCurrency(), "close short position", "#FF0000")
$.CoverShort(e, e.param.symbol, Math.abs(holdAmount))
c.add(kIndex + 4, {x: r[r.length - 2].Time, color: 'red', shape: 'flag', title: 'close', text: "close short position"})
}
// open long
Log(e.GetCurrency(), "open long position", "#FF0000")
$.OpenLong(e, e.param.symbol, 10)
c.add(kIndex + 4, {x: r[r.length - 2].Time, color: 'red', shape: 'flag', title: 'long', text: "open long position"})
} else if (holdAmount >= 0 && r[r.length - 3].Close > downBand[downBand.length - 3] && r[r.length - 2].Close < downBand[downBand.length - 2]) { // close price down cross the downBand
if (holdAmount > 0) { // holding long, close position
Log(e.GetCurrency(), "close long position", "#FF0000")
$.CoverLong(e, e.param.symbol, Math.abs(holdAmount))
c.add(kIndex + 4, {x: r[r.length - 2].Time, color: 'green', shape: 'flag', title: 'close', text: "close long position"})
}
// open short
Log(e.GetCurrency(), "open short position", "#FF0000")
$.OpenShort(e, e.param.symbol, 10)
c.add(kIndex + 4, {x: r[r.length - 2].Time, color: 'green', shape: 'flag', title: 'short', text: "open short position"})
} else {
// close position
if (holdAmount > 0 && (r[r.length - 2].Close <= holdPrice * (1 - e.param.stopLoss) || r[r.length - 2].Close <= midLine[midLine.length - 2])) { // if holding long position, close price is equal to or less than midline, stop loss according to open position price
Log(e.GetCurrency(), "if midline is triggered or stop loss, close long position", "#FF0000")
$.CoverLong(e, e.param.symbol, Math.abs(holdAmount))
c.add(kIndex + 4, {x: r[r.length - 2].Time, color: 'green', shape: 'flag', title: 'close', text: "close long position"})
} else if (holdAmount < 0 && (r[r.length - 2].Close >= holdPrice * (1 + e.param.stopLoss) || r[r.length - 2].Close >= midLine[midLine.length - 2])) { // if holding short position, close price is equal to or more than midline, stop loss according to open position price
Log(e.GetCurrency(), "if midline is triggered or stop loss, close short position", "#FF0000")
$.CoverShort(e, e.param.symbol, Math.abs(holdAmount))
c.add(kIndex + 4, {x: r[r.length - 2].Time, color: 'red', shape: 'flag', title: 'close', text: "close short position"})
}
}
e.state.preBar = r[r.length - 1].Time
}
}
function main() {
var arrChartConfig = []
if (arrParam.length != exchanges.length) {
throw "The parameter and the exchange object do not match!"
}
var arrState = _G("arrState")
_.each(exchanges, function(e, index) {
if (e.GetName() != "Futures_Binance") {
throw "The platform is not supported!"
}
e.param = arrParam[index]
e.state = {lastBarTime: 0, symbol: e.param.symbol, currency: e.GetCurrency()}
if (arrState) {
if (arrState[index].symbol == e.param.symbol && arrState[index].currency == e.GetCurrency()) {
Log("Recover:", e.state)
e.state = arrState[index]
} else {
throw "The recovered data and the current setting do not match!"
}
}
e.state.preBar = -1 // initially set -1
e.SetContractType(e.param.symbol)
Log(e.GetName(), e.GetLabel(), "Set contract:", e.param.symbol)
arrChartConfig.push(createChartConfig(e.GetCurrency(), e.param.atrPeriod, e.param.emaPeriod, index))
})
var chart = Chart(arrChartConfig)
chart.reset()
while (true) {
_.each(exchanges, function(e, index) {
process(e, index + index * 4, chart)
Sleep(500)
})
}
}
function onexit() {
// record e.state
var arrState = []
_.each(exchanges, function(e) {
arrState.push(e.state)
})
Log("Record:", arrState)
_G("arrState", arrState)
}
Paramètres de stratégie:
var params = '[{
        "symbol" : "swap",    // contract code
        "period" : 86400,     // K-line period; 86400 seconds indicates 1 day
        "stopLoss" : 0.07,    // ratio of stoploss; 0.07 means 7%
        "atrPeriod" : 10,     // ATR indicator parameter
        "emaPeriod" : 10,     // EMA indicator parameter
        "trackRatio" : 1,     // ratio of upBand or downBand
        "openRatio" : 0.1     // ratio of reserved open position (temporarily not supported)
    }, {
        "symbol" : "swap",
        "period" : 86400,
        "stopLoss" : 0.07,
        "atrPeriod" : 10,
        "emaPeriod" : 10,
        "trackRatio" : 1,
        "openRatio" : 0.1
    }]'
Test de retour
Le code source de la stratégie:https://www.fmz.com/strategy/339344
La stratégie n'est utilisée que pour la communication et l'étude; pour l'utilisation pratique, vous devez la modifier, l'ajuster et l'optimiser vous-même.
- Le problème de la valeur
- Exemple de conception de stratégie dYdX
- Exploration initiale de l'application de Python Crawler sur FMZ
Crawling Contenu de l'annonce de Binance - Définition de la stratégie de couverture Recherche et exemple d'ordres en attente au comptant et à terme
- Situation récente et fonctionnement recommandé de la stratégie de taux de financement
- Stratégie de point de rupture à moyenne mobile double des contrats à terme sur crypto-monnaie (enseignement)
- Stratégie des moyennes mobiles doubles multi-symbole de crypto-monnaie (enseignement)
- Réalisation de l'indicateur Fisher en JavaScript et de la planification sur FMZ
- Le gérant
- 2021 Cryptocurrency TAQ Review & Stratégie manquée la plus simple d'augmentation de 10 fois
- Mise à niveau! Stratégie de Martingale sur les contrats à terme de crypto-monnaie
- La fonction Getrecords n'arrive pas à récupérer le schéma de K en secondes
- Conception d'un système de gestion synchrone basé sur les ordres FMZ (2)
- Les données de volume retournées par Getticker sont incorrectes.
- Conception d'un système de gestion synchrone basé sur les ordres FMZ (1)
- Concevoir une bibliothèque de tracés à plusieurs graphiques
- Environnement de disque
- Code de 60 lignes réalisant une pensée - Pêche au fond du contrat
- Annonce de mise à niveau et d'ajustement du système de facturation FMZ
- Avis pour les stratégies de rédaction fantôme sur FMZ