Réalisation de l'indicateur Fisher en JavaScript et de la planification sur FMZ
Auteur:Je suis désolée., Créé: 2022-04-07 16:04:22, mis à jour:Réalisation de l'indicateur Fisher en JavaScript et de la planification sur FMZ
Au cours de l'analyse technique dans le commerce, les traders prennent tous les données de prix des actions comme des données normalement distribuées à analyser et à étudier.Fisher Transformationest une méthode qui peut transformer les données de prix en quelque chose de similaire à une distribution normale.Fisher TransformationLes signaux de négociation peuvent être envoyés à l'aide de l'intercalage des indicateurs d'aujourd'hui et des indicateurs des jours précédents.
Il y a tellement de références à propos deFisher Transformationsur Baidu et Zhihu, ce qui ne sera pas expliqué ici en détail.
Algoritme de l'indicateur:
-
Le prix médian aujourd'hui:
mid=(low + high) / 2 -
Confirmer la période de calcul; vous pouvez utiliser 10 jours par période. Calculer le prix le plus élevé et le prix le plus bas de la période:
lowestLow = the lowest price in the period,highestHigh = the highest price in the period. -
Définir le paramètre de variation des prix (dans lequel
ratioest une constante de 0 à 1; par exemple, vous pouvez choisir 0,5 ou 0.33):(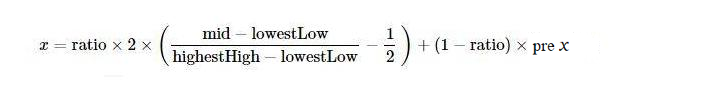
-
Appliquer
Fishertransformation au paramètre de variation de prixx, et leFisherl'indicateur peut être obtenu: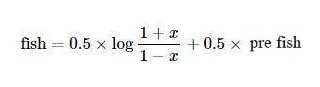
Utilisez JavaScript pour réaliser l'algorithme
Selon l'algorithme de l'indicateur, réalisez-le étape par étape.preX, preFish, ils sont initialement définis à 0.Math.logest le logarithme basé sur la constante naturelle e En outre, la modification de x n'est pas mentionnée dans l'algorithme ci-dessus, et j'ai presque ignoré ce problème lors de l'écriture:
Modifier la valeur de x; si la valeur est supérieure à 0,99, définir de force à 0,999; si elle est inférieure à -0,99, définir à -0,999.
        if (x > 0.99) {
            x = 0.999
        } else if (x < -0.99) {
            x = -0.999
        }
C'est la première fois que je vois l'algorithme et l'indicateur, après l'avoir porté selon l'algorithme. Je n'ai pas vérifié l'implémentation, et les étudiants intéressés par la recherche peuvent vérifier s'il y a des erreurs. Merci beaucoup de souligner les erreurs, s'il y en a.
Code source deFisher Transformalgorithme de l'indicateur:
function getHighest(arr, period) {
    if (arr.length == 0 || arr.length - period < 0) {
        return null
    }
    var beginIndex = arr.length - period
    var ret = arr[beginIndex].High
    for (var i = 0 ; i < arr.length - 1 ; i++) {
        if (arr[i + 1].High > ret) {
            ret = arr[i + 1].High
        }
    }
    return ret
}

function getLowest(arr, period) {
    if (arr.length == 0 || arr.length - period < 0) {
        return null
    }
    var beginIndex = arr.length - period
    var ret = arr[beginIndex].Low
    for (var i = 0 ; i < arr.length - 1 ; i++) {
        if (arr[i + 1].Low < ret) {
            ret = arr[i + 1].Low
        }
    }
    return ret
}

function calcFisher(records, ratio, period) {
    var preFish = 0
    var preX = 0
    var arrFish = []
    // when the K-line length is not long enough to meet the K-line period
    if (records.length < period) {
        for (var i = 0 ; i < records.length ; i++) {
            arrFish.push(0)
        }
        return arrFish
    }

    // traverse K-lines
    for (var i = 0 ; i < records.length ; i++) {
        var fish = 0
        var x = 0
        var bar = records[i]
        var mid = (bar.High + bar.Low) / 2
        // when the current BAR is not enough for period to calculate
        if (i < period - 1) {
            fish = 0
            preFish = 0
            arrFish.push(fish)
            continue
        }

        // calculate the highest price and the lowest price in the period
        var bars = []
        for (var j = 0 ; j <= i ; j++) {
            bars.push(records[j])
        }
        var lowestLow = getLowest(bars, period)
        var highestHigh = getHighest(bars, period)

        // price change parameter x
        x = ratio * 2 * ((mid - lowestLow) / (highestHigh - lowestLow) - 0.5) + (1 - ratio) * preX
        if (x > 0.99) {
            x = 0.999
        } else if (x < -0.99) {
            x = -0.999
        }
        preX = x
        fish = 0.5 * Math.log((1 + x) / (1 - x)) + 0.5 * preFish
        preFish = fish
        arrFish.push(fish)
    }
    return arrFish
}
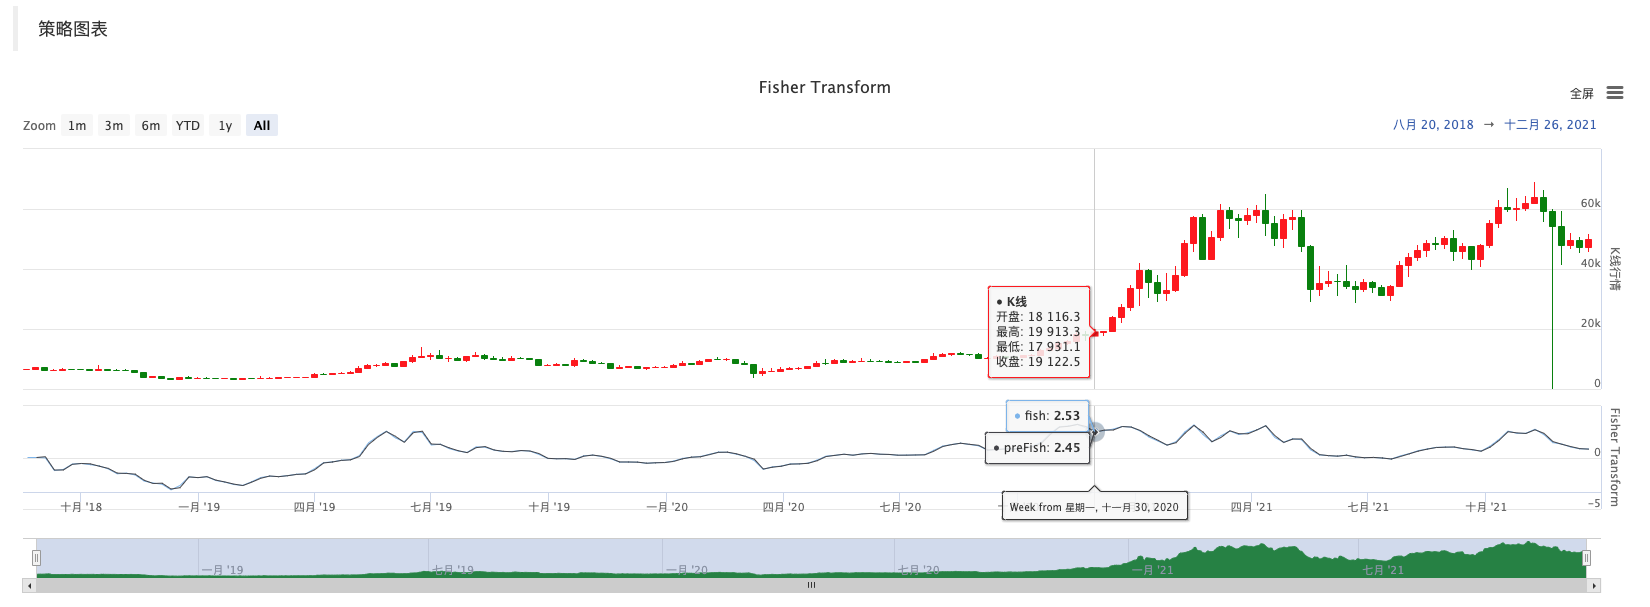
Le scénario
Il est très facile de tracer sur FMZ; vous pouvez vous référer à beaucoup d'exemples dans le carré de stratégie:https://www.fmz.com/square, et vous pouvez également rechercher les stratégies dont vous avez besoin.
var cfg = {    // used to initially configure the chart objects (namely chart settings)
    plotOptions: {
        candlestick: {
            color: '#d75442',  // color value
            upColor: '#6ba583' // color vlaue
        }
    },
    title: { text: 'Fisher Transform'},     //title
    subtitle: {text: ''},     //subtitle
    plotOptions: {
        candlestick: {
        tooltip: {
            pointFormat:
            '<span style="color:{point.color}">\u25CF</span> <b> {series.name}</b><br/>' +
            'open: {point.open}<br/>' +
            'highest: {point.high}<br/>' +
            'lowest: {point.low}<br/>' +
            'close: {point.close}<br/>'
            }
        }
    },
    yAxis: [{
        title: {
            text: 'K-line market quote'
        },
        height: '70%',
        lineWidth: 1
    }, {
        title: {
            text: 'Fisher Transform'
        },
        top: '75%',
        height: '30%',
        offset: 0,
        lineWidth: 1
    }],
    series: [//series
        {
            type: 'candlestick',
            yAxis: 0,
            name: 'K-line',
            id: 'KLine',
            // control the candlestick color of fall
            color: 'green',
            lineColor: 'green',
            // control the candlestick color of rise
            upColor: 'red',
            upLineColor: 'red',
            data: []
        },{
            type: 'line',         // set the type of the current data series as: line
            yAxis: 1,             // the y axis for use is the y axis with index 0 (in highcharts, there can be multiple y axis, and here it indicates the y axis with index 0)
            showInLegend: true,   //
            name: 'fish',          // set according the parameter label  passed by the function
            lineWidth: 1,
            data: [],             // data item of the data series
            tooltip: {            // tip for tool
                valueDecimals: 2  //  the decimals of the value reserve 5
            }
        },{
            type: 'line',         // set the type of the current data series as: line
            yAxis: 1,             // the y axis for use is the y axis with index 0 (in highcharts, there can be multiple y axis, and here it indicates the y axis with index 0)
            showInLegend: true,   //
            name: 'preFish',      // set according the parameter label  passed by the function
            lineWidth: 1,
            data: [],             // data item of the data series
            tooltip: {            // tip for tool
                valueDecimals: 2  // the decimals of the value reserve 5
            }
        }
    ]
}

var chart = Chart(cfg)
function main() {
    var ts = 0
    chart.reset()
    while (true) {
        var r = exchange.GetRecords()
        var fisher = calcFisher(r, 0.33, 10)
        if (!r || !fisher) {
            Sleep(500)
            continue
        }

        for (var i = 0; i < r.length; i++){
            if (ts == r[i].Time) {
                chart.add([0,[r[i].Time, r[i].Open, r[i].High, r[i].Low, r[i].Close], -1])
                chart.add([1,[r[i].Time, fisher[i]], -1])
                if (i - 1 >= 0) {
                    chart.add([2,[r[i].Time, fisher[i - 1]], -1])
                }
            }else if (ts < r[i].Time) {
                chart.add([0,[r[i].Time, r[i].Open, r[i].High, r[i].Low, r[i].Close]])
                chart.add([1,[r[i].Time, fisher[i]]])
                if (i - 1 >= 0) {
                    chart.add([2,[r[i].Time, fisher[i - 1]]])
                }
                ts = r[i].Time
            }
        }
    }
}
Par conséquent, il est très pratique d'étudier les données, l'affichage des graphiques et la conception de la stratégie sur FMZ. Ici, je commence la discussion pour plus d'idées, alors bienvenue aux enseignants et aux étudiants ici pour laisser des commentaires.
- Contrats de crypto-monnaie Robot simple de supervision des ordres
- Vous voulez obtenir le temps correspondant lorsque vous utilisez getdepth
- Ignoré, résolu
- Le problème de la valeur
- Exemple de conception de stratégie dYdX
- Exploration initiale de l'application de Python Crawler sur FMZ
Crawling Contenu de l'annonce de Binance - Définition de la stratégie de couverture Recherche et exemple d'ordres en attente au comptant et à terme
- Situation récente et fonctionnement recommandé de la stratégie de taux de financement
- Stratégie de point de rupture à moyenne mobile double des contrats à terme sur crypto-monnaie (enseignement)
- Stratégie des moyennes mobiles doubles multi-symbole de crypto-monnaie (enseignement)
- Le gérant
- 2021 Cryptocurrency TAQ Review & Stratégie manquée la plus simple d'augmentation de 10 fois
- Stratégie ART multi-symbole sur les contrats à terme de crypto-monnaie (enseignement)
- Mise à niveau! Stratégie de Martingale sur les contrats à terme de crypto-monnaie
- La fonction Getrecords n'arrive pas à récupérer le schéma de K en secondes
- Conception d'un système de gestion synchrone basé sur les ordres FMZ (2)
- Les données de volume retournées par Getticker sont incorrectes.
- Conception d'un système de gestion synchrone basé sur les ordres FMZ (1)
- Concevoir une bibliothèque de tracés à plusieurs graphiques
- Environnement de disque