SAR parabolique
Auteur:ChaoZhang est là., Date: le 31 mai 2022 à 19h01Les étiquettes:SAR
C'est une refonte de l'indicateur SAR Parabolique intégré. J'ai ajouté un système d'entrée approprié, une option pour mettre en évidence les points initiaux pour les deux lignes et une option pour choisir la largeur des points.
Le SAR parabolique a été développé à l'origine par J. Welles Wilder et décrit dans son livre
Pour savoir quels paramètres pour le PSAR sont les plus rentables sur votre instrument et le délai, vous pouvez utiliser cet outil
test de retour
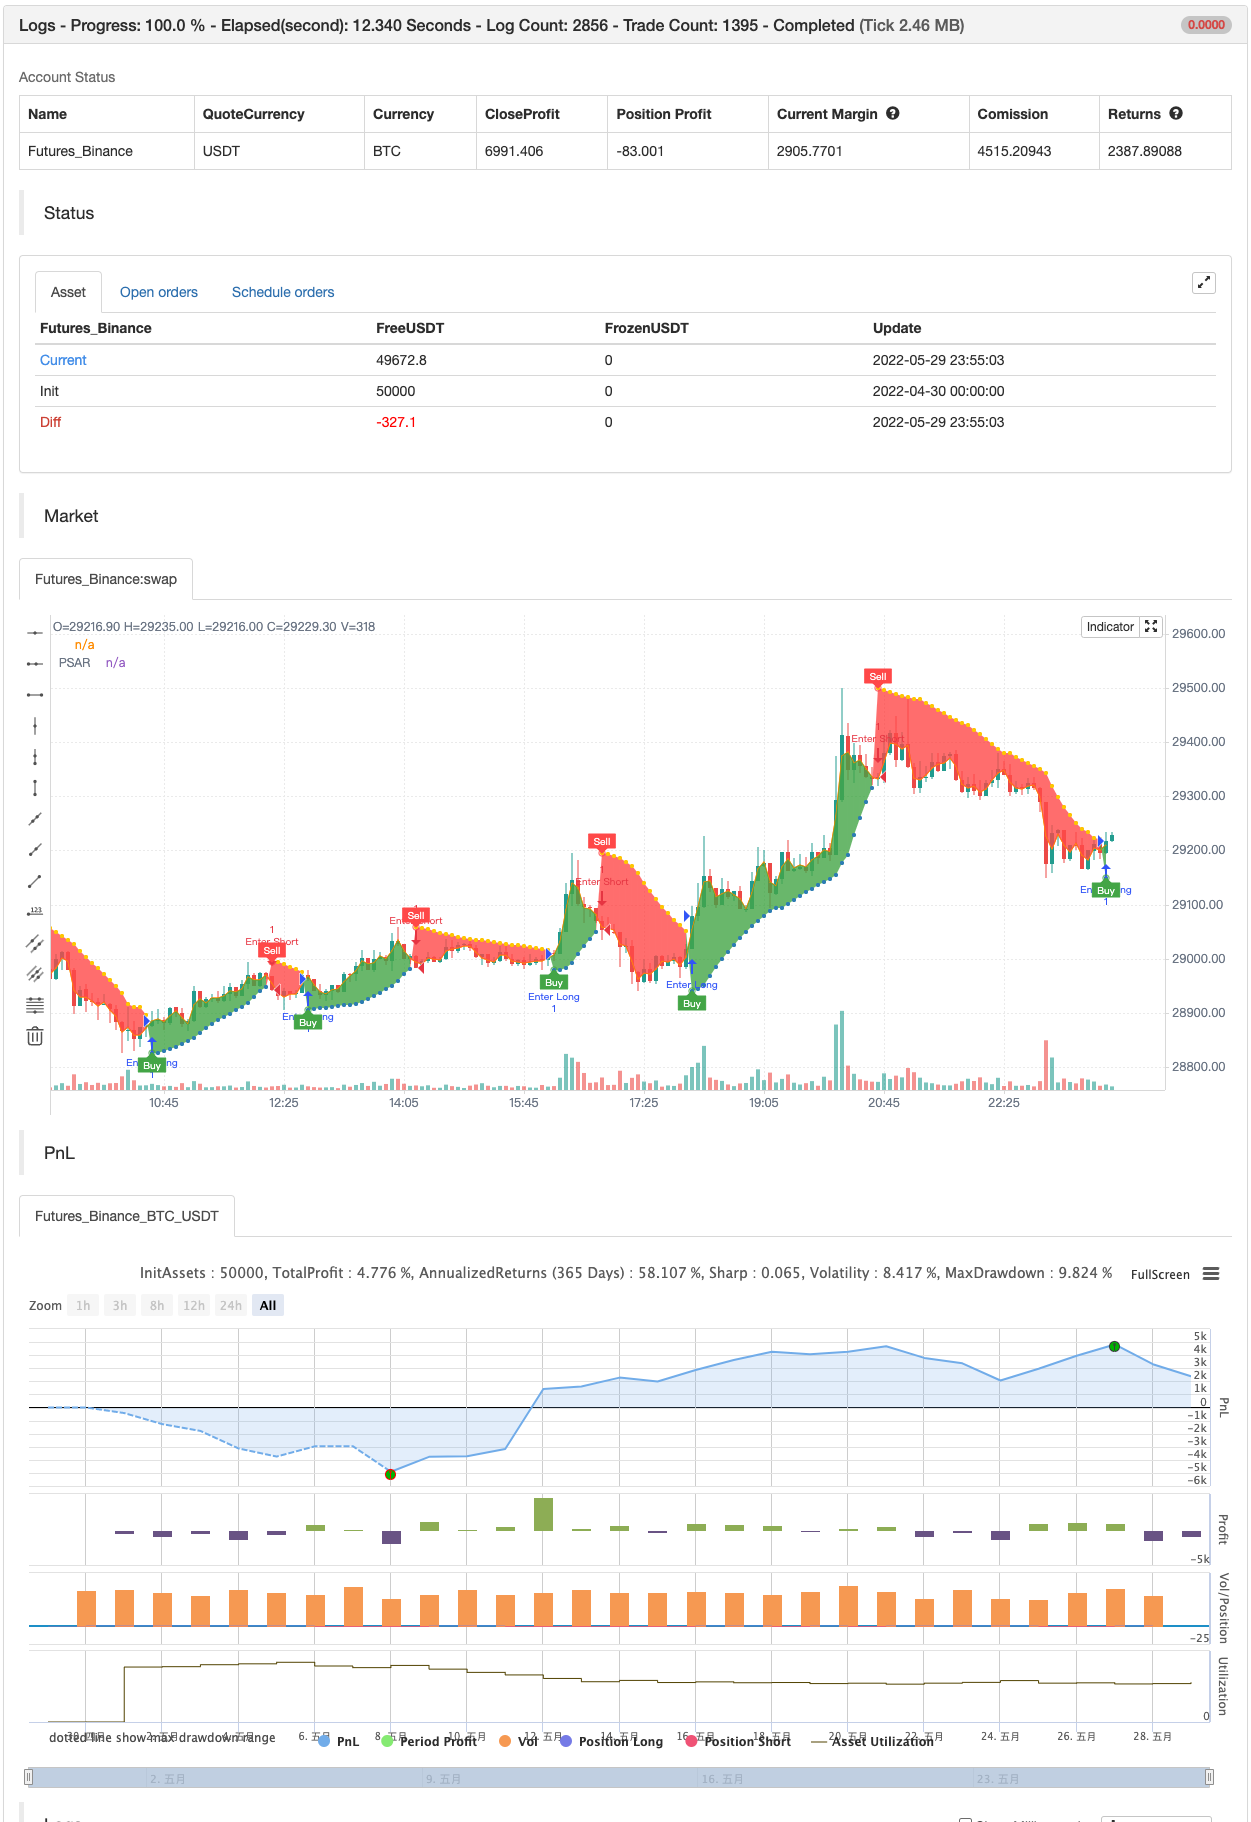
/*backtest
start: 2022-04-30 00:00:00
end: 2022-05-29 23:59:00
period: 5m
basePeriod: 1m
exchanges: [{"eid":"Futures_Binance","currency":"BTC_USDT"}]
*/

//@version=4
// Copyright (c) 2019-present, Alex Orekhov (everget)
// Parabolic SAR script may be freely distributed under the terms of the GPL-3.0 license.
study("Parabolic SAR", shorttitle="PSAR", overlay=true)

start = input(title="Start", type=input.float, step=0.001, defval=0.02)
increment = input(title="Increment", type=input.float, step=0.001, defval=0.02)
maximum = input(title="Maximum", type=input.float, step=0.01, defval=0.2)
width = input(title="Point Width", type=input.integer, minval=1, defval=2)
highlightStartPoints = input(title="Highlight Start Points ?", type=input.bool, defval=true)
showLabels = input(title="Show Buy/Sell Labels ?", type=input.bool, defval=true)
highlightState = input(title="Highlight State ?", type=input.bool, defval=true)

psar = sar(start, increment, maximum)
dir = psar < close ? 1 : -1

psarColor = dir == 1 ? #3388bb : #fdcc02
psarPlot = plot(psar, title="PSAR", style=plot.style_circles, linewidth=width, color=psarColor, transp=0)

var color longColor = color.green
var color shortColor = color.red

buySignal = dir == 1 and dir[1] == -1
plotshape(buySignal and highlightStartPoints ? psar : na, title="Long Start", location=location.absolute, style=shape.circle, size=size.tiny, color=longColor, transp=0)
plotshape(buySignal and showLabels ? psar : na, title="Buy Label", text="Buy", location=location.absolute, style=shape.labelup, size=size.tiny, color=longColor, textcolor=color.white, transp=0)

sellSignal = dir == -1 and dir[1] == 1
plotshape(sellSignal and highlightStartPoints ? psar : na, title="Short Start", location=location.absolute, style=shape.circle, size=size.tiny, color=shortColor, transp=0)
plotshape(sellSignal and showLabels ? psar : na, title="Sell Label", text="Sell", location=location.absolute, style=shape.labeldown, size=size.tiny, color=shortColor, textcolor=color.white, transp=0)

midPricePlot = plot(ohlc4, title="", display=display.none)

fillColor = highlightState ? (dir == 1 ? longColor : shortColor) : na
fill(midPricePlot, psarPlot, title="Trade State Filling", color=fillColor)

changeCond = dir != dir[1]
alertcondition(changeCond, title="Alert: PSAR Direction Change", message="PSAR has changed direction!")
alertcondition(buySignal, title="Alert: PSAR Long", message="PSAR Long")
alertcondition(sellSignal, title="Alert: PSAR Short", message="PSAR Sell")


if buySignal
    strategy.entry("Enter Long", strategy.long)
else if sellSignal
    strategy.entry("Enter Short", strategy.short)
Relationnée
- Théorie des ondes d'Elliott 4-9 Détection automatique des ondes d'impulsion Stratégie de trading
- SAR - haut et bas
- SAR élevé SAR bas
- SAR parabolique acheter et vendre
- 15 minutes BTCUSDTPERP BOT
Plus de
- Les données de référence doivent être fournies à l'autorité compétente de l'État membre où le véhicule est situé.
- Filtre à double portée
- SAR - haut et bas
- Système de négociation de swing précis
- Tendance linéaire
- Modèle de synchronisation de Fibonacci
- Boîte Darvas acheter vendre
- Indicateur de configuration de démarrage
- Indice de change stochastique extrême
- Indicateur MACD BB V 1,00
- Indicateur de divergence RSI
- Indicateur OBV MACD
- Tendance de pivot
- Stratégie de divergence des prix v1.0
- Dépassement du support-résistance
- Moyenne mobile adaptative de pente
- Stratégie de l'oscillateur Delta-RSI
- Stratégie de cryptographie à faible balayage
- [blackcat] L2 stratégie de renversement des étiquettes
- SuperB