पैराबोलिक एसएआर
लेखक:चाओझांग, दिनांकः 2022-05-31 19:01:00टैगःएसएआर
यह अंतर्निहित पैराबोलिक SAR संकेतक का एक नया डिजाइन है. मैंने एक उचित इनपुट प्रणाली जोड़ी, दोनों लाइनों के लिए प्रारंभिक बिंदुओं को हाइलाइट करने का विकल्प और बिंदु चौड़ाई चुनने का विकल्प. तो, इसे अनुकूलित करें जैसा आप चाहते हैं.
पैराबोलिक एसएआर को मूल रूप से जे. वेल्स वाइल्डर द्वारा विकसित किया गया था और उनकी पुस्तक में वर्णित किया गया था
यह जानने के लिए कि आपके उपकरण और समय सीमा पर पीएसएआर के लिए कौन सी सेटिंग्स सबसे अधिक लाभदायक हैं आप इस उपकरण का उपयोग कर सकते हैं
बैकटेस्ट
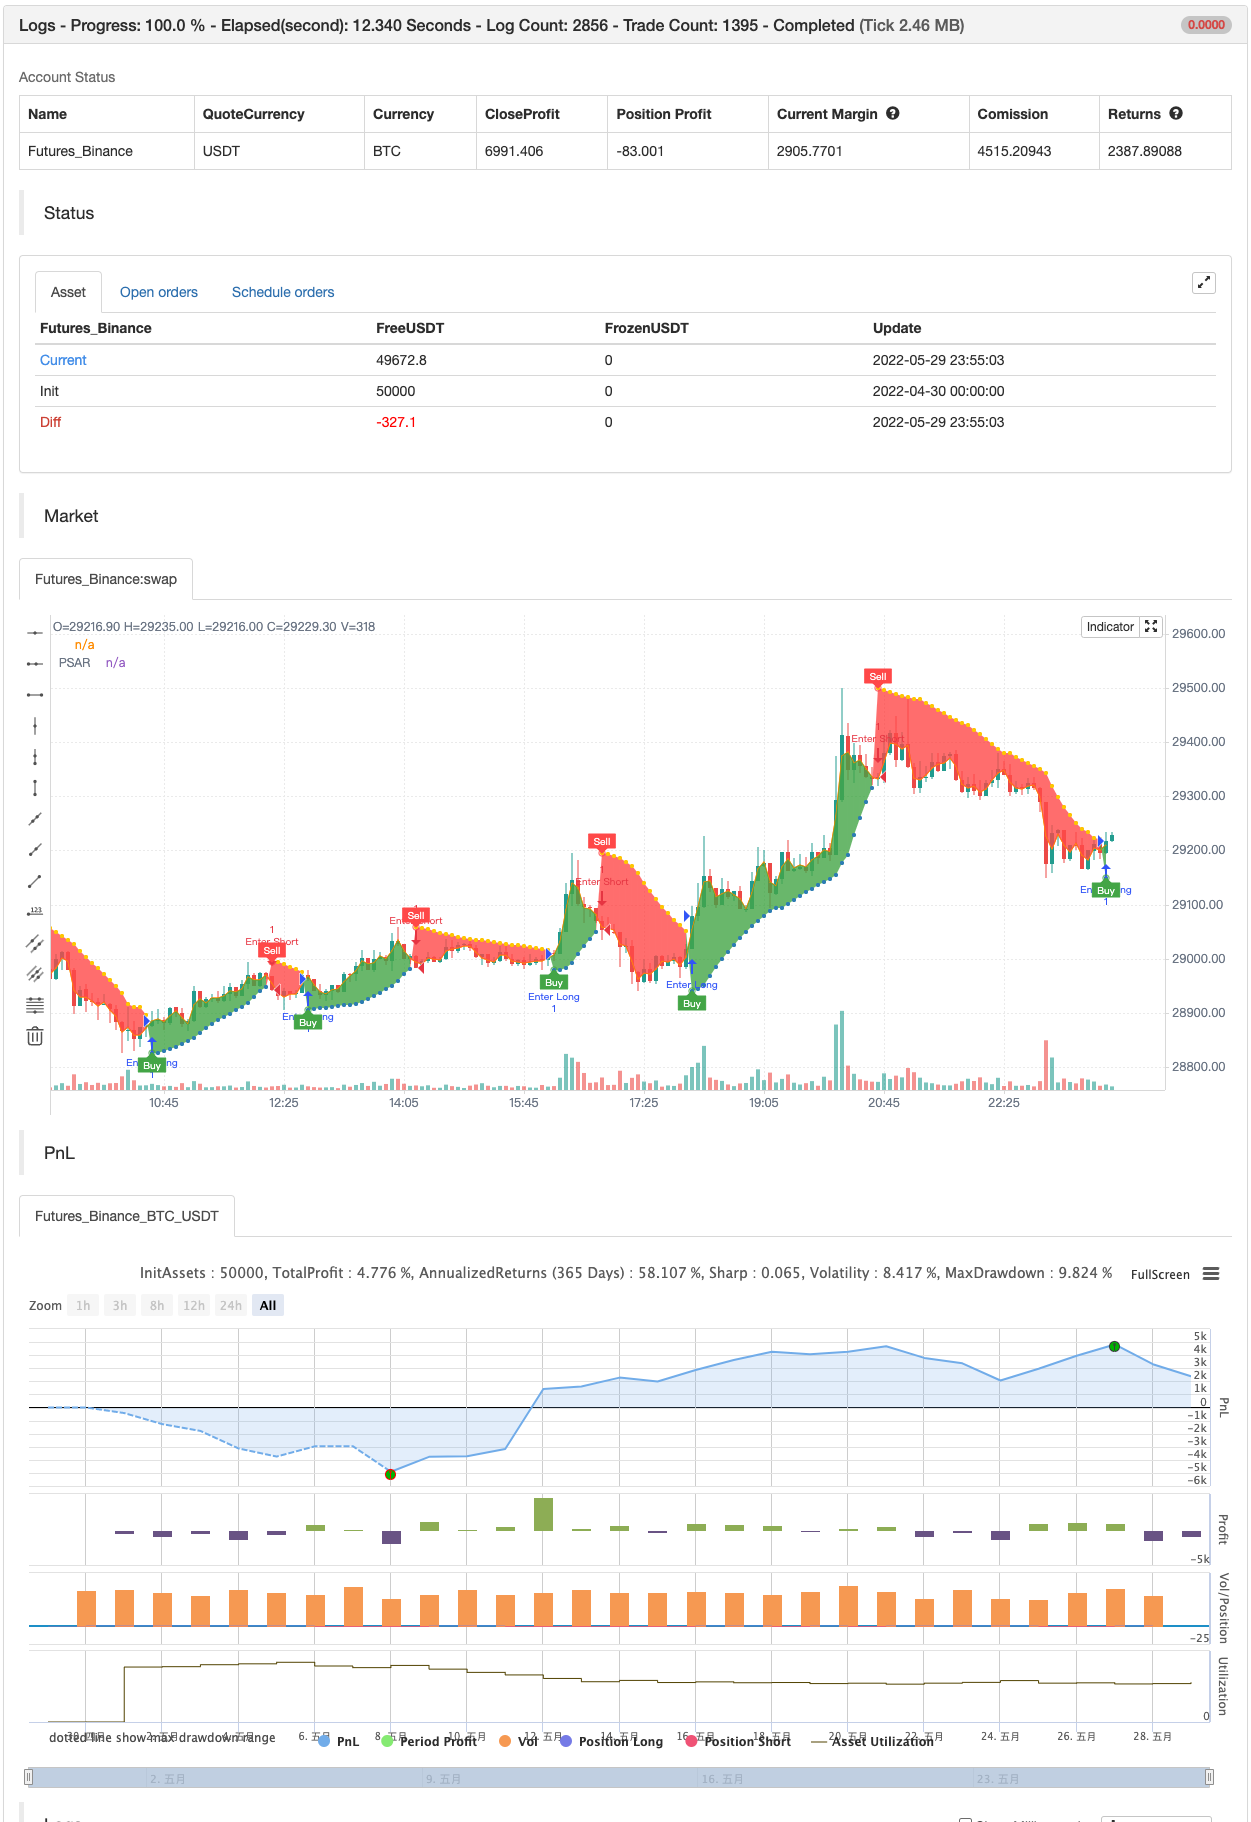
/*backtest
start: 2022-04-30 00:00:00
end: 2022-05-29 23:59:00
period: 5m
basePeriod: 1m
exchanges: [{"eid":"Futures_Binance","currency":"BTC_USDT"}]
*/

//@version=4
// Copyright (c) 2019-present, Alex Orekhov (everget)
// Parabolic SAR script may be freely distributed under the terms of the GPL-3.0 license.
study("Parabolic SAR", shorttitle="PSAR", overlay=true)

start = input(title="Start", type=input.float, step=0.001, defval=0.02)
increment = input(title="Increment", type=input.float, step=0.001, defval=0.02)
maximum = input(title="Maximum", type=input.float, step=0.01, defval=0.2)
width = input(title="Point Width", type=input.integer, minval=1, defval=2)
highlightStartPoints = input(title="Highlight Start Points ?", type=input.bool, defval=true)
showLabels = input(title="Show Buy/Sell Labels ?", type=input.bool, defval=true)
highlightState = input(title="Highlight State ?", type=input.bool, defval=true)

psar = sar(start, increment, maximum)
dir = psar < close ? 1 : -1

psarColor = dir == 1 ? #3388bb : #fdcc02
psarPlot = plot(psar, title="PSAR", style=plot.style_circles, linewidth=width, color=psarColor, transp=0)

var color longColor = color.green
var color shortColor = color.red

buySignal = dir == 1 and dir[1] == -1
plotshape(buySignal and highlightStartPoints ? psar : na, title="Long Start", location=location.absolute, style=shape.circle, size=size.tiny, color=longColor, transp=0)
plotshape(buySignal and showLabels ? psar : na, title="Buy Label", text="Buy", location=location.absolute, style=shape.labelup, size=size.tiny, color=longColor, textcolor=color.white, transp=0)

sellSignal = dir == -1 and dir[1] == 1
plotshape(sellSignal and highlightStartPoints ? psar : na, title="Short Start", location=location.absolute, style=shape.circle, size=size.tiny, color=shortColor, transp=0)
plotshape(sellSignal and showLabels ? psar : na, title="Sell Label", text="Sell", location=location.absolute, style=shape.labeldown, size=size.tiny, color=shortColor, textcolor=color.white, transp=0)

midPricePlot = plot(ohlc4, title="", display=display.none)

fillColor = highlightState ? (dir == 1 ? longColor : shortColor) : na
fill(midPricePlot, psarPlot, title="Trade State Filling", color=fillColor)

changeCond = dir != dir[1]
alertcondition(changeCond, title="Alert: PSAR Direction Change", message="PSAR has changed direction!")
alertcondition(buySignal, title="Alert: PSAR Long", message="PSAR Long")
alertcondition(sellSignal, title="Alert: PSAR Short", message="PSAR Sell")


if buySignal
    strategy.entry("Enter Long", strategy.long)
else if sellSignal
    strategy.entry("Enter Short", strategy.short)
संबंधित
- इलियट वेव थ्योरी 4-9 इम्पल्स वेव ऑटोमैटिक डिटेक्शन ट्रेडिंग रणनीति
- एसएआर - उच्च और निम्न
- उच्च निम्न SAR
- पैराबोलिक एसएआर खरीदें और बेचें
- 15MIN BTCUSDTPERP BOT
अधिक
- TUE ADX/MACD कन्फ्लुएंस V1.0
- ट्विन रेंज फ़िल्टर
- एसएआर - उच्च और निम्न
- सटीक स्विंग ट्रेडिंग प्रणाली
- रैखिक प्रवृत्ति
- फिबोनाची समय पैटर्न
- दरवास बॉक्स खरीदें बेचें
- डिमार्क सेटअप सूचक
- बोलिंगर बैंड्स स्टोकैस्टिक आरएसआई चरम
- AK MACD BB INDICATOR V 1.00
- आरएसआई विचलन सूचक
- ओबीवी एमएसीडी सूचक
- पिवोट ट्रेंड
- मूल्य विचलन रणनीति v1.0
- समर्थन-प्रतिरोध ब्रेकआउट
- ढलान अनुकूली चलती औसत
- डेल्टा-आरएसआई ऑसिलेटर रणनीति
- कम स्कैनर रणनीति क्रिप्टो
- [ब्लैक कैट] L2 रिवर्सल लेबल रणनीति
- सुपरबी