Cryptocurrency Futures Multi-Symbol ART Strategy (Pengajaran)
Penulis:Ninabadass, Dibuat: 2022-04-07 11:09:42, Diperbarui: 2022-04-07 16:15:14Cryptocurrency Futures Multi-Symbol ART Strategy (Pengajaran)
Baru-baru ini, beberapa pengguna platform kami sangat berharap untuk port strategi Mylanguage ke dalam strategi JavaScript, sehingga banyak ide optimasi dapat ditambahkan secara fleksibel. Mereka bahkan ingin memperluas strategi ke dalam versi multi-simbol. Karena strategi Mylanguage biasanya strategi tren, dan banyak yang dilaksanakan dalam model harga dekat. Strategi tersebut meminta antarmuka API platform tidak terlalu sering, yang lebih cocok untuk port ke dalam versi strategi multi-simbol. Dalam artikel ini, kami mengambil strategi Mylanguage sederhana sebagai contoh dan port ke dalam versi bahasa JavaScript yang sederhana. Tujuan utama adalah untuk mengajar, backtest dan penelitian. Jika Anda ingin menjalankan strategi, Anda mungkin perlu menambahkan beberapa rincian (seperti jumlah pesanan, presisi, jumlah pesanan, kontrol status pesanan berdasarkan aset, rasio informasi tampilan, dll.), Anda juga perlu menjalankan tes tik real.
Strategi Mylangauge yang akan Dipindahkan
TR:=MAX(MAX((H-L),ABS(REF(C,1)-H)),ABS(REF(C,1)-L));
ATR:=EMA(TR,LENGTH2);

MIDLINE^^EMA((H + L + C)/3,LENGTH1);
UPBAND^^MIDLINE + N*ATR;
DOWNBAND^^MIDLINE - N*ATR;


BKVOL=0 AND C>=UPBAND AND REF(C,1)<REF(UPBAND,1),BPK;
SKVOL=0 AND C<=DOWNBAND AND REF(C,1)>REF(DOWNBAND,1),SPK;

BKVOL>0 AND C<=MIDLINE,SP(BKVOL);
SKVOL>0 AND C>=MIDLINE,BP(SKVOL);
// stop loss
C>=SKPRICE*(1+SLOSS*0.01),BP;
C<=BKPRICE*(1-SLOSS*0.01),SP;
AUTOFILTER;
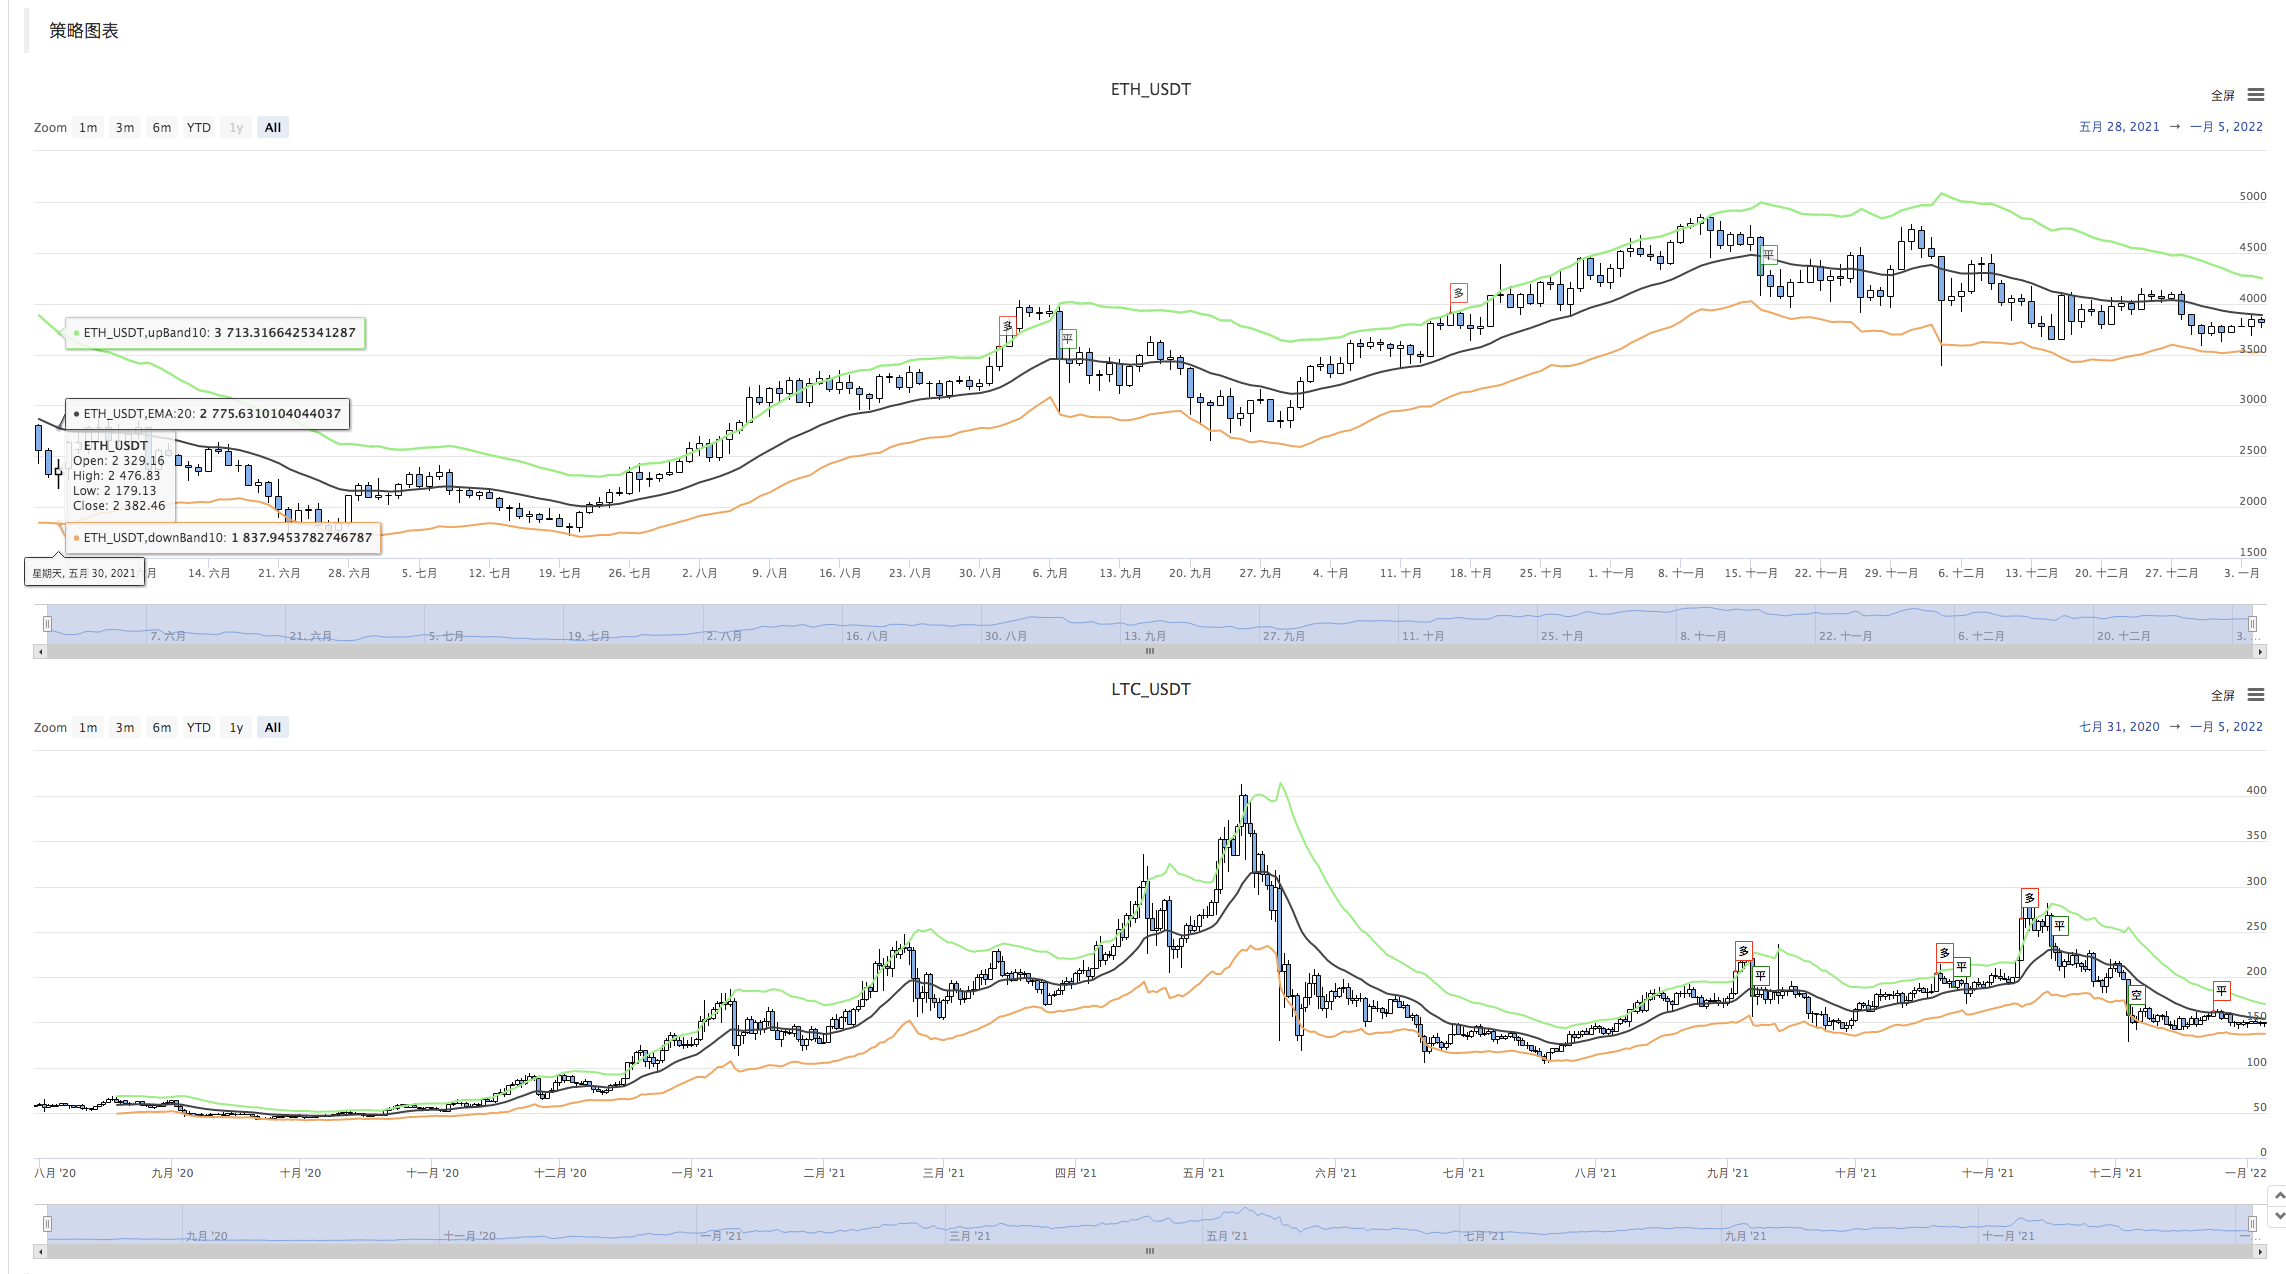
Logika strategi sangat sederhana. Pertama, berdasarkan parameter, hitung ATR, dan kemudian hitung nilai rata-rata harga tertinggi, terendah, tutup dan terbuka dari semua BAR garis K, yang mana indikator EMA akan dihitung. Akhirnya, berdasarkan ATR dan rasio N dalam parameter, hitung upBand dan downBand.
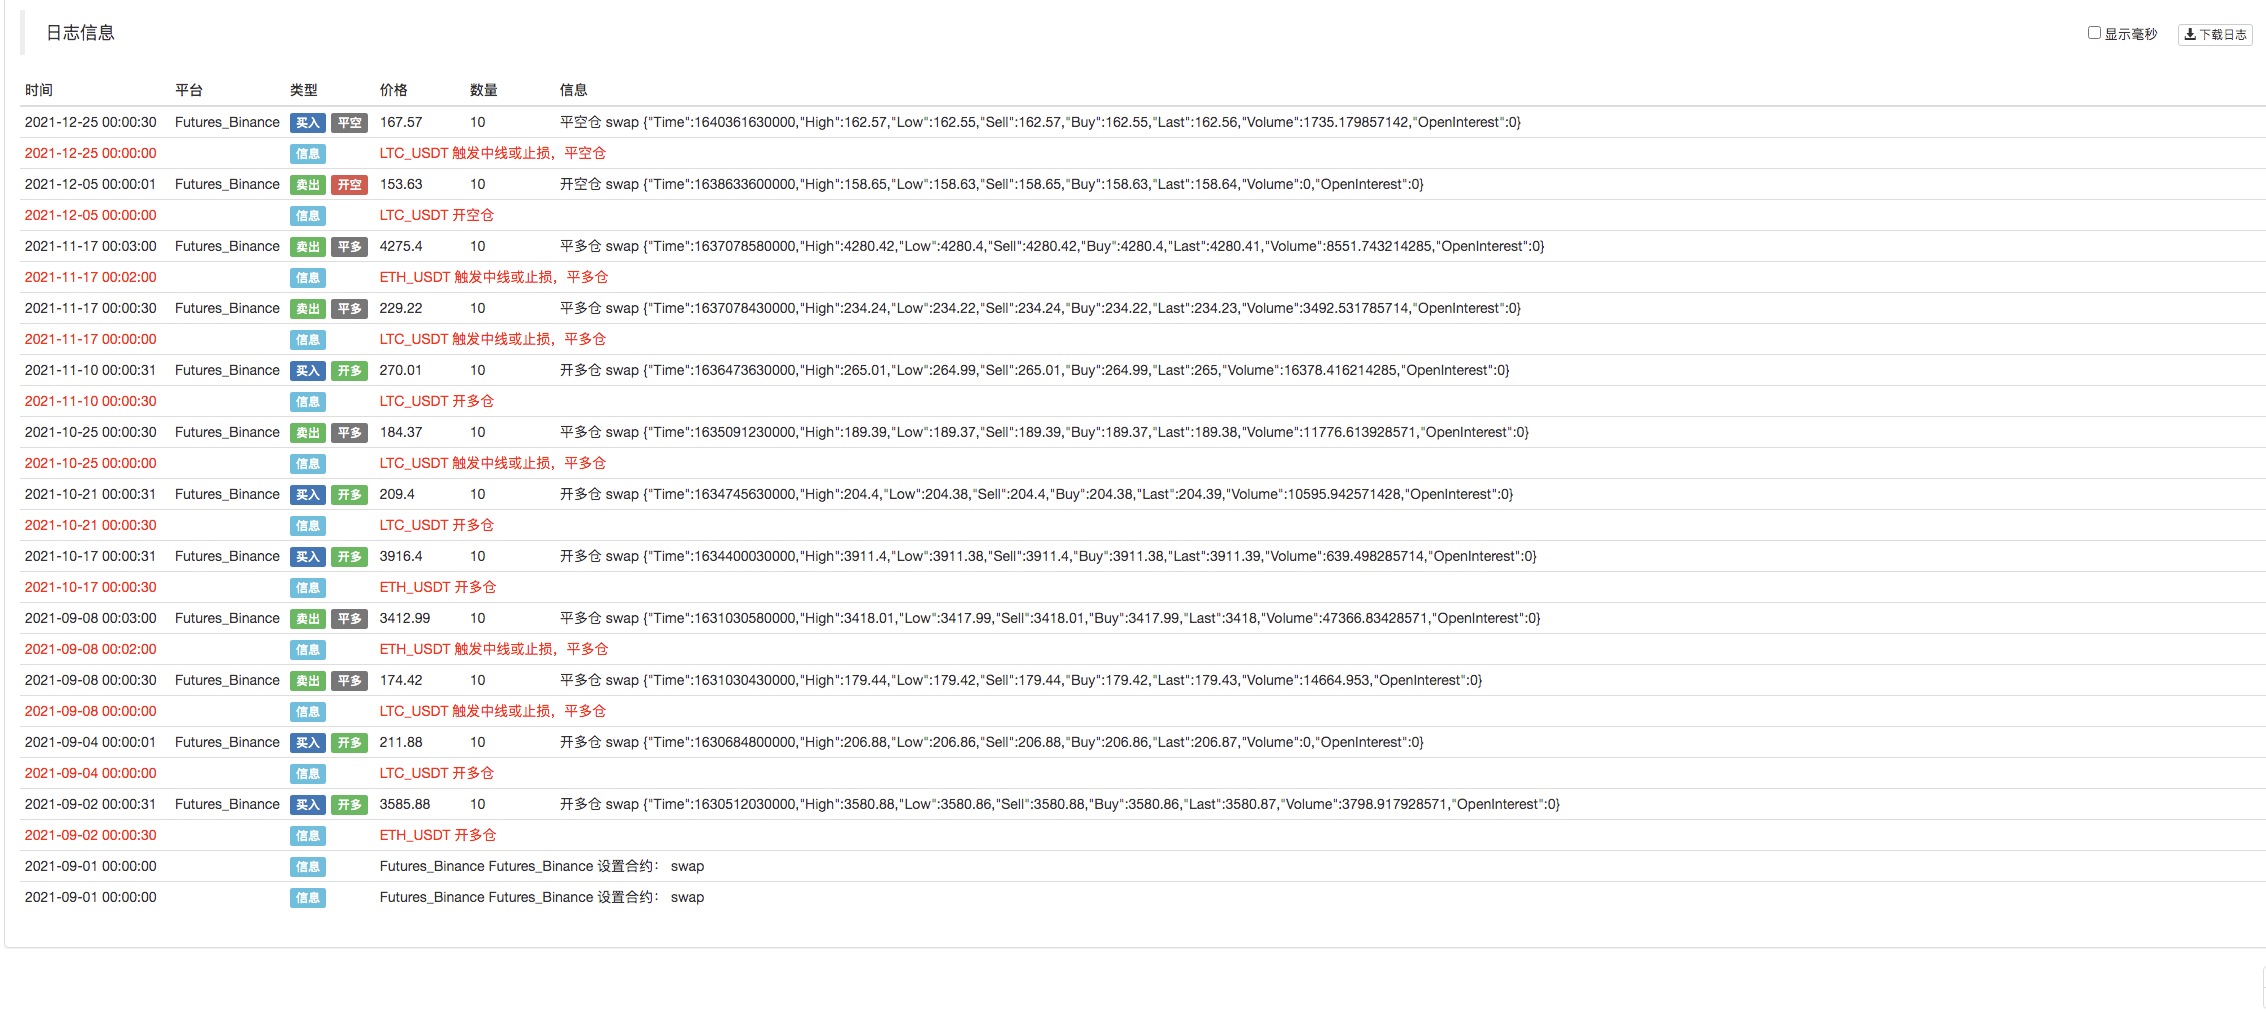
Posisi terbuka dan mundur didasarkan pada harga penutupan yang menembus upBand dan downBand. Merubah melalui upBand (ketika memegang pendek), membuka panjang; Merubah melalui downBand, membuka pendek. Ketika harga penutupan mencapai garis tengah, posisi penutupan; ketika harga penutupan mencapai harga stop loss, posisi penutupan (sesuai dengan SLOSS untuk stop loss; ketika SLOSS adalah 1, itu berarti 0,01, yaitu 1%). Strategi ini dilaksanakan dalam model harga penutupan.
Setelah memahami persyaratan strategi dan pemikiran Mylanguage, kita bisa mulai port.
Prototipe Strategi Pelabuhan dan Desain
Kode prototipe strategi tidak terlalu panjang, hanya 1 sampai 200 baris. agar Anda mudah mempelajari ide-ide penulisan strategi, saya langsung menulis komentar dalam kode strategi.
// parse params, from string to object
var arrParam = JSON.parse(params)

// the function creates the chart configuration
function createChartConfig(symbol, atrPeriod, emaPeriod, index) {   // symbol: trading pair; atrPeriod: ATR parameter period;  emaPeriod: EMA parameter period; index: index of the corresponding exchange object
    var chart = {
        __isStock: true,
        extension: {
                layout: 'single',
                height: 600,
        },
        title : { text : symbol},
        xAxis: { type: 'datetime'},
        series : [
            {
                type: 'candlestick',    // K-line data series
                name: symbol,
                id: symbol + "-" + index,
                data: []
            }, {
                type: 'line',           // EMA
                name: symbol + ',EMA:' + emaPeriod,
                data: [],
            }, {
                type: 'line',           // upBand
                name: symbol + ',upBand' + atrPeriod,
                data: []
            }, {
                type: 'line',           // downBand
                name: symbol + ',downBand' + atrPeriod,
                data: []
            }, {
                type: 'flags',
                onSeries: symbol + "-" + index,
                data: [],
            }
        ]
    }
    return chart
}

// main logic
function process(e, kIndex, c) {    // e is the exchange object, such as exchanges[0] ... ; kIndex is the data series of K-line data in the chart; c is the chart object
    // obtain K-line data
    var r = e.GetRecords(e.param.period)
    if (!r || r.length < e.param.atrPeriod + 2 || r.length < e.param.emaPeriod + 2) {
        // if K-line data length is insufficient, return
        return
    }

    // calculate ATR indicator
    var atr = TA.ATR(r, e.param.atrPeriod)
    var arrAvgPrice = []
    _.each(r, function(bar) {
        arrAvgPrice.push((bar.High + bar.Low + bar.Close) / 3)
    })
    // calculate EMA indicator
    var midLine = TA.EMA(arrAvgPrice, e.param.emaPeriod)
    // calculate upBand and downBand
    var upBand = []
    var downBand = []
    _.each(midLine, function(mid, index) {
        if (index < e.param.emaPeriod - 1 || index < e.param.atrPeriod - 1) {
            upBand.push(NaN)
            downBand.push(NaN)
            return
        }
        upBand.push(mid + e.param.trackRatio * atr[index])
        downBand.push(mid - e.param.trackRatio * atr[index])
    })

    // plot
    for (var i = 0 ; i < r.length ; i++) {
        if (r[i].Time == e.state.lastBarTime) {
            // update
            c.add(kIndex, [r[i].Time, r[i].Open, r[i].High, r[i].Low, r[i].Close], -1)
            c.add(kIndex + 1, [r[i].Time, midLine[i]], -1)
            c.add(kIndex + 2, [r[i].Time, upBand[i]], -1)
            c.add(kIndex + 3, [r[i].Time, downBand[i]], -1)
        } else if (r[i].Time > e.state.lastBarTime) {
            // add
            e.state.lastBarTime = r[i].Time
            c.add(kIndex, [r[i].Time, r[i].Open, r[i].High, r[i].Low, r[i].Close])
            c.add(kIndex + 1, [r[i].Time, midLine[i]])
            c.add(kIndex + 2, [r[i].Time, upBand[i]])
            c.add(kIndex + 3, [r[i].Time, downBand[i]])
        }
    }

    // detect position
    var pos = e.GetPosition()
    if (!pos) {
        return
    }
    var holdAmount = 0
    var holdPrice = 0
    if (pos.length > 1) {
        throw "Long and short positions are detected simultaneously!"
    } else if (pos.length != 0) {
        holdAmount = pos[0].Type == PD_LONG ? pos[0].Amount : -pos[0].Amount
        holdPrice = pos[0].Price
    }

    if (e.state.preBar == -1) {
        e.state.preBar = r[r.length - 1].Time
    }
    // detect signal
    if (e.state.preBar != r[r.length - 1].Time) {   // close price model
        if (holdAmount <= 0 && r[r.length - 3].Close < upBand[upBand.length - 3] && r[r.length - 2].Close > upBand[upBand.length - 2]) {   // close price up cross the upBand
            if (holdAmount < 0) {   // holding short, close position
                Log(e.GetCurrency(), "close short position", "#FF0000")
                $.CoverShort(e, e.param.symbol, Math.abs(holdAmount))
                c.add(kIndex + 4, {x: r[r.length - 2].Time, color: 'red', shape: 'flag', title: 'close', text: "close short position"})
            }
            // open long
            Log(e.GetCurrency(), "open long position", "#FF0000")
            $.OpenLong(e, e.param.symbol, 10)
            c.add(kIndex + 4, {x: r[r.length - 2].Time, color: 'red', shape: 'flag', title: 'long', text: "open long position"})
        } else if (holdAmount >= 0 && r[r.length - 3].Close > downBand[downBand.length - 3] && r[r.length - 2].Close < downBand[downBand.length - 2]) {  // close price down cross the downBand
            if (holdAmount > 0) {   // holding long, close position
                Log(e.GetCurrency(), "close long position", "#FF0000")
                $.CoverLong(e, e.param.symbol, Math.abs(holdAmount))
                c.add(kIndex + 4, {x: r[r.length - 2].Time, color: 'green', shape: 'flag', title: 'close', text: "close long position"})
            }
            // open short
            Log(e.GetCurrency(), "open short position", "#FF0000")
            $.OpenShort(e, e.param.symbol, 10)
            c.add(kIndex + 4, {x: r[r.length - 2].Time, color: 'green', shape: 'flag', title: 'short', text: "open short position"})
        } else {
            // close position
            if (holdAmount > 0 && (r[r.length - 2].Close <= holdPrice * (1 - e.param.stopLoss) || r[r.length - 2].Close <= midLine[midLine.length - 2])) {   // if holding long position, close price is equal to or less than midline, stop loss according to open position price
                Log(e.GetCurrency(), "if midline is triggered or stop loss, close long position", "#FF0000")
                $.CoverLong(e, e.param.symbol, Math.abs(holdAmount))
                c.add(kIndex + 4, {x: r[r.length - 2].Time, color: 'green', shape: 'flag', title: 'close', text: "close long position"})
            } else if (holdAmount < 0 && (r[r.length - 2].Close >= holdPrice * (1 + e.param.stopLoss) || r[r.length - 2].Close >= midLine[midLine.length - 2])) {  // if holding short position, close price is equal to or more than midline, stop loss according to open position price
                Log(e.GetCurrency(), "if midline is triggered or stop loss, close short position", "#FF0000")
                $.CoverShort(e, e.param.symbol, Math.abs(holdAmount))
                c.add(kIndex + 4, {x: r[r.length - 2].Time, color: 'red', shape: 'flag', title: 'close', text: "close short position"})
            }
        }
        e.state.preBar = r[r.length - 1].Time
    }
}

function main() {
    var arrChartConfig = []
    if (arrParam.length != exchanges.length) {
        throw "The parameter and the exchange object do not match!"
    }
    var arrState = _G("arrState")
    _.each(exchanges, function(e, index) {
        if (e.GetName() != "Futures_Binance") {
            throw "The platform is not supported!"
        }
        e.param = arrParam[index]
        e.state = {lastBarTime: 0, symbol: e.param.symbol, currency: e.GetCurrency()}
        if (arrState) {
            if (arrState[index].symbol == e.param.symbol && arrState[index].currency == e.GetCurrency()) {
                Log("Recover:", e.state)
                e.state = arrState[index]
            } else {
                throw "The recovered data and the current setting do not match!"
            }
        }
        e.state.preBar = -1   // initially set -1
        e.SetContractType(e.param.symbol)
        Log(e.GetName(), e.GetLabel(), "Set contract:", e.param.symbol)
        arrChartConfig.push(createChartConfig(e.GetCurrency(), e.param.atrPeriod, e.param.emaPeriod, index))
    })
    var chart = Chart(arrChartConfig)
    chart.reset()

    while (true) {
        _.each(exchanges, function(e, index) {
            process(e, index + index * 4, chart)
            Sleep(500)
        })
    }
}

function onexit() {
    // record e.state
    var arrState = []
    _.each(exchanges, function(e) {
        arrState.push(e.state)
    })
    Log("Record:", arrState)
    _G("arrState", arrState)
}
Parameter strategi:
var params = '[{
        "symbol" : "swap",    // contract code
        "period" : 86400,     // K-line period; 86400 seconds indicates 1 day
        "stopLoss" : 0.07,    // ratio of stoploss; 0.07 means 7%
        "atrPeriod" : 10,     // ATR indicator parameter
        "emaPeriod" : 10,     // EMA indicator parameter
        "trackRatio" : 1,     // ratio of upBand or downBand
        "openRatio" : 0.1     // ratio of reserved open position (temporarily not supported)
    }, {
        "symbol" : "swap",
        "period" : 86400,
        "stopLoss" : 0.07,
        "atrPeriod" : 10,
        "emaPeriod" : 10,
        "trackRatio" : 1,
        "openRatio" : 0.1
    }]'
Backtest
Kode Sumber Strategi:https://www.fmz.com/strategy/339344
Strategi hanya digunakan untuk komunikasi dan studi; untuk penggunaan praktis, Anda perlu memodifikasi, menyesuaikan dan mengoptimalkannya sendiri.
- Masalah nilai muka
- Contoh Desain Strategi dYdX
- Eksplorasi Awal Menggunakan Python Crawler di FMZ
Crawling Binance Konten Pengumuman - Penelitian Desain Strategi Hedge & Contoh Tugas Spot dan Berjangka yang Ditunda
- Situasi terkini dan operasi yang direkomendasikan dari strategi suku bunga pendanaan
- Strategi titik putus rata-rata bergerak ganda untuk berjangka mata uang kripto (Pengajaran)
- Cryptocurrency Spot Multi-Symbol Dual Moving Average Strategy (Pengajaran)
- Realisasi Fisher Indicator dalam JavaScript & Plotting pada FMZ
- Pengelola
- Ulasan TAQ Cryptocurrency 2021 & Strategi Simpel yang Hilang dari Peningkatan 10 Kali
- Upgrade! Cryptocurrency Futures Strategi Martingale
- Fungsi Getrecords tidak dapat mengambil K-string diagram dalam satuan detik
- Desain Sistem Manajemen Sinkron Berbasis FMZ (2)
- Data volume yang dikembalikan Getticker tidak benar.
- Desain Sistem Manajemen Sinkron Berbasis FMZ (1)
- Merancang Perpustakaan Plot Multi-Chart
- Lingkungan piringan
- Kode 60 baris mewujudkan satu pikiran - Kontrak dasar memancing
- Pengumuman Peningkatan & Penyesuaian Sistem Penagihan FMZ
- Pemberitahuan untuk Strategi Ghostwriting di FMZ