Realisasi Fisher Indicator dalam JavaScript & Plotting pada FMZ
Penulis:Ninabadass, Dibuat: 2022-04-07 16:04:22, Diperbarui:Realisasi Fisher Indicator dalam JavaScript & Plotting pada FMZ
Selama analisis teknis dalam perdagangan, para pedagang semua mengambil data harga saham sebagai data yang didistribusikan secara normal untuk dianalisis dan dipelajari.Fisher Transformationadalah metode yang dapat mengubah data harga menjadi sesuatu yang mirip dengan distribusi normal.Fisher TransformationSinyal perdagangan dapat dikirim dengan menggunakan interleaving indikator hari ini dan hari sebelumnya.
Ada begitu banyak referensi tentangFisher Transformationpada Baidu dan Zhihu, yang tidak akan dijelaskan secara rinci di sini.
Algoritma indikator:
-
Harga rata-rata hari ini:
mid=(low + high) / 2 -
Mengkonfirmasi periode perhitungan; Anda dapat menggunakan 10 hari per periode.
lowestLow = the lowest price in the period,highestHigh = the highest price in the period. -
Mendefinisikan parameter perubahan harga (di mana
ratioadalah konstan dari 0 sampai 1; misalnya Anda dapat memilih 0,5 atau 0.33):(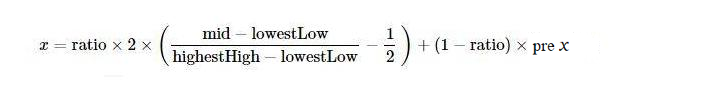
-
Menerapkan
FisherTransformasi ke parameter perubahan hargax, danFisherindikator dapat diperoleh: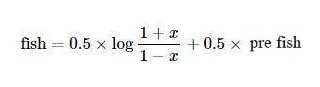
Gunakan JavaScript untuk Mengenal Algoritma
Menurut algoritma indikator, merealisasikannya langkah demi langkah.preX, preFish, mereka awalnya ditetapkan menjadi 0.Math.logadalah logaritma berdasarkan konstanta alam e Selain itu modifikasi x tidak disebutkan dalam algoritma di atas, dan saya hampir mengabaikan masalah ini saat menulis:
Mengubah nilai x; jika nilainya lebih dari 0,99, diatur ke 0,999; jika kurang dari -0,99, diatur ke -0,999.
        if (x > 0.99) {
            x = 0.999
        } else if (x < -0.99) {
            x = -0.999
        }
Ini adalah pertama kalinya saya melihat algoritma dan indikator, setelah portingnya sesuai dengan algoritma. Saya belum memverifikasi implementasinya, dan siswa yang tertarik pada penelitian dapat memverifikasi apakah ada kesalahan. Terima kasih banyak untuk menunjukkan kesalahan, jika ada.
Kode sumber dariFisher Transformalgoritma indikator:
function getHighest(arr, period) {
    if (arr.length == 0 || arr.length - period < 0) {
        return null
    }
    var beginIndex = arr.length - period
    var ret = arr[beginIndex].High
    for (var i = 0 ; i < arr.length - 1 ; i++) {
        if (arr[i + 1].High > ret) {
            ret = arr[i + 1].High
        }
    }
    return ret
}

function getLowest(arr, period) {
    if (arr.length == 0 || arr.length - period < 0) {
        return null
    }
    var beginIndex = arr.length - period
    var ret = arr[beginIndex].Low
    for (var i = 0 ; i < arr.length - 1 ; i++) {
        if (arr[i + 1].Low < ret) {
            ret = arr[i + 1].Low
        }
    }
    return ret
}

function calcFisher(records, ratio, period) {
    var preFish = 0
    var preX = 0
    var arrFish = []
    // when the K-line length is not long enough to meet the K-line period
    if (records.length < period) {
        for (var i = 0 ; i < records.length ; i++) {
            arrFish.push(0)
        }
        return arrFish
    }

    // traverse K-lines
    for (var i = 0 ; i < records.length ; i++) {
        var fish = 0
        var x = 0
        var bar = records[i]
        var mid = (bar.High + bar.Low) / 2
        // when the current BAR is not enough for period to calculate
        if (i < period - 1) {
            fish = 0
            preFish = 0
            arrFish.push(fish)
            continue
        }

        // calculate the highest price and the lowest price in the period
        var bars = []
        for (var j = 0 ; j <= i ; j++) {
            bars.push(records[j])
        }
        var lowestLow = getLowest(bars, period)
        var highestHigh = getHighest(bars, period)

        // price change parameter x
        x = ratio * 2 * ((mid - lowestLow) / (highestHigh - lowestLow) - 0.5) + (1 - ratio) * preX
        if (x > 0.99) {
            x = 0.999
        } else if (x < -0.99) {
            x = -0.999
        }
        preX = x
        fish = 0.5 * Math.log((1 + x) / (1 - x)) + 0.5 * preFish
        preFish = fish
        arrFish.push(fish)
    }
    return arrFish
}
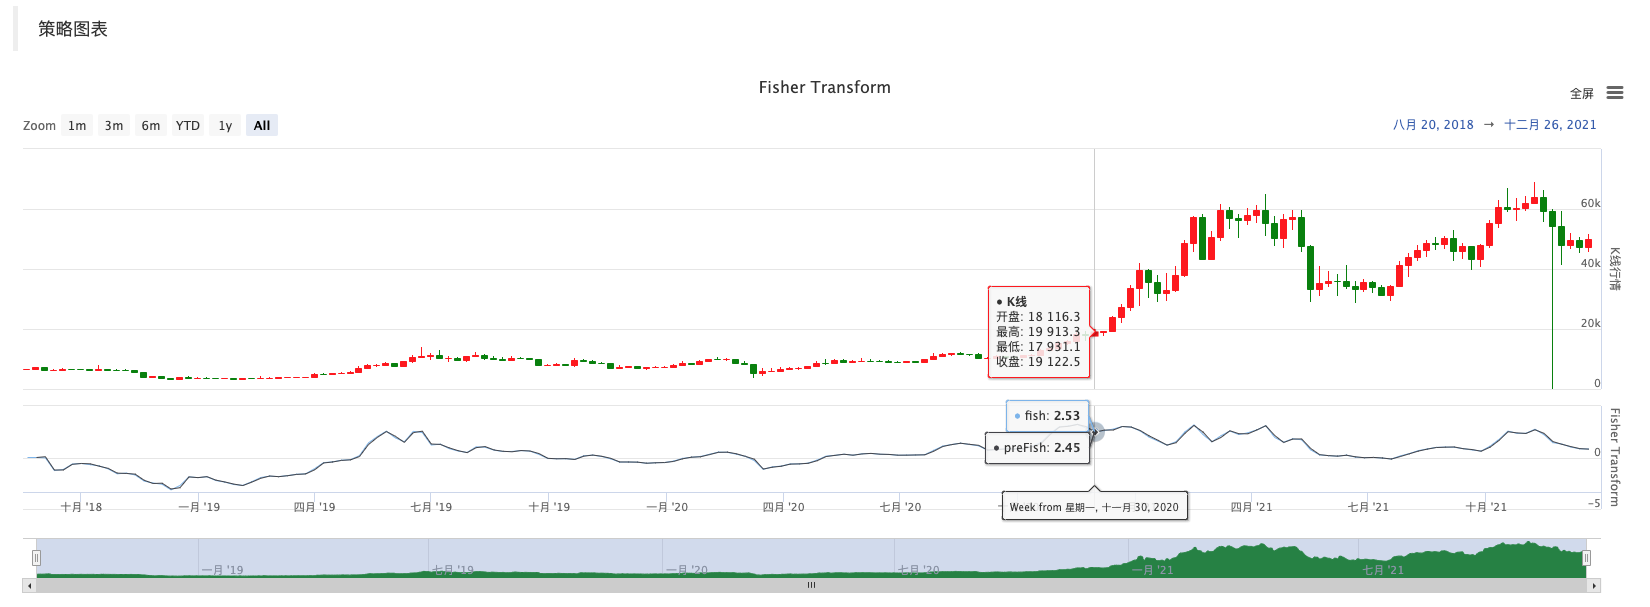
Plot
Sangat mudah untuk memetakan di FMZ; Anda dapat merujuk ke banyak contoh di kotak strategi:https://www.fmz.com/square, dan Anda juga dapat mencari strategi yang Anda butuhkan.
var cfg = {    // used to initially configure the chart objects (namely chart settings)
    plotOptions: {
        candlestick: {
            color: '#d75442',  // color value
            upColor: '#6ba583' // color vlaue
        }
    },
    title: { text: 'Fisher Transform'},     //title
    subtitle: {text: ''},     //subtitle
    plotOptions: {
        candlestick: {
        tooltip: {
            pointFormat:
            '<span style="color:{point.color}">\u25CF</span> <b> {series.name}</b><br/>' +
            'open: {point.open}<br/>' +
            'highest: {point.high}<br/>' +
            'lowest: {point.low}<br/>' +
            'close: {point.close}<br/>'
            }
        }
    },
    yAxis: [{
        title: {
            text: 'K-line market quote'
        },
        height: '70%',
        lineWidth: 1
    }, {
        title: {
            text: 'Fisher Transform'
        },
        top: '75%',
        height: '30%',
        offset: 0,
        lineWidth: 1
    }],
    series: [//series
        {
            type: 'candlestick',
            yAxis: 0,
            name: 'K-line',
            id: 'KLine',
            // control the candlestick color of fall
            color: 'green',
            lineColor: 'green',
            // control the candlestick color of rise
            upColor: 'red',
            upLineColor: 'red',
            data: []
        },{
            type: 'line',         // set the type of the current data series as: line
            yAxis: 1,             // the y axis for use is the y axis with index 0 (in highcharts, there can be multiple y axis, and here it indicates the y axis with index 0)
            showInLegend: true,   //
            name: 'fish',          // set according the parameter label  passed by the function
            lineWidth: 1,
            data: [],             // data item of the data series
            tooltip: {            // tip for tool
                valueDecimals: 2  //  the decimals of the value reserve 5
            }
        },{
            type: 'line',         // set the type of the current data series as: line
            yAxis: 1,             // the y axis for use is the y axis with index 0 (in highcharts, there can be multiple y axis, and here it indicates the y axis with index 0)
            showInLegend: true,   //
            name: 'preFish',      // set according the parameter label  passed by the function
            lineWidth: 1,
            data: [],             // data item of the data series
            tooltip: {            // tip for tool
                valueDecimals: 2  // the decimals of the value reserve 5
            }
        }
    ]
}

var chart = Chart(cfg)
function main() {
    var ts = 0
    chart.reset()
    while (true) {
        var r = exchange.GetRecords()
        var fisher = calcFisher(r, 0.33, 10)
        if (!r || !fisher) {
            Sleep(500)
            continue
        }

        for (var i = 0; i < r.length; i++){
            if (ts == r[i].Time) {
                chart.add([0,[r[i].Time, r[i].Open, r[i].High, r[i].Low, r[i].Close], -1])
                chart.add([1,[r[i].Time, fisher[i]], -1])
                if (i - 1 >= 0) {
                    chart.add([2,[r[i].Time, fisher[i - 1]], -1])
                }
            }else if (ts < r[i].Time) {
                chart.add([0,[r[i].Time, r[i].Open, r[i].High, r[i].Low, r[i].Close]])
                chart.add([1,[r[i].Time, fisher[i]]])
                if (i - 1 >= 0) {
                    chart.add([2,[r[i].Time, fisher[i - 1]]])
                }
                ts = r[i].Time
            }
        }
    }
}
Oleh karena itu, sangat nyaman untuk mempelajari data, tampilan grafik dan desain strategi di FMZ. Di sini saya memulai diskusi untuk lebih banyak ide, jadi selamat datang guru dan siswa untuk meninggalkan komentar.
- Kontrak Cryptocurrency Simple Order-Supervising Bot
- Saat menggunakan getdepth untuk mendapatkan timestamp yang sesuai
- Menghilangkan, menyelesaikan
- Masalah nilai muka
- Contoh Desain Strategi dYdX
- Eksplorasi Awal Menggunakan Python Crawler di FMZ
Crawling Binance Konten Pengumuman - Penelitian Desain Strategi Hedge & Contoh Tugas Spot dan Berjangka yang Ditunda
- Situasi terkini dan operasi yang direkomendasikan dari strategi suku bunga pendanaan
- Strategi titik putus rata-rata bergerak ganda untuk berjangka mata uang kripto (Pengajaran)
- Cryptocurrency Spot Multi-Symbol Dual Moving Average Strategy (Pengajaran)
- Pengelola
- Ulasan TAQ Cryptocurrency 2021 & Strategi Simpel yang Hilang dari Peningkatan 10 Kali
- Cryptocurrency Futures Multi-Symbol ART Strategy (Pengajaran)
- Upgrade! Cryptocurrency Futures Strategi Martingale
- Fungsi Getrecords tidak dapat mengambil K-string diagram dalam satuan detik
- Desain Sistem Manajemen Sinkron Berbasis FMZ (2)
- Data volume yang dikembalikan Getticker tidak benar.
- Desain Sistem Manajemen Sinkron Berbasis FMZ (1)
- Merancang Perpustakaan Plot Multi-Chart
- Lingkungan piringan