
"Strategi Rata-rata Pergerakan EMA Ganda Ajaib" dari YouTube Master
Dalam edisi ini, kita akan membahas "strategi rata-rata pergerakan EMA ganda ajaib" dari YouTube, yang disebut sebagai "pembunuh pasar saham dan mata uang kripto." Setelah menonton video tersebut, saya mengetahui bahwa strategi ini adalah strategi bahasa pinus pandangan perdagangan, yang menggunakan 2 indikator pandangan perdagangan. Melihat hasil pengujian ulang dalam video sangat bagus, dan FMZ juga mendukung bahasa Pine Trading View, mau tak mau saya ingin melakukan pengujian ulang dan menguji analisis sendiri. Kalau begitu, mulailah hidup sepenuhnya! Mari kita tiru strategi dalam video.
Indikator yang digunakan oleh strategi
- Indikator EMA
Demi kesederhanaan desain, kami tidak akan menggunakan Moving Average Exponential yang tercantum dalam video. Kami menggunakan ta.ema bawaan dalam tampilan perdagangan (sebenarnya keduanya sama).
- Indikator Swing Free VuManChu
Ini adalah indikator pada Trading View. Kita perlu masuk ke Trading View dan mengunduh kode sumbernya.
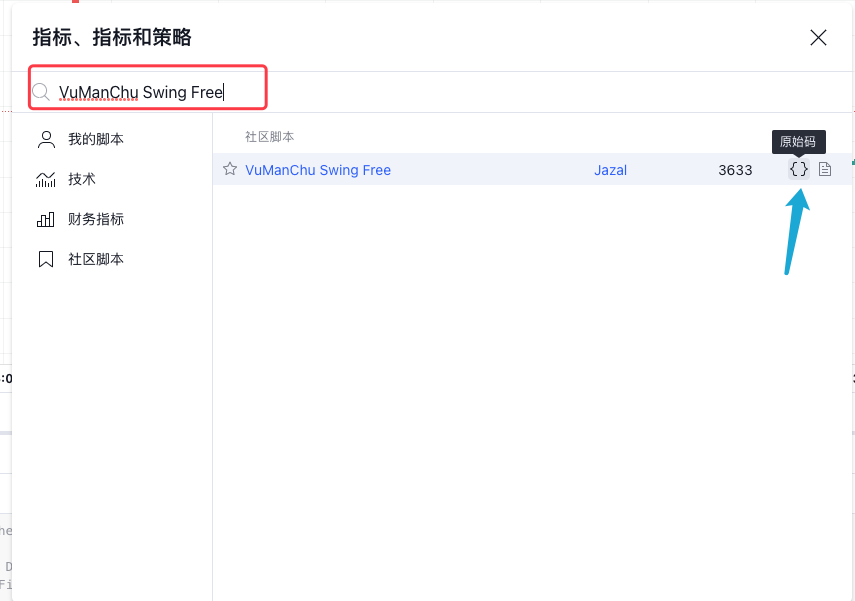
Kode Bebas Swing VuManChu:
pine
// This source code is subject to the terms of the Mozilla Public License 2.0 at https://mozilla.org/MPL/2.0/
// Credits to the original Script - Range Filter DonovanWall https://www.tradingview.com/script/lut7sBgG-Range-Filter-DW/
// This version is the old version of the Range Filter with less settings to tinker with
//@version=4
study(title="Range Filter - B&S Signals", shorttitle="RF - B&S Signals", overlay=true)
//-----------------------------------------------------------------------------------------------------------------------------------------------------------------
//Functions
//-----------------------------------------------------------------------------------------------------------------------------------------------------------------
//Range Size Function
rng_size(x, qty, n)=>
// AC = Cond_EMA(abs(x - x[1]), 1, n)
wper = (n*2) - 1
avrng = ema(abs(x - x[1]), n)
AC = ema(avrng, wper)*qty
rng_size = AC
//Range Filter Function
rng_filt(x, rng_, n)=>
r = rng_
var rfilt = array.new_float(2, x)
array.set(rfilt, 1, array.get(rfilt, 0))
if x - r > array.get(rfilt, 1)
array.set(rfilt, 0, x - r)
if x + r < array.get(rfilt, 1)
array.set(rfilt, 0, x + r)
rng_filt1 = array.get(rfilt, 0)
hi_band = rng_filt1 + r
lo_band = rng_filt1 - r
rng_filt = rng_filt1
[hi_band, lo_band, rng_filt]
//-----------------------------------------------------------------------------------------------------------------------------------------------------------------
//Inputs
//-----------------------------------------------------------------------------------------------------------------------------------------------------------------
//Range Source
rng_src = input(defval=close, type=input.source, title="Swing Source")
//Range Period
rng_per = input(defval=20, minval=1, title="Swing Period")
//Range Size Inputs
rng_qty = input(defval=3.5, minval=0.0000001, title="Swing Multiplier")
//Bar Colors
use_barcolor = input(defval=false, type=input.bool, title="Bar Colors On/Off")
//-----------------------------------------------------------------------------------------------------------------------------------------------------------------
//Definitions
//-----------------------------------------------------------------------------------------------------------------------------------------------------------------
//Range Filter Values
[h_band, l_band, filt] = rng_filt(rng_src, rng_size(rng_src, rng_qty, rng_per), rng_per)
//Direction Conditions
var fdir = 0.0
fdir := filt > filt[1] ? 1 : filt < filt[1] ? -1 : fdir
upward = fdir==1 ? 1 : 0
downward = fdir==-1 ? 1 : 0
//Trading Condition
longCond = rng_src > filt and rng_src > rng_src[1] and upward > 0 or rng_src > filt and rng_src < rng_src[1] and upward > 0
shortCond = rng_src < filt and rng_src < rng_src[1] and downward > 0 or rng_src < filt and rng_src > rng_src[1] and downward > 0
CondIni = 0
CondIni := longCond ? 1 : shortCond ? -1 : CondIni[1]
longCondition = longCond and CondIni[1] == -1
shortCondition = shortCond and CondIni[1] == 1
//Colors
filt_color = upward ? #05ff9b : downward ? #ff0583 : #cccccc
bar_color = upward and (rng_src > filt) ? (rng_src > rng_src[1] ? #05ff9b : #00b36b) :
downward and (rng_src < filt) ? (rng_src < rng_src[1] ? #ff0583 : #b8005d) : #cccccc
//-----------------------------------------------------------------------------------------------------------------------------------------------------------------
//Outputs
//-----------------------------------------------------------------------------------------------------------------------------------------------------------------
//Filter Plot
filt_plot = plot(filt, color=filt_color, transp=67, linewidth=3, title="Filter")
//Band Plots
h_band_plot = plot(h_band, color=color.new(#05ff9b, 100), title="High Band")
l_band_plot = plot(l_band, color=color.new(#ff0583, 100), title="Low Band")
//Band Fills
fill(h_band_plot, filt_plot, color=color.new(#00b36b, 92), title="High Band Fill")
fill(l_band_plot, filt_plot, color=color.new(#b8005d, 92), title="Low Band Fill")
//Bar Color
barcolor(use_barcolor ? bar_color : na)
//Plot Buy and Sell Labels
plotshape(longCondition, title = "Buy Signal", text ="BUY", textcolor = color.white, style=shape.labelup, size = size.normal, location=location.belowbar, color = color.new(color.green, 0))
plotshape(shortCondition, title = "Sell Signal", text ="SELL", textcolor = color.white, style=shape.labeldown, size = size.normal, location=location.abovebar, color = color.new(color.red, 0))
//Alerts
alertcondition(longCondition, title="Buy Alert", message = "BUY")
alertcondition(shortCondition, title="Sell Alert", message = "SELL")
Logika Strategi
Indikator EMA: Strategi ini menggunakan dua rata-rata pergerakan EMA, satu garis cepat (parameter siklus kecil) dan satu garis lambat (parameter siklus besar). Fungsi utama rata-rata pergerakan EMA ganda adalah untuk membantu kita menentukan arah tren pasar.
-
Pengaturan panjang
Garis cepat berada di atas garis lambat. -
Pengaturan pendek
Garis cepat berada di bawah garis lambat.
Indikator VuManChu Swing Free: Indikator VuManChu Swing Free digunakan untuk mengirimkan sinyal, dan kemudian dikombinasikan dengan kondisi lain untuk menentukan apakah akan mengajukan pesanan perdagangan. Dari kode sumber indikator VuManChu Swing Free, kita dapat melihat bahwa variabel longCondition mewakili sinyal beli, dan variabel shortCondition mewakili sinyal jual. Kedua variabel ini akan digunakan saat menulis kondisi pesanan nanti.
Sekarang mari kita bicarakan tentang kondisi pemicu sinyal perdagangan spesifik dari strategi ini:
-
Aturan untuk memasuki posisi panjang:
Harga penutupan garis K positif harus berada di atas garis cepat EMA, dua rata-rata pergerakan EMA harus berada dalam pengaturan bullish (garis cepat berada di atas garis lambat), dan indikator VuManChu Swing Free harus menunjukkan sinyal beli. (longCondition bernilai benar). Apabila ketiga kondisi tersebut terpenuhi, maka garis K ini merupakan garis K kunci untuk memasuki posisi long, dan harga penutupan garis K ini merupakan posisi masuk. -
Aturan untuk memasuki posisi short (berlawanan dengan posisi long):
Harga penutupan candlestick negatif harus berada di bawah garis EMA cepat, dua moving average EMA harus berada dalam posisi short (garis cepat berada di bawah garis lambat), dan indikator VuManChu Swing Free harus menunjukkan sinyal jual (shortCondition benar). Apabila ketiga kondisi tersebut terpenuhi, maka harga penutupan garis K ini merupakan titik masuk untuk melakukan penjualan pendek.
Bukankah logika perdagangannya sangat sederhana? Karena video sumber tidak menentukan take-profit dan stop-loss, editor akan menggunakan metode take-profit dan stop-loss yang lebih moderat, menggunakan stop loss titik tetap dan pelacakan mengambil untung.
Desain kode
Kami memasukkan kode indikator VuManChu Swing Free langsung ke dalam kode strategi kami tanpa perubahan apa pun.
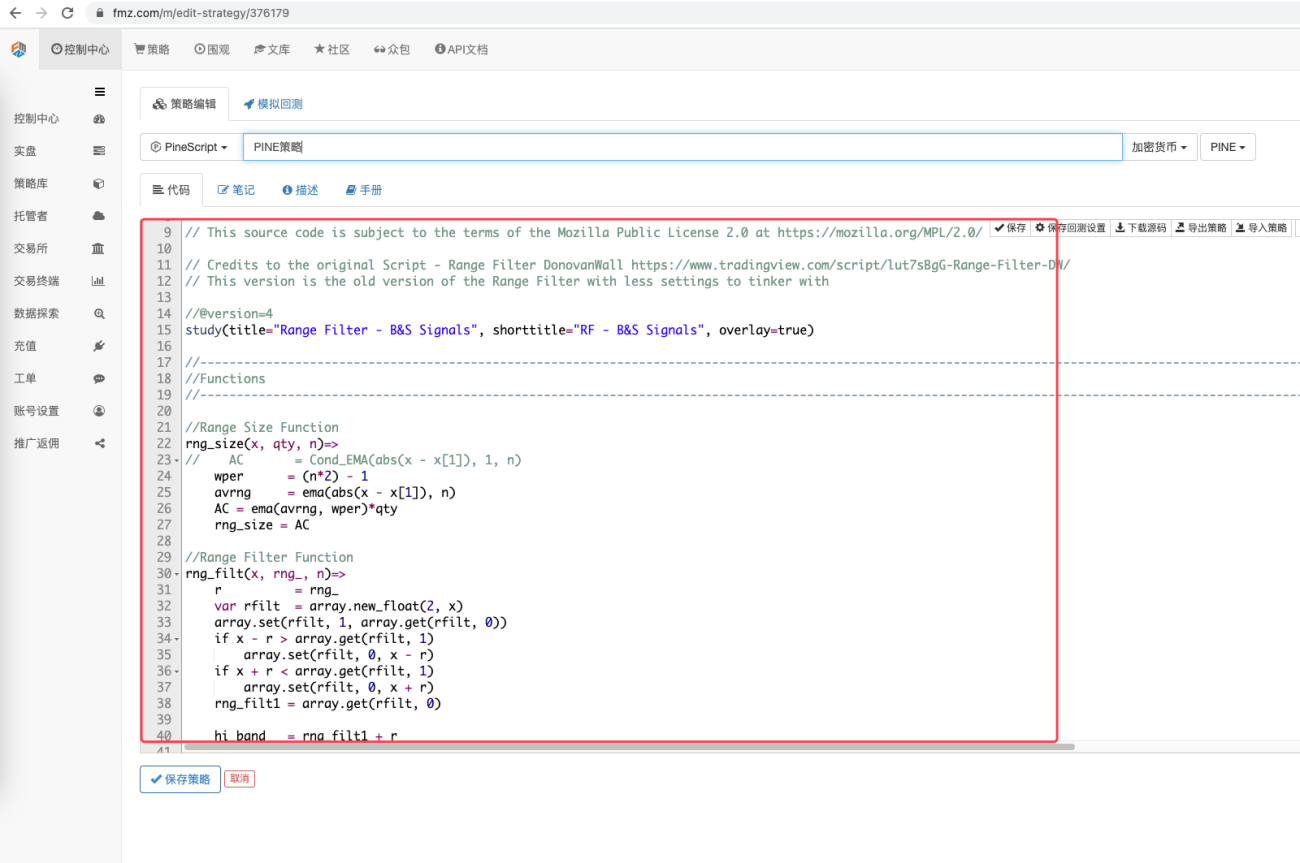
Kemudian kita menulis sepotong kode bahasa Pine untuk mengimplementasikan fungsi transaksi:
            pine

            // extend
fastEmaPeriod = input(50, "fastEmaPeriod")         // 快线周期
slowEmaPeriod = input(200, "slowEmaPeriod")        // 慢线周期
loss = input(30, "loss")                           // 止损点数
trailPoints = input(30, "trailPoints")             // 移动止盈触发点数
trailOffset = input(30, "trailOffset")             // 移动止盈偏移量(点数)
amount = input(1, "amount")                        // 下单量

emaFast = ta.ema(close, fastEmaPeriod)             // 计算快线EMA
emaSlow = ta.ema(close, slowEmaPeriod)             // 计算慢线EMA

buyCondition = longCondition and emaFast > emaSlow and close > open and close > emaFast         // 做多入场条件
sellCondition = shortCondition and emaFast < emaSlow and close < open and close < emaFast       // 做空入场条件

if buyCondition and strategy.position_size == 0
    strategy.entry("long", strategy.long, amount)
    strategy.exit("exit_long", "long", amount, loss=loss, trail_points=trailPoints, trail_offset=trailOffset)
if sellCondition and strategy.position_size == 0
    strategy.entry("short", strategy.short, amount)
    strategy.exit("exit_short", "short", amount, loss=loss, trail_points=trailPoints, trail_offset=trailOffset)
A. Seperti yang Anda lihat, ketika buyCondition bernilai true:
- Variabel longCondition bernilai true (indikator VuManChu Swing Free mengirimkan sinyal untuk mengambil posisi long).
- emaFast > emaSlow (pengaturan bullish EMA).
- tutup > buka (menunjukkan bahwa BAR saat ini adalah garis positif), tutup > emaFast (menunjukkan bahwa harga penutupan berada di atas garis cepat EMA).
Ketiga syarat untuk bertindak panjang terpenuhi.
B. Bila sellCondition bernilai true, maka ketiga kondisi untuk short selling terpenuhi (tidak dijelaskan di sini).
Kemudian, ketika kondisi if menentukan bahwa sinyal dipicu, gunakan fungsi strategy.entry untuk memasuki pasar dan membuka posisi, dan atur fungsi strategy.exit untuk menghentikan kerugian dan trailing profit.
Kode lengkap
            pine

            /*backtest
start: 2022-01-01 00:00:00
end: 2022-10-08 00:00:00
period: 15m
basePeriod: 5m
exchanges: [{"eid":"Futures_Binance","currency":"ETH_USDT"}]
args: [["ZPrecision",0,358374]]
*/

// This source code is subject to the terms of the Mozilla Public License 2.0 at https://mozilla.org/MPL/2.0/

// Credits to the original Script - Range Filter DonovanWall https://www.tradingview.com/script/lut7sBgG-Range-Filter-DW/
// This version is the old version of the Range Filter with less settings to tinker with

//@version=4
study(title="Range Filter - B&S Signals", shorttitle="RF - B&S Signals", overlay=true)

//-----------------------------------------------------------------------------------------------------------------------------------------------------------------
//Functions
//-----------------------------------------------------------------------------------------------------------------------------------------------------------------

//Range Size Function
rng_size(x, qty, n)=>
//    AC       = Cond_EMA(abs(x - x[1]), 1, n)
    wper      = (n*2) - 1
    avrng     = ema(abs(x - x[1]), n)
    AC = ema(avrng, wper)*qty
    rng_size = AC

//Range Filter Function
rng_filt(x, rng_, n)=>
    r          = rng_
    var rfilt  = array.new_float(2, x)
    array.set(rfilt, 1, array.get(rfilt, 0))
    if x - r > array.get(rfilt, 1)
        array.set(rfilt, 0, x - r)
    if x + r < array.get(rfilt, 1)
        array.set(rfilt, 0, x + r)
    rng_filt1 = array.get(rfilt, 0)

    hi_band   = rng_filt1 + r
    lo_band   = rng_filt1 - r
    rng_filt  = rng_filt1
    [hi_band, lo_band, rng_filt]

//-----------------------------------------------------------------------------------------------------------------------------------------------------------------
//Inputs
//-----------------------------------------------------------------------------------------------------------------------------------------------------------------

//Range Source
rng_src = input(defval=close, type=input.source, title="Swing Source")

//Range Period
rng_per = input(defval=20, minval=1, title="Swing Period")

//Range Size Inputs
rng_qty   = input(defval=3.5, minval=0.0000001, title="Swing Multiplier")

//Bar Colors
use_barcolor = input(defval=false, type=input.bool, title="Bar Colors On/Off")

//-----------------------------------------------------------------------------------------------------------------------------------------------------------------
//Definitions
//-----------------------------------------------------------------------------------------------------------------------------------------------------------------

//Range Filter Values
[h_band, l_band, filt] = rng_filt(rng_src, rng_size(rng_src, rng_qty, rng_per), rng_per)

//Direction Conditions
var fdir = 0.0
fdir    := filt > filt[1] ? 1 : filt < filt[1] ? -1 : fdir
upward   = fdir==1 ? 1 : 0
downward = fdir==-1 ? 1 : 0

//Trading Condition
longCond = rng_src > filt and rng_src > rng_src[1] and upward > 0 or rng_src > filt and rng_src < rng_src[1] and upward > 0
shortCond = rng_src < filt and rng_src < rng_src[1] and downward > 0 or rng_src < filt and rng_src > rng_src[1] and downward > 0

CondIni = 0
CondIni := longCond ? 1 : shortCond ? -1 : CondIni[1]
longCondition = longCond and CondIni[1] == -1
shortCondition = shortCond and CondIni[1] == 1

//Colors
filt_color = upward ? #05ff9b : downward ? #ff0583 : #cccccc
bar_color  = upward and (rng_src > filt) ? (rng_src > rng_src[1] ? #05ff9b : #00b36b) :
             downward and (rng_src < filt) ? (rng_src < rng_src[1] ? #ff0583 : #b8005d) : #cccccc

//-----------------------------------------------------------------------------------------------------------------------------------------------------------------
//Outputs
//-----------------------------------------------------------------------------------------------------------------------------------------------------------------

//Filter Plot
filt_plot = plot(filt, color=filt_color, transp=67, linewidth=3, title="Filter")

//Band Plots
h_band_plot = plot(h_band, color=color.new(#05ff9b, 100), title="High Band")
l_band_plot = plot(l_band, color=color.new(#ff0583, 100), title="Low Band")

//Band Fills
fill(h_band_plot, filt_plot, color=color.new(#00b36b, 92), title="High Band Fill")
fill(l_band_plot, filt_plot, color=color.new(#b8005d, 92), title="Low Band Fill")

//Bar Color
barcolor(use_barcolor ? bar_color : na)

//Plot Buy and Sell Labels
plotshape(longCondition, title = "Buy Signal", text ="BUY", textcolor = color.white, style=shape.labelup, size = size.normal, location=location.belowbar, color = color.new(color.green, 0))
plotshape(shortCondition, title = "Sell Signal", text ="SELL", textcolor = color.white, style=shape.labeldown, size = size.normal, location=location.abovebar, color = color.new(color.red, 0))

//Alerts
alertcondition(longCondition, title="Buy Alert", message = "BUY")
alertcondition(shortCondition, title="Sell Alert", message = "SELL")


// extend
fastEmaPeriod = input(50, "fastEmaPeriod")
slowEmaPeriod = input(200, "slowEmaPeriod")
loss = input(30, "loss")
trailPoints = input(30, "trailPoints")
trailOffset = input(30, "trailOffset")
amount = input(1, "amount")

emaFast = ta.ema(close, fastEmaPeriod)
emaSlow = ta.ema(close, slowEmaPeriod)

buyCondition = longCondition and emaFast > emaSlow and close > open and close > emaFast
sellCondition = shortCondition and emaFast < emaSlow and close < open and close < emaFast

if buyCondition and strategy.position_size == 0
    strategy.entry("long", strategy.long, amount)
    strategy.exit("exit_long", "long", amount, loss=loss, trail_points=trailPoints, trail_offset=trailOffset)
if sellCondition and strategy.position_size == 0
    strategy.entry("short", strategy.short, amount)
    strategy.exit("exit_short", "short", amount, loss=loss, trail_points=trailPoints, trail_offset=trailOffset)
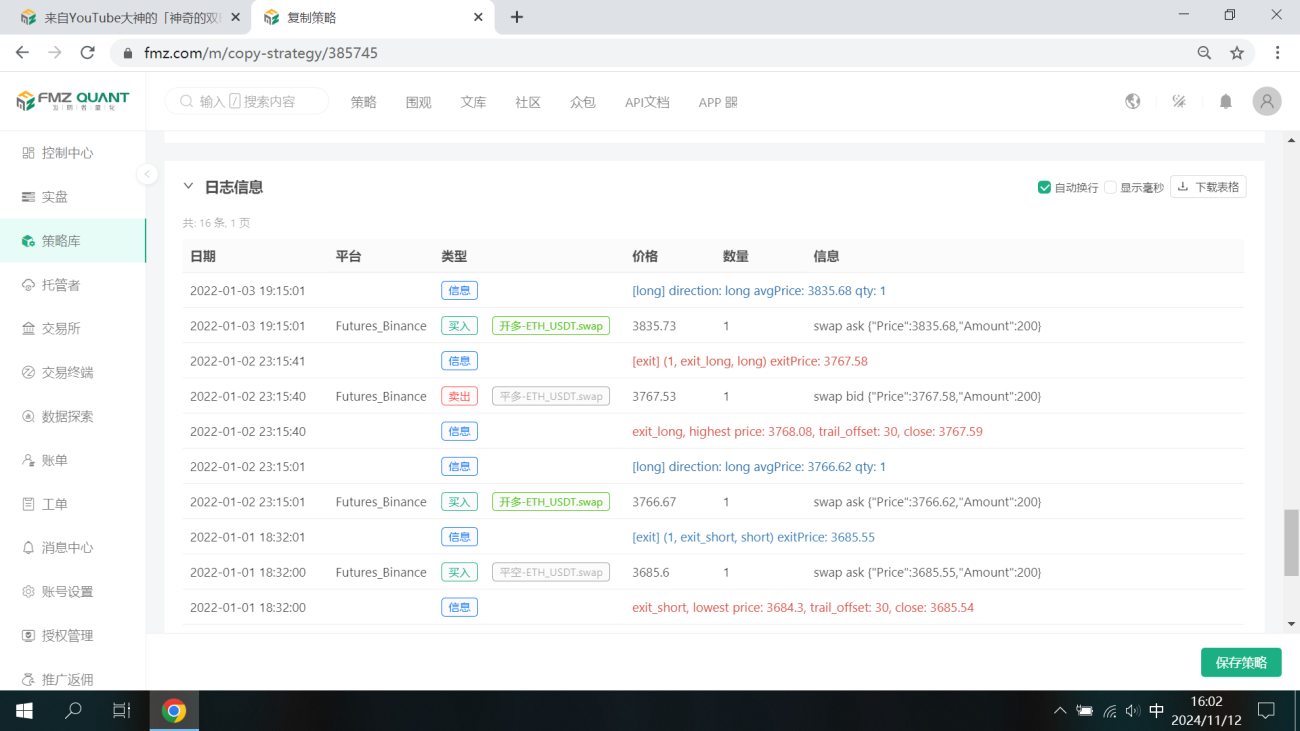
Pengujian ulang
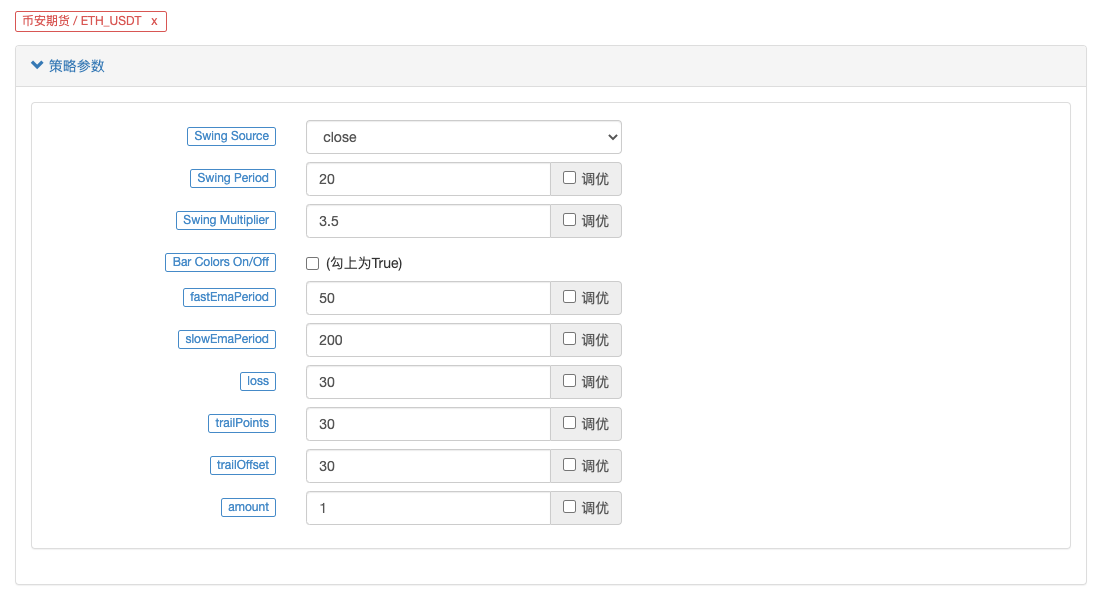
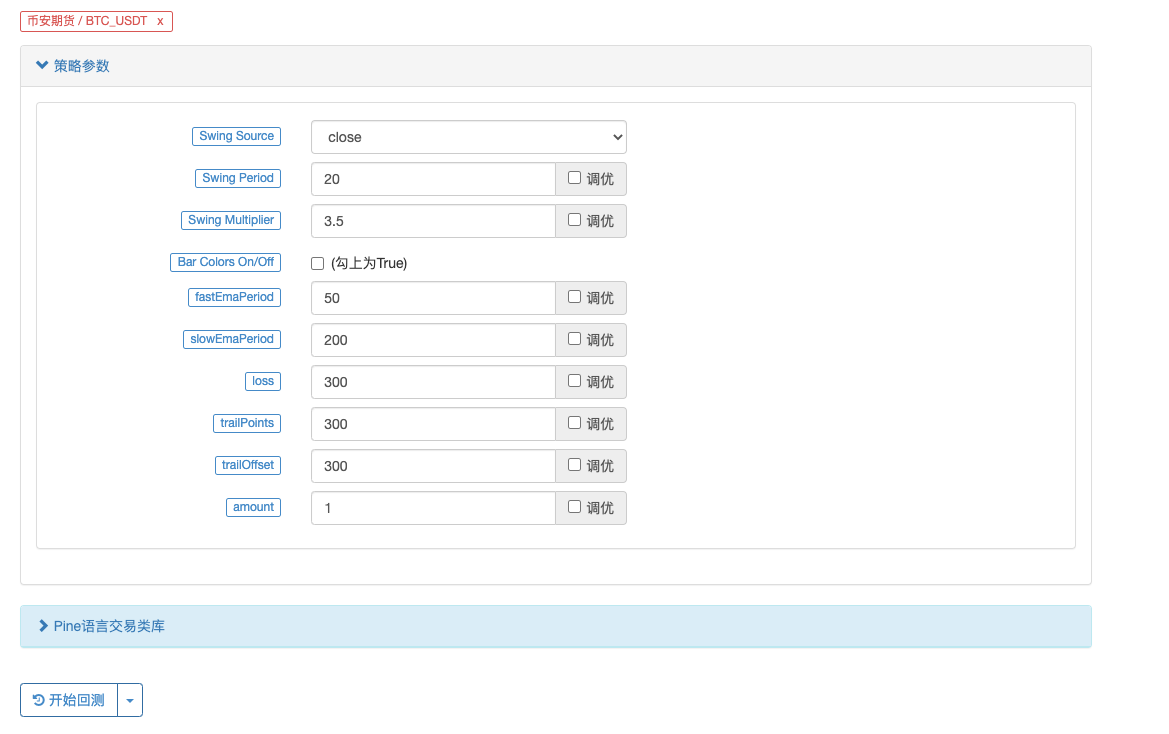
Rentang waktu pengujian ulang dipilih dari Januari 2022 hingga Oktober 2022, periode K-line adalah 15 menit, dan model harga penutupan digunakan untuk pengujian ulang. Pasar memilih kontrak berjangka ETH_USDT Binance. Pengaturan parameter sebagaimana dinyatakan dalam video sumber: 50 periode untuk jalur cepat dan 200 periode untuk jalur lambat, dan parameter lainnya tetap tidak berubah secara default. Saya agak subjektif mengenai titik stop loss dan trailing profit dan hanya menetapkannya di 30 poin.
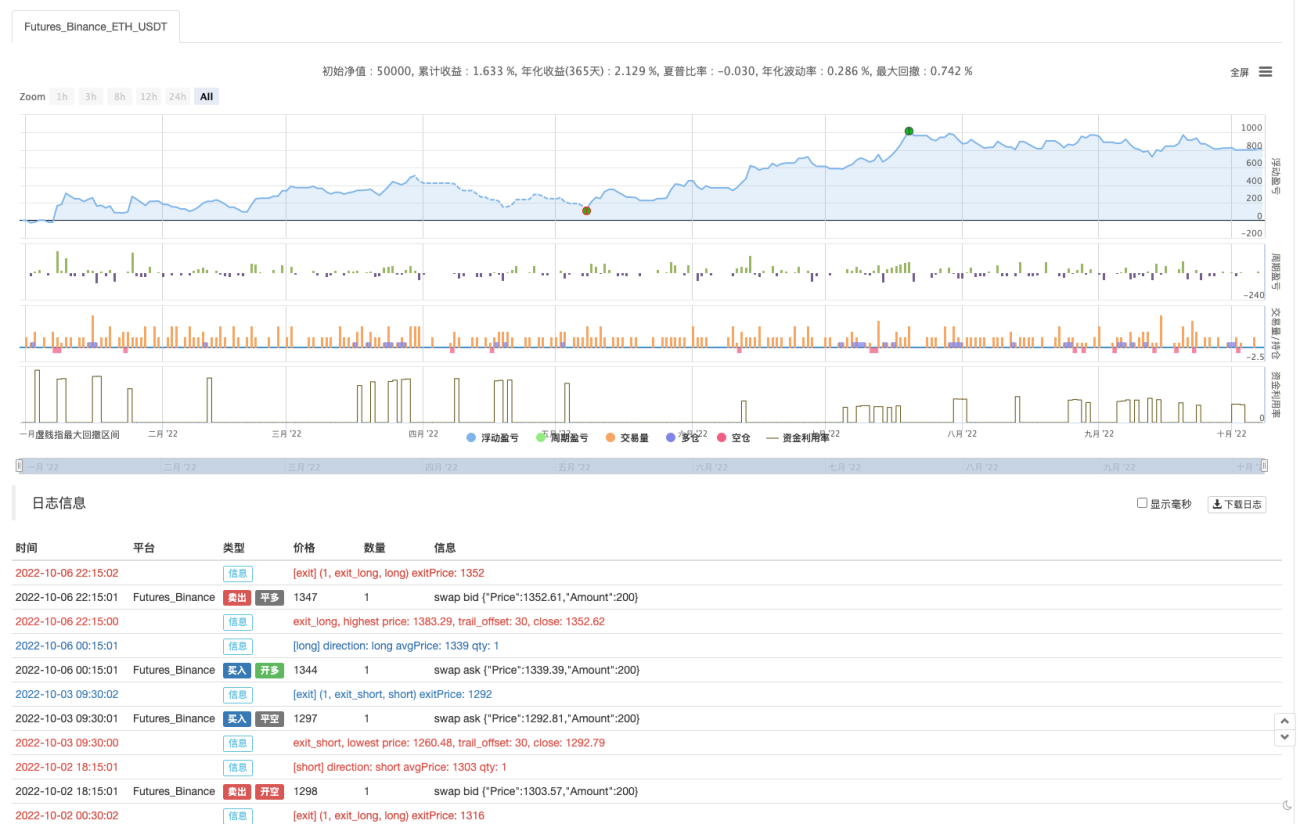
Hasil backtest-nya biasa saja. Setelah beberapa kali backtest, tampaknya parameter seperti take-profit dan stop-loss memiliki pengaruh terhadap hasil backtest. Saya merasa aspek ini perlu pengoptimalan lebih lanjut. Namun, tingkat kemenangan masih bagus setelah sinyal strategi memicu transaksi.
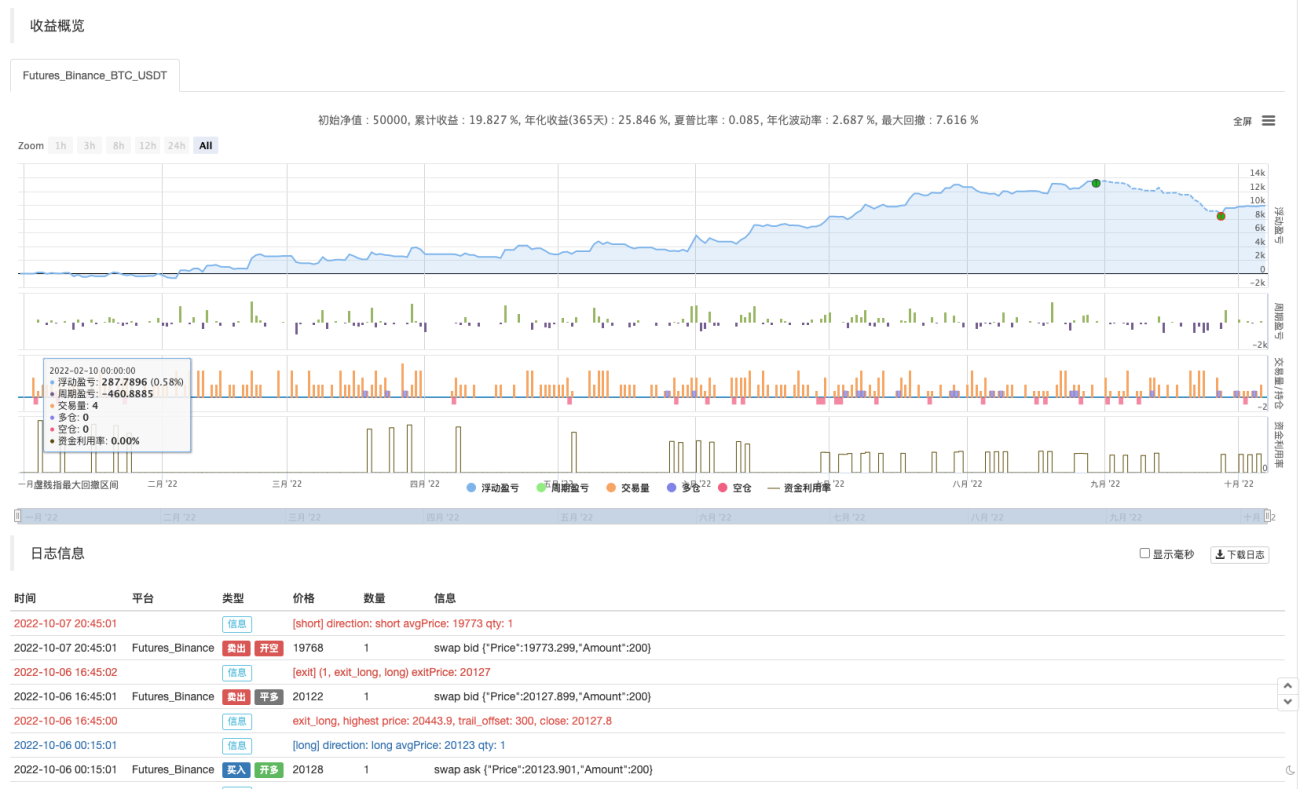
Mari kita coba kontrak perpetual BTC_USDT:
Hasil backtest pada BTC juga eksplosif:
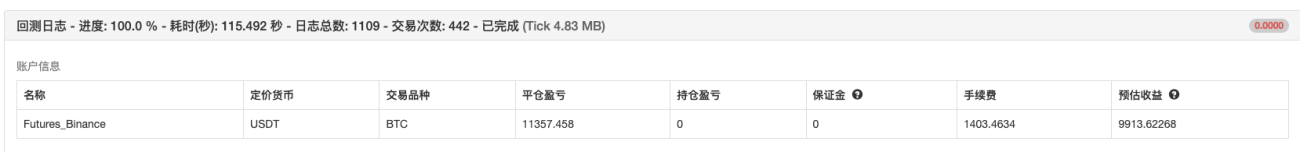
Alamat strategi: https://www.fmz.com/strategy/385745
Tampaknya metode perdagangan ini cukup andal untuk memahami tren, dan desainnya dapat dioptimalkan lebih lanjut berdasarkan ide ini. Dalam artikel ini, kita tidak hanya mempelajari ide strategi rata-rata pergerakan ganda, tetapi juga mempelajari cara memproses dan mempelajari strategi para master di YouTube. Oke, kode strategi di atas hanyalah saran saya. Hasil backtest tidak mewakili hasil aktual yang spesifik. Kode strategi dan desain hanya untuk referensi. Terima kasih atas dukungan Anda, sampai jumpa di lain waktu!


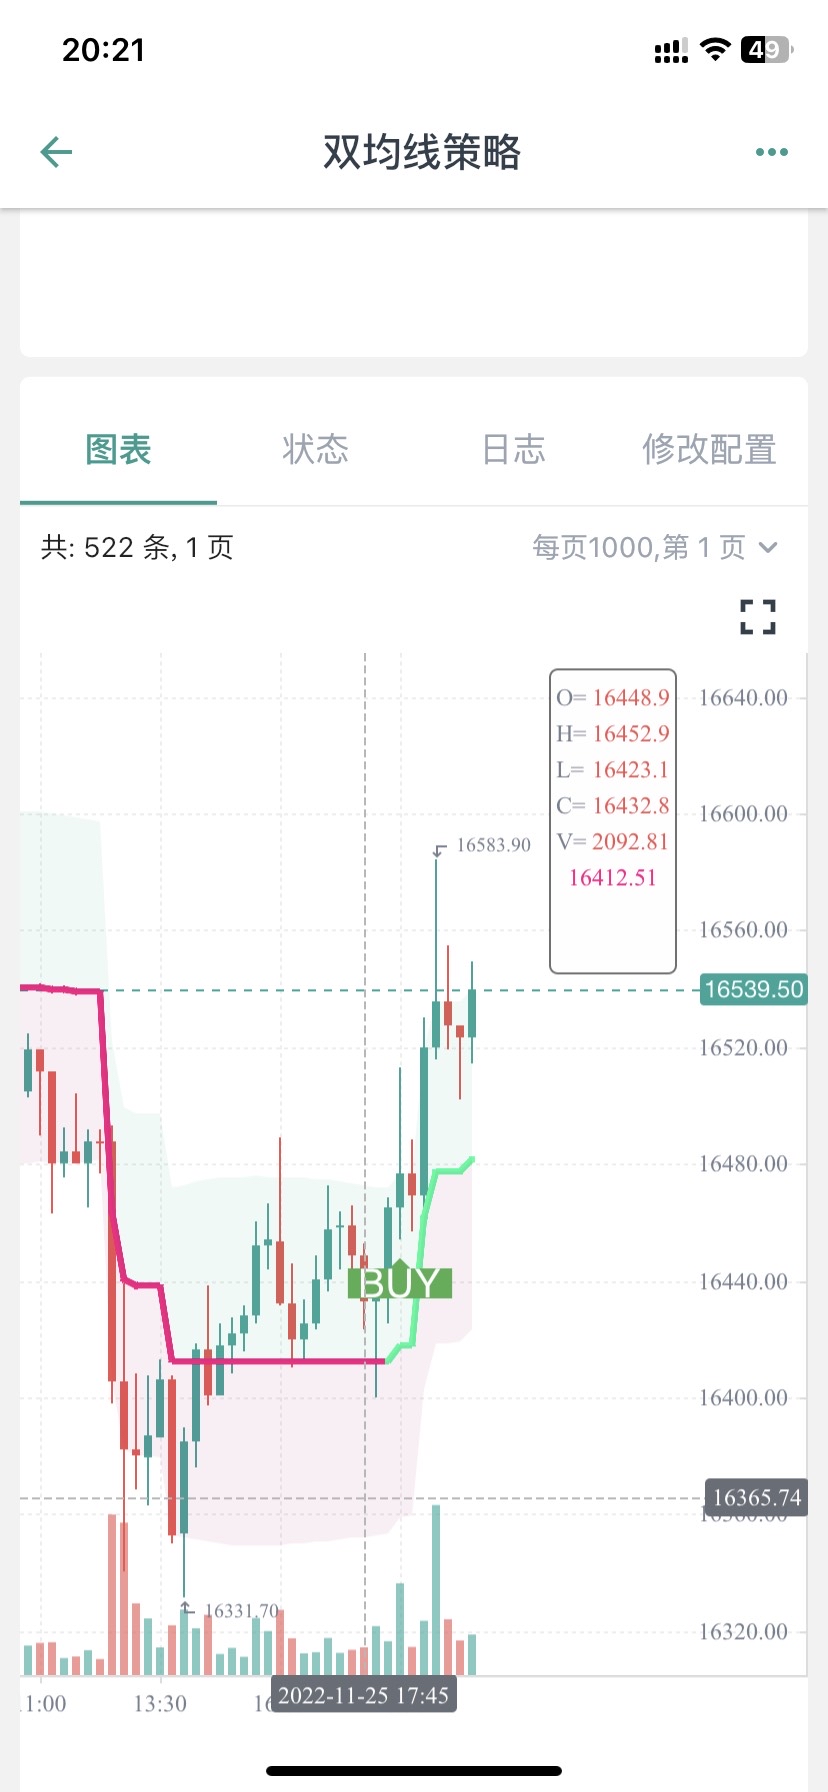


您好,这个是因为图表上显示的BUY标记只是文章中指标的信号显示,后面还结合了均线。
            //Plot Buy and Sell Labels
plotshape(longCondition, title = "Buy Signal", text ="BUY", textcolor = color.white, style=shape.labelup, size = size.normal, location=location.belowbar, color = color.new(color.green, 0))
plotshape(shortCondition, title = "Sell Signal", text ="SELL", textcolor = color.white, style=shape.labeldown, size = size.normal, location=location.abovebar, color = color.new(color.red, 0))
plotshape(longCondition, title = "Buy Signal", text ="BUY 画图显示时,只是longCondition条件符合了。
下单条件在这一块:
            if buyCondition and strategy.position_size == 0
    strategy.entry("long", strategy.long, amount)
    strategy.exit("exit_long", "long", amount, loss=loss, trail_points=trailPoints, trail_offset=trailOffset)
if sellCondition and strategy.position_size == 0
    strategy.entry("short", strategy.short, amount)
    strategy.exit("exit_short", "short", amount, loss=loss, trail_points=trailPoints, trail_offset=trailOffset)

梦大,建议从油管找两三个具有代表性的,改写难度较大,函数、参数、运算方式较多的策略做几个文字版的教程,比如带有类似【line.delete】这样的。(不需要策略盈利,就算是亏损的策略也无所谓,主要是用来学习写策略)。
我现在用这个双均线的策略,已经学会改一些不是非常复杂的组合策略了,改了十几个组合策略,其中有一两个确实是21年22年数据回测结果非常不错的,也已经在跑实盘测试了,但是遇到复杂函数参数运算这种【比如提示:line: 62 Could not find function or function reference 'line.delete',】而在FMZ PINE Script 文档并没有找到line.delete相关解释,用法说明,就懵圈了,所以希望梦大能弄点儿复杂策略改写一下,当然注释也多一些最好。就更方便学习了。[抱拳]
谢谢梦大。


梦大,请教下,PINE可以写复杂点儿的止盈方式吗?比如分层级止盈这样的???谢谢。
如果PINE可以和JS混编就好了,比如用PINE写指标,JS写交易部分就方便多了。。。。。
好的,谢谢梦大,另外请教下,PINE回测时间区间有限制吗?我选择2021年1月1日,到2022年10月11日,提示错误:
RuntimeError: abort(undefined) at Error at jsStackTrace (eval at self.onmessage (https://www.fmz.com/scripts/worker_detours.393054f7.js:1:147), <anonymous>:1:2096171) at stackTrace (eval at self.onmessage (https://www.fmz.com/scripts/worker_detours.393054f7.js:1:147), <anonymous>:1:2096345) at abort (eval at self.onmessage (https://www.fmz.com/scripts/worker_detours.393054f7.js:1:147), <anonymous>:1:2092408) at _abort (eval at self.onmessage (https://www.fmz.com/scripts/worker_detours.393054f7.js:1:147), <anonymous>:1:2137287) at <anonymous>:wasm-function[1297]:0x76bdc at <anonymous>:wasm-function[466]:0x3d789 at <anonymous>:wasm-function[477]:0x42e6b at <anonymous>:wasm-function[471]:0x4149e at <anonymous>:wasm-function[453]:0x3bf18 at <anonymous>:wasm-function[173]:0x13122
但是如果不改时间段就正常回测了。。。。 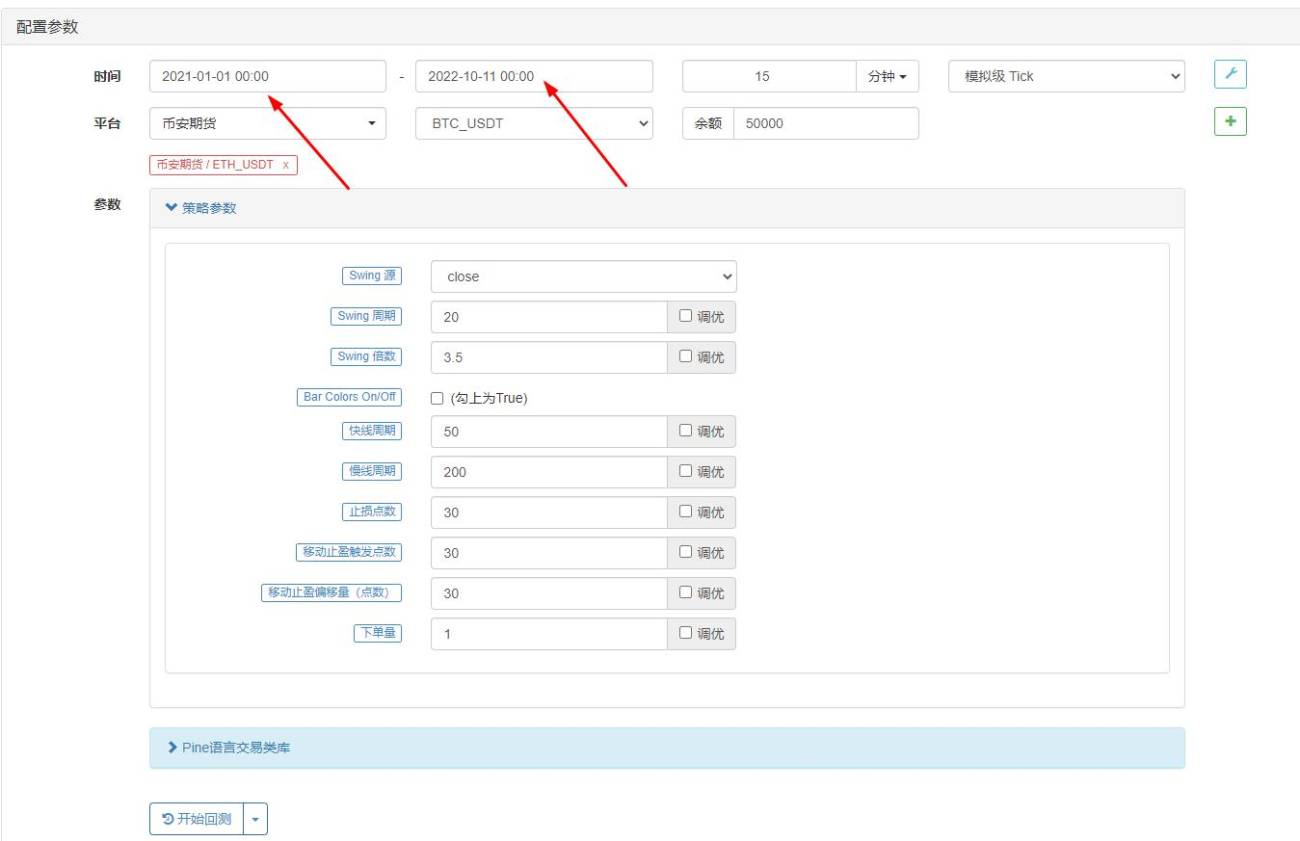

- 1