Mengimplementasikan Strategi Perdagangan Kuantitatif Mata Uang Digital Dual Thrust di Python
Penulis:Lydia, Dibuat: 2023-01-10 17:07:49, Diperbarui: 2023-09-20 10:53:48
Mengimplementasikan Strategi Perdagangan Kuantitatif Mata Uang Digital Dual Thrust di Python
Pendahuluan ke algoritma perdagangan Dual Thrust
Algoritma perdagangan dorongan ganda adalah strategi perdagangan kuantitatif terkenal yang dikembangkan oleh Michael Chalek. Ini biasanya digunakan di pasar futures, valuta asing dan saham. Konsep dorongan ganda adalah sistem perdagangan terobosan khas.
Dalam artikel ini, kami memberikan rincian logika rinci dari strategi ini dan menunjukkan cara menerapkan algoritma ini pada platform FMZ Quant. Pertama-tama, kita perlu memilih harga historis dari subjek yang akan diperdagangkan. Rentang ini dihitung berdasarkan harga penutupan, harga tertinggi dan harga terendah dari N hari terakhir. Ketika pasar bergerak kisaran tertentu dari harga pembukaan, buka posisi.
Kami menguji strategi ini dengan satu pasangan perdagangan di bawah dua kondisi pasar umum, yaitu pasar tren dan pasar kejutan. Hasilnya menunjukkan bahwa sistem perdagangan momentum bekerja lebih baik di pasar tren dan akan memicu beberapa sinyal perdagangan yang tidak valid di pasar yang tidak stabil. Di pasar interval, kami dapat menyesuaikan parameter untuk mendapatkan pengembalian yang lebih baik. Sebagai perbandingan target perdagangan referensi individu, kami juga menguji pasar berjangka komoditas domestik. Hasilnya menunjukkan bahwa strategi lebih baik daripada kinerja rata-rata.
Prinsip strategi DT
Prototype logisnya adalah strategi perdagangan intraday yang umum. Strategi terobosan rentang pembukaan didasarkan pada harga pembukaan hari ini ditambah atau dikurangi persentase tertentu dari rentang kemarin untuk menentukan jalur atas dan bawah. Ketika harga menyeberang jalur atas, itu akan membuka posisinya untuk membeli, dan ketika memecahkan jalur bawah, itu akan membuka posisinya untuk pergi pendek.
Prinsip strategi
-
Setelah penutupan, dua nilai dihitung: harga tertinggi - harga penutupan, dan harga penutupan - harga terendah. Kemudian ambil nilai yang lebih besar dari dua nilai dan kalikan nilainya dengan 0,7.
-
Setelah pasar dibuka keesokan harinya, catat harga pembukaan, dan beli segera ketika harga melebihi (harga pembukaan + nilai pemicu), atau jual posisi pendek ketika harga lebih rendah dari (harga pembukaan - nilai pemicu).
-
Strategi ini tidak memiliki stop loss yang jelas. Sistem ini adalah sistem terbalik, yaitu, jika ada pesanan posisi pendek ketika harga melebihi (harga pembukaan + nilai pemicu), itu akan mengirim dua pesanan beli (satu menutup posisi yang salah, yang lainnya membuka posisi yang benar). Untuk alasan yang sama, jika harga posisi panjang lebih rendah dari (harga pembukaan - nilai pemicu), itu akan mengirim dua pesanan jual.
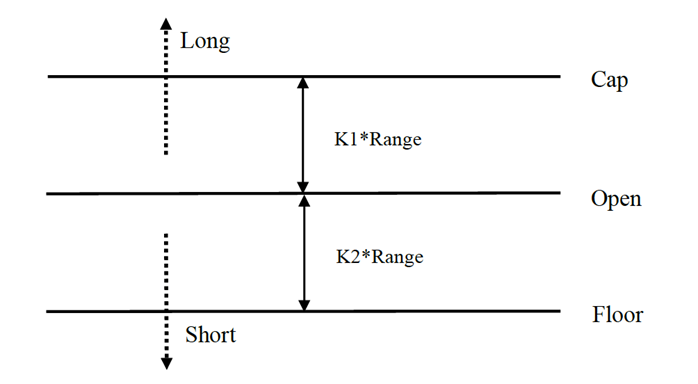
Ekspresi matematis dari strategi DT
Jangkauan = maksimum (HH-LC, HC-LL)
Metode perhitungan sinyal posisi panjang adalah:
cap = terbuka + K1 × Rangecap = terbuka + K1 × Range
Metode perhitungan sinyal posisi pendek adalah:
lantai = terbuka
Di mana K1 dan K2 adalah parameter. Ketika K1 lebih besar dari K2, sinyal posisi panjang dipicu, dan sebaliknya. Untuk demonstrasi, kita memilih K1 = K2 = 0.5. Dalam transaksi aktual, kita masih dapat menggunakan data historis untuk mengoptimalkan parameter ini atau menyesuaikan parameter sesuai dengan tren pasar. Jika Anda bullish, K1 harus kurang dari K2. Jika Anda bearish, K1 harus lebih besar dari K2.
Sistem ini adalah sistem pembalikan. Oleh karena itu, jika investor memegang posisi pendek ketika harga melintasi jalur atas, mereka harus menutup posisi pendek sebelum membuka posisi panjang. Jika investor memegang posisi panjang ketika harga melanggar jalur bawah, mereka harus menutup posisi panjang sebelum membuka posisi pendek baru.
Peningkatan strategi DT:
Dalam pengaturan kisaran, empat titik harga (tinggi, terbuka, rendah dan dekat) dari N hari sebelumnya diperkenalkan untuk membuat kisaran relatif stabil dalam periode tertentu, yang dapat diterapkan untuk pelacakan tren harian.
Kondisi pemicu pembukaan posisi panjang dan pendek dari strategi, mengingat kisaran asimetris, kisaran referensi transaksi panjang dan pendek harus memilih jumlah periode yang berbeda, yang juga dapat ditentukan oleh parameter K1 dan K2.
Oleh karena itu, ketika menggunakan strategi ini, di satu sisi, Anda dapat merujuk pada parameter terbaik dari backtesting data historis. Di sisi lain, Anda dapat menyesuaikan K1 dan K2 secara bertahap sesuai dengan penilaian Anda tentang masa depan atau indikator teknis periode utama lainnya.
Ini adalah metode perdagangan khas menunggu sinyal, memasuki pasar, arbitrase, dan kemudian meninggalkan pasar, tetapi efeknya sangat baik.
Menerapkan strategi DT pada platform FMZ Quant
Kita bukaFMZ.COM, masuk ke akun, klik Dashboard, dan menyebarkan docker dan robot.
Silakan lihat artikel saya sebelumnya tentang cara mengimplementasikan docker dan robot:https://www.fmz.com/bbs-topic/9864.
Pembaca yang ingin membeli server komputasi awan mereka sendiri untuk menyebarkan dockers dapat merujuk pada artikel ini:https://www.fmz.com/digest-topic/5711.
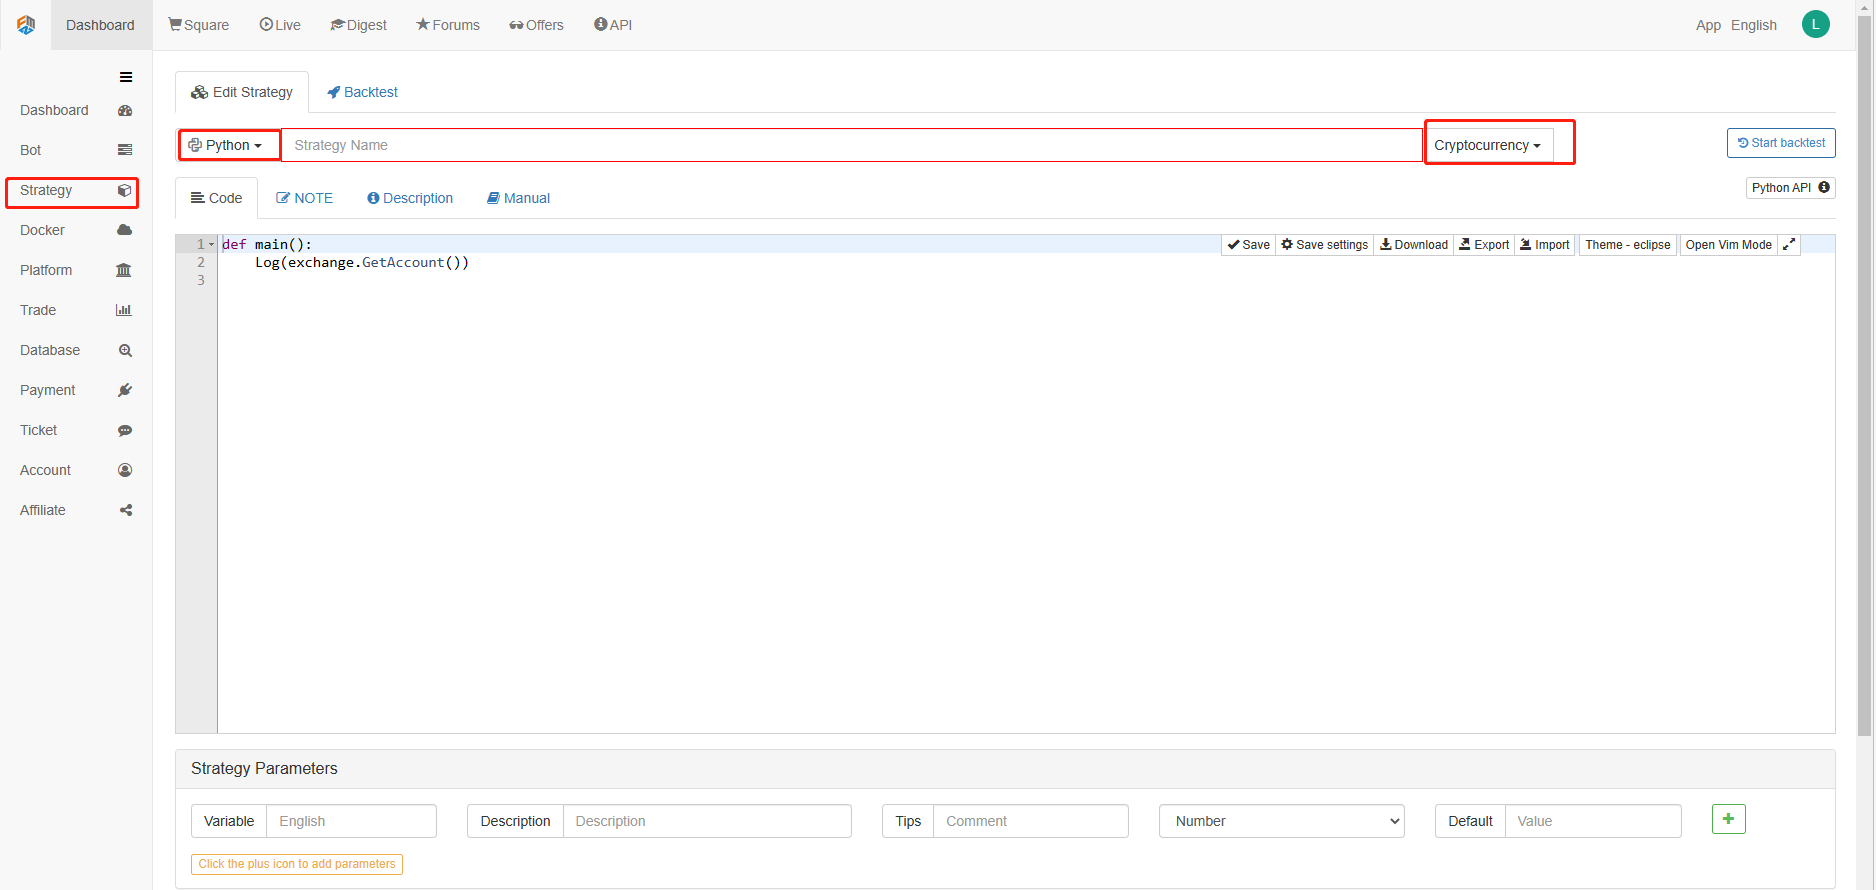
Selanjutnya, kita klik pada Perpustakaan Strategi di kolom kiri dan klik pada Tambahkan strategi.
Ingatlah untuk memilih bahasa pemrograman sebagai Python di sudut kanan atas halaman pengeditan strategi, seperti yang ditunjukkan pada gambar:
Selanjutnya, kita akan menulis kode Python ke dalam halaman pengeditan kode. kode berikut memiliki komentar baris demi baris yang sangat rinci, Anda dapat mengambil waktu Anda untuk memahami.
Kami akan menggunakan OKCoin berjangka untuk menguji strategi:
import time # Here we need to introduce the time library that comes with python, which will be used later in the program.

class Error_noSupport(BaseException): # We define a global class named ChartCfg to initialize the strategy chart settings. Object has many attributes about the chart function. Chart library: HighCharts.
    def __init__(self): # log out prompt messages
        Log("Support OKCoin Futures only! #FF0000")

class Error_AtBeginHasPosition(BaseException):
    def __init__(self):
        Log("Start with a futures position! #FF0000")

ChartCfg = {
    '__isStock': True, # This attribute is used to control whether to display a single control data series (you can cancel the display of a single data series on the chart). If you specify __isStock: false, it will be displayed as a normal chart.
    'title': { # title is the main title of the chart
        'text': 'Dual Thrust upper and bottom track chart' # An attribute of the title text is the text of the title, here set to 'Dual Thrust upper and bottom track chart' the text will be displayed in the title position.
    },
    'yAxis': { # Settings related to the Y-axis of the chart coordinate.
        'plotLines': [{ # Horizontal lines on the Y-axis (perpendicular to the Y-axis), the value of this attribute is an array, i.e. the setting of multiple horizontal lines.
            'value': 0, # Coordinate value of horizontal line on Y-axis
            'color': 'red', # Color of horizontal line
            'width': 2, # Line width of horizontal line
            'label': {  # Labels on the horizontal line
                'text': 'Upper track', # Text of the label
                'align': 'center' # The display position of the label, here set to center (i.e.: 'center')
            },
        }, {       # The second horizontal line ([{...} , {...}] the second element in the array)
            'value': 0, # Coordinate value of horizontal line on Y-axis
            'color': 'green', # Color of horizontal line
            'width': 2,  # Line width of horizontal line
            'label': { # Label
                'text': 'bottom track',
                'align': 'center'
            },
        }]
    },
    'series': [{ # Data series, that is, data used to display data lines, K-lines, tags, and other contents on the chart. It is also an array whose first index is 0.
        'type': 'candlestick', # Type of data series with index 0: 'candlestick' indicates a K-line chart.
        'name': 'Current period',  # Name of the data series
        'id': 'primary', # The ID of the data series, which is used for the related settings of the next data series.
        'data': []  # An array of data series to store specific K-line data
    }, {
        'type': 'flags',  # Data series, type: 'flags', display labels on the chart, indicating going long and going short. Index is 1.
        'onSeries': 'primary',  # This attribute indicates that the label is displayed on id 'primary'.
        'data': []    # The array that holds the label data.
    }]
}

STATE_IDLE = 0  # Status constants, indicating idle
STATE_LONG = 1 # Status constants, indicating long positions
STATE_SHORT = 2 # Status constants, indicating short positions
State = STATE_IDLE # Indicates the current program status, assigned as idle initially

LastBarTime = 0  # The time stamp of the last column of the K-line (in milliseconds, 1000 milliseconds is equal to 1 second, and the timestamp is the number of milliseconds from January 1, 1970 to the present time is a large positive integer).
UpTrack = 0   # Upper track value
BottomTrack = 0 # Bottom track value
chart = None # It is used to accept the chart control object returned by the Chart API function. Use this object (chart) to call its member function to write data to the chart.
InitAccount = None # Initial account status
LastAccount = None # Latest account status
Counter = { # Counters for recording profit and loss counts
    'w': 0, # Number of wins
    'l': 0  # Number of losses
}

def GetPosition(posType):  # Define a function to store account position information
    positions = exchange.GetPosition() # exchange.GetPosition() is the FMZ Quant official API. For its usage, please refer to the official API document: https://www.fmz.com/api.
    return [{'Price': position['Price'], 'Amount': position['Amount']} for position in positions if position['Type'] == posType] # Return to various position information

def CancelPendingOrders(): # Define a function specifically for withdrawing orders
    while True: # Loop check
        orders = exchange.GetOrders() # If there is a position
        [exchange.CancelOrder(order['Id']) for order in orders if not Sleep(500)] # Withdrawal statement
        if len(orders) == 0: # Logical judgment
            break

def Trade(currentState,nextState): # Define a function to determine the order placement logic.
    global InitAccount,LastAccount,OpenPrice,ClosePrice # Define the global scope
    ticker = _C(exchange.GetTicker) # For the usage of _C, please refer to: https://www.fmz.com/api.
    slidePrice = 1 # Define the slippage value
    pfn = exchange.Buy if nextState == STATE_LONG else exchange.Sell # Buying and selling judgment logic
    if currentState != STATE_IDLE: # Loop start
        Log(_C(exchange.GetPosition)) # Log information
        exchange.SetDirection("closebuy" if currentState == STATE_LONG else "closesell") # Adjust the order direction, especially after placing the order.
        while True:
            ID = pfn( (ticker['Last'] - slidePrice) if currentState == STATE_LONG else (ticker['Last'] + slidePrice), AmountOP) # Price limit order, ID=pfn (- 1, AmountOP) is the market price order, ID=pfn (AmountOP) is the market price order.
            Sleep(Interval) # Take a break to prevent the API from being accessed too often and your account being blocked.
            Log(exchange.GetOrder(ID)) # Log information
            ClosePrice = (exchange.GetOrder(ID))['AvgPrice'] # Set the closing price
            CancelPendingOrders() # Call the withdrawal function
            if len(GetPosition(PD_LONG if currentState == STATE_LONG else PD_SHORT)) == 0: # Order withdrawal logic
                break
        account = exchange.GetAccount() # Get account information
        if account['Stocks'] > LastAccount['Stocks']: # If the current account currency value is greater than the previous account currency value.
            Counter['w'] += 1 # In the profit and loss counter, add one to the number of profits.
        else:
            Counter['l'] += 1 # Otherwise, add one to the number of losses.
        Log(account) # log information
        LogProfit((account['Stocks'] - InitAccount['Stocks']),"Return rates:", ((account['Stocks'] - InitAccount['Stocks']) * 100 / InitAccount['Stocks']),'%')
        Cal(OpenPrice,ClosePrice)
        LastAccount = account

    exchange.SetDirection("buy" if nextState == STATE_LONG else "sell") # The logic of this part is the same as above and will not be elaborated.
    Log(_C(exchange.GetAccount))
    while True:
        ID = pfn( (ticker['Last'] + slidePrice) if nextState == STATE_LONG else (ticker['Last'] - slidePrice), AmountOP)
        Sleep(Interval)
        Log(exchange.GetOrder(ID))
        CancelPendingOrders()
        pos = GetPosition(PD_LONG if nextState == STATE_LONG else PD_SHORT)
        if len(pos) != 0:
            Log("Average price of positions",pos[0]['Price'],"Amount:",pos[0]['Amount'])
            OpenPrice = (exchange.GetOrder(ID))['AvgPrice']
            Log("now account:",exchange.GetAccount())
            break

def onTick(exchange): # The main function of the program, within which the main logic of the program is processed.
    global LastBarTime,chart,State,UpTrack,DownTrack,LastAccount # Define the global scope
    records = exchange.GetRecords() # For the usage of exchange.GetRecords(), please refer to: https://www.fmz.com/api.
    if not records or len(records) <= NPeriod: # Judgment statements to prevent accidents.
        return
    Bar = records[-1] # Take the penultimate element of records K-line data, that is, the last bar.
    if LastBarTime != Bar['Time']:
        HH = TA.Highest(records, NPeriod, 'High')  # Declare the HH variable, call the TA.Highest function to calculate the maximum value of the highest price in the current K-line data NPeriod period and assign it to HH.
        HC = TA.Highest(records, NPeriod, 'Close') # Declare the HC variable to get the maximum value of the closing price in the NPeriod period.
        LL = TA.Lowest(records, NPeriod, 'Low') # Declare the LL variable to get the minimum value of the lowest price in the NPeriod period.
        LC = TA.Lowest(records, NPeriod, 'Close') # Declare LC variable to get the minimum value of the closing price in the NPeriod period. For specific TA-related applications, please refer to the official API documentation.

        Range = max(HH - LC, HC - LL)  # Calculate the range
        UpTrack = _N(Bar['Open'] + (Ks * Range))  # The upper track value is calculated based on the upper track factor Ks of the interface parameters such as the opening price of the latest K-line bar.
        DownTrack = _N(Bar['Open'] - (Kx * Range)) # Calculate the down track value
        if LastBarTime > 0: # Because the value of LastBarTime initialization is set to 0, LastBarTime>0 must be false when running here for the first time. The code in the if block will not be executed, but the code in the else block will be executed.
            PreBar = records[-2] # Declare a variable means "the previous Bar" assigns the value of the penultimate Bar of the current K-line to it.
            chart.add(0, [PreBar['Time'], PreBar['Open'], PreBar['High'], PreBar['Low'], PreBar['Close']], -1) # Call the add function of the chart icon control class to update the K-line data (use the penultimate bar of the obtained K-line data to update the last bar of the icon, because a new K-line bar is generated).
        else:  # For the specific usage of the chart.add function, see the API documentation and the articles in the forum. When the program runs for the first time, it must execute the code in the else block. The main function is to add all the K-lines obtained for the first time to the chart at one time.
            for i in range(len(records) - min(len(records), NPeriod * 3), len(records)): # Here, a for loop is executed. The number of loops uses the minimum of the K-line length and 3 times the NPeriod, which can ensure that the initial K-line will not be drawn too much and too long. Indexes vary from large to small.
                b = records[i] # Declare a temporary variable b to retrieve the K-line bar data with the index of records.length - i for each loop.
                chart.add(0,[b['Time'], b['Open'], b['High'], b['Low'], b['Close']]) # Call the chart.add function to add a K-line bar to the chart. Note that if the last parameter of the add function is passed in -1, it will update the last Bar (column) on the chart. If no parameter is passed in, it will add Bar to the last. After executing the loop of i=2 (i-- already, now it's 1), it will trigger i > 1 for false to stop the loop. It can be seen that the code here only processes the bar of records.length - 2, and the last Bar is not processed.
        chart.add(0,[Bar['Time'], Bar['Open'], Bar['High'], Bar['Low'], Bar['Close']]) # Since the two branches of the above if do not process the bar of records.length - 1, it is processed here. Add the latest Bar to the chart.
        ChartCfg['yAxis']['plotLines'][0]['value'] = UpTrack  # Assign the calculated upper track value to the chart object (different from the chart control object chart) for later display.
        ChartCfg['yAxis']['plotLines'][1]['value'] = DownTrack # Assign lower track value
        ChartCfg['subtitle'] = { # Set subtitle
            'text': 'upper tarck' + str(UpTrack) + 'down track' + str(DownTrack) # Subtitle text setting. The upper and down track values are displayed on the subtitle.
        }
        chart.update(ChartCfg) # Update charts with chart class ChartCfg.
        chart.reset(PeriodShow) # Refresh the PeriodShow variable set according to the interface parameters, and only keep the K-line bar of the number of PeriodShow values.

        LastBarTime = Bar['Time'] # The timestamp of the newly generated Bar is updated to LastBarTime to determine whether the last Bar of the K-line data acquired in the next loop is a newly generated one.
    else: # If LastBarTime is equal to Bar.Time, that is, no new K-line Bar is generated. Then execute the code in {..}.
        chart.add(0,[Bar['Time'], Bar['Open'], Bar['High'], Bar['Low'], Bar['Close']], -1) # Update the last K-line bar on the chart with the last Bar of the current K-line data (the last Bar of the K-line, i.e. the Bar of the current period, is constantly changing).
    LogStatus("Price:", Bar["Close"], "up:", UpTrack, "down:", DownTrack, "wins:", Counter['w'], "losses:", Counter['l'], "Date:", time.time()) # The LogStatus function is called to display the data of the current strategy on the status bar.
    msg = "" # Define a variable msg.
    if State == STATE_IDLE or State == STATE_SHORT: # Judge whether the current state variable State is equal to idle or whether State is equal to short position. In the idle state, it can trigger long position, and in the short position state, it can trigger a long position to be closed and sell the opening position.
        if Bar['Close'] >= UpTrack: # If the closing price of the current K-line is greater than the upper track value, execute the code in the if block.
            msg = "Go long, trigger price:" + str(Bar['Close']) + "upper track" + str(UpTrack) # Assign a value to msg and combine the values to be displayed into a string.
            Log(msg) # message
            Trade(State, STATE_LONG) # Call the Trade function above to trade.
            State = STATE_LONG # Regardless of opening long positions or selling the opening position, the program status should be updated to hold long positions at the moment.
            chart.add(1,{'x': Bar['Time'], 'color': 'red', 'shape': 'flag', 'title': 'long', 'text': msg}) # Add a marker to the corresponding position of the K-line to show the open long position.

    if State == STATE_IDLE or State == STATE_LONG: # The short direction is the same as the above, and will not be repeated. The code is exactly the same.
        if Bar['Close'] <= DownTrack:
            msg = "Go short, trigger price:" + str(Bar['Close']) + "down track" + str(DownTrack)
            Log(msg)
            Trade(State, STATE_SHORT)
            State = STATE_SHORT
            chart.add(1,{'x': Bar['Time'], 'color': 'green', 'shape': 'circlepin', 'title': 'short', 'text': msg})

OpenPrice = 0 # Initialize OpenPrice and ClosePrice
ClosePrice = 0
def Cal(OpenPrice, ClosePrice): # Define a Cal function to calculate the profit and loss of the strategy after it has been run.
    global AmountOP,State
    if State == STATE_SHORT:
        Log(AmountOP,OpenPrice,ClosePrice,"Profit and loss of the strategy:", (AmountOP * 100) / ClosePrice - (AmountOP * 100) / OpenPrice, "Currencies, service charge:", - (100 * AmountOP * 0.0003), "USD, equivalent to:", _N( - 100 * AmountOP * 0.0003/OpenPrice,8), "Currencies")
        Log(((AmountOP * 100) / ClosePrice - (AmountOP * 100) / OpenPrice) + (- 100 * AmountOP * 0.0003/OpenPrice))
    if State == STATE_LONG:
        Log(AmountOP,OpenPrice,ClosePrice,"Profit and loss of the strategy:", (AmountOP * 100) / OpenPrice - (AmountOP * 100) / ClosePrice, "Currencies, service charge:", - (100 * AmountOP * 0.0003), "USD, equivalent to:", _N( - 100 * AmountOP * 0.0003/OpenPrice,8), "Currencies")
        Log(((AmountOP * 100) / OpenPrice - (AmountOP * 100) / ClosePrice) + (- 100 * AmountOP * 0.0003/OpenPrice))

def main(): # The main function of the strategy program. (entry function)
    global LoopInterval,chart,LastAccount,InitAccount # Define the global scope
    if exchange.GetName() != 'Futures_OKCoin':  # Judge if the name of the added exchange object (obtained by the exchange.GetName function) is not equal to 'Futures_OKCoin', that is, the object added is not OKCoin futures exchange object.
        raise Error_noSupport # Throw an exception
    exchange.SetRate(1) # Set various parameters of the exchange.
    exchange.SetContractType(["this_week","next_week","quarter"][ContractTypeIdx])  # Determine which specific contract to trade.
    exchange.SetMarginLevel([10,20][MarginLevelIdx]) # Set the margin rate, also known as leverage.

    if len(exchange.GetPosition()) > 0: # Set up fault tolerance mechanism.
        raise Error_AtBeginHasPosition
    CancelPendingOrders()
    InitAccount = LastAccount = exchange.GetAccount()
    LoopInterval = min(1,LoopInterval)
    Log("Trading platforms:",exchange.GetName(), InitAccount)
    LogStatus("Ready...")

    LogProfitReset()
    chart = Chart(ChartCfg)
    chart.reset()

    LoopInterval = max(LoopInterval, 1)
    while True: # Loop the whole transaction logic and call the onTick function.
        onTick(exchange)
        Sleep(LoopInterval * 1000) # Take a break to prevent the API from being accessed too frequently and the account from being blocked.
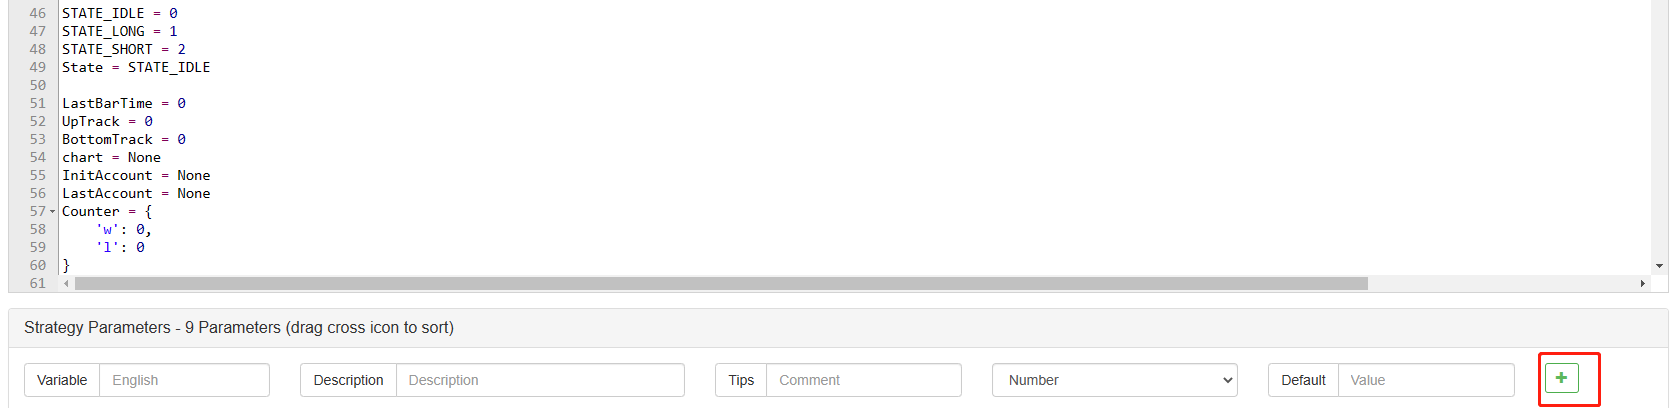
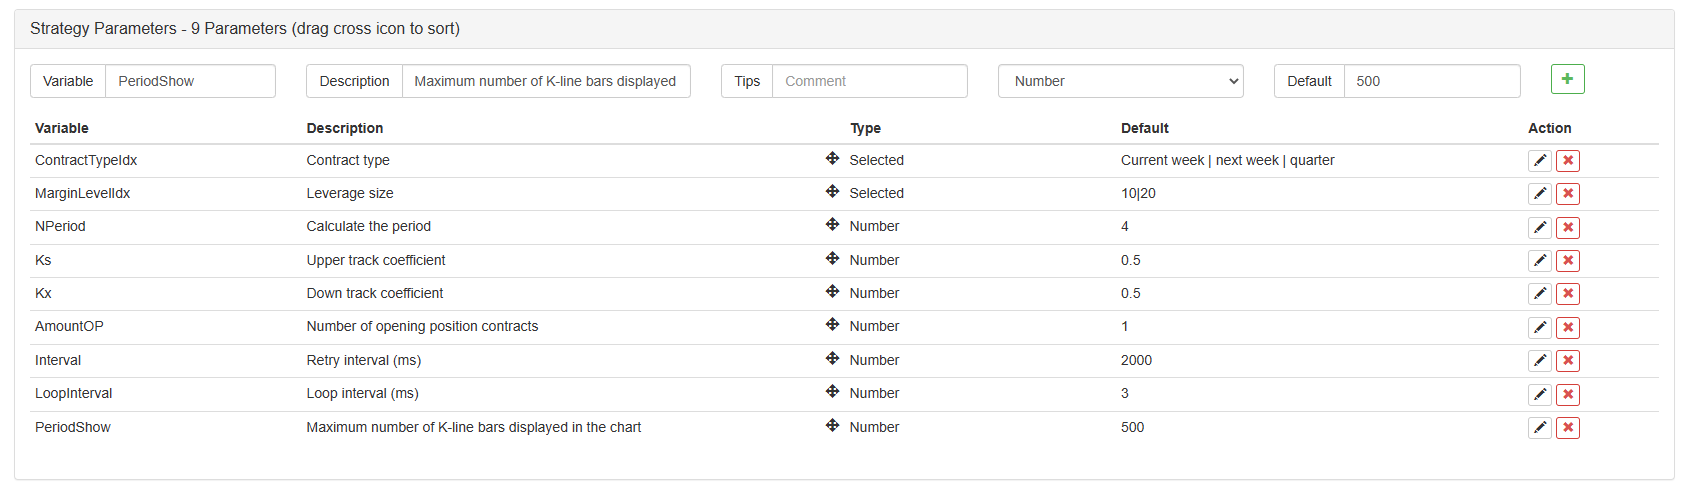
Setelah menulis kode, harap dicatat bahwa kita belum menyelesaikan seluruh strategi. Selanjutnya, kita perlu menambahkan parameter yang digunakan dalam strategi ke halaman pengeditan strategi. Metode penambahan sangat sederhana. Cukup klik tanda plus di bagian bawah kotak dialog penulisan strategi untuk menambahkan satu per satu.
Isi yang akan ditambahkan:
Sejauh ini, kita akhirnya telah menyelesaikan penulisan strategi. Selanjutnya, mari kita mulai backtesting strategi.
Strategi backtesting
Setelah menulis strategi, hal pertama yang perlu kita lakukan adalah melakukan backtest untuk melihat bagaimana perilakunya dalam data historis. Tetapi harap dicatat bahwa hasil backtest tidak sama dengan prediksi masa depan. Backtest hanya dapat digunakan sebagai referensi untuk mempertimbangkan efektivitas strategi kita. Setelah pasar berubah dan strategi mulai mengalami kerugian besar, kita harus menemukan masalah tepat waktu, dan kemudian mengubah strategi untuk beradaptasi dengan lingkungan pasar baru, seperti ambang batas yang disebutkan di atas. Jika strategi memiliki kerugian lebih besar dari 10%, kita harus segera menghentikan operasi strategi, dan kemudian menemukan masalah. Kita dapat mulai dengan menyesuaikan ambang batas.
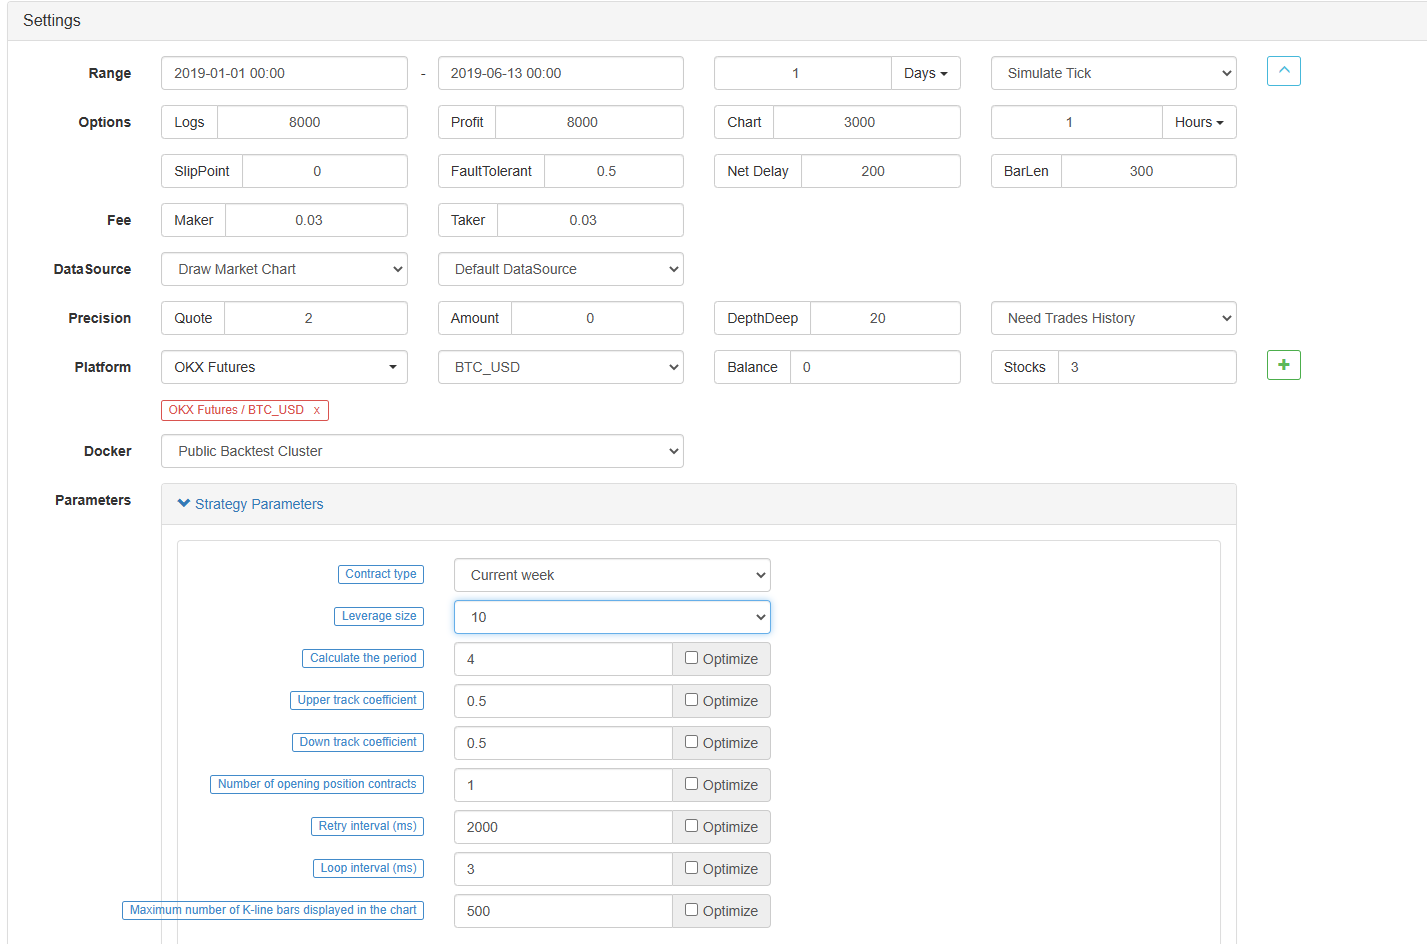
Klik backtest di halaman editing strategi. Pada halaman backtest, penyesuaian parameter dapat dilakukan dengan mudah dan cepat sesuai dengan kebutuhan yang berbeda. Terutama untuk strategi dengan logika yang kompleks dan banyak parameter, tidak perlu kembali ke kode sumber dan memodifikasinya satu per satu.
Waktu backtest adalah enam bulan terakhir. Klik Add OKCoin Futures exchange dan pilih target perdagangan BTC.
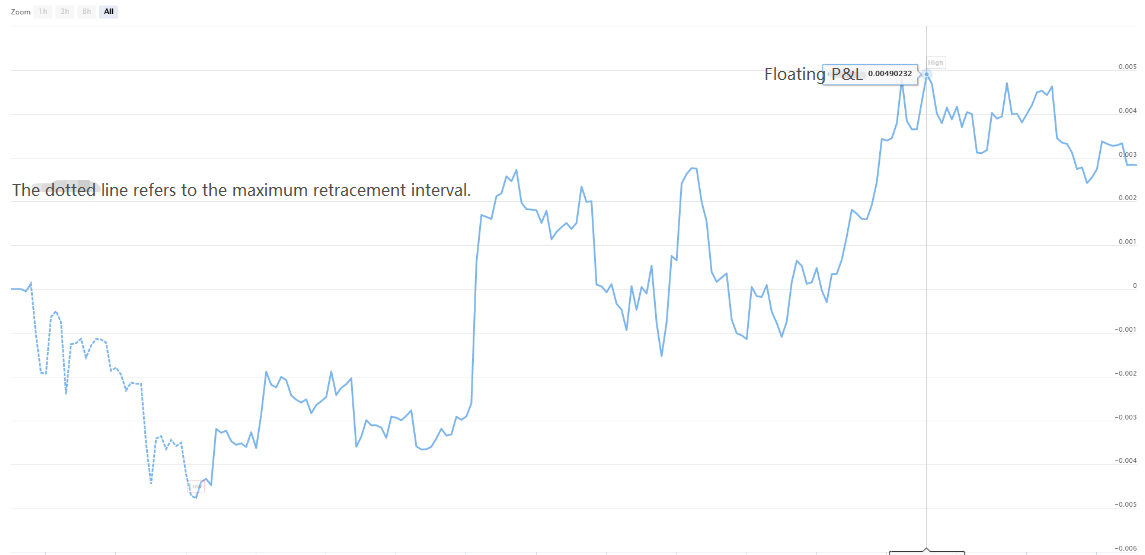
Hal ini dapat dilihat bahwa strategi telah menuai hasil yang baik dalam enam bulan terakhir karena tren unilateral BTC yang sangat baik.

Jika Anda memiliki pertanyaan, Anda dapat meninggalkan pesan dihttps://www.fmz.com/bbs, apakah itu tentang strategi atau teknologi platform, platform FMZ Quant memiliki para profesional siap menjawab pertanyaan Anda.
- Mengkuantifikasi Analisis Fundamental di Pasar Cryptocurrency: Biarkan Data Berbicara Sendiri!
- Di sini, saya akan membahas beberapa hal yang sangat penting tentang penelitian kuantitatif dasar dalam lingkaran mata uang - jangan percaya lagi pada guru-guru sihir yang bodoh, data berbicara secara obyektif!
- Alat penting dalam bidang transaksi kuantitatif - inventor modul eksplorasi data kuantitatif
- Menguasai Semuanya - Pendahuluan ke FMZ Versi Baru Terminal Trading (dengan TRB Arbitrage Source Code)
- Untuk mengetahui semua tentang FMZ, silahkan kunjungi situs resmi FMZ.
- FMZ Quant: Analisis Contoh Desain Persyaratan Umum di Pasar Cryptocurrency (II)
- Cara Mengeksploitasi Robot Penjual Tanpa Otak dengan Strategi Frekuensi Tinggi dalam 80 Baris Kode
- FMZ Kuantitas: Perencanaan Contoh Desain Permintaan Umum di Pasar Cryptocurrency (II)
- Cara Mengeksploitasi Robot Tanpa Otak untuk Dijual dengan Strategi Frekuensi Tinggi 80 Baris Kode
- FMZ Quant: Analisis Contoh Desain Persyaratan Umum di Pasar Cryptocurrency (I)
- Kuantitas FMZ: Perbedaan antara permintaan umum pasar cryptocurrency dan contoh desain (1)