Penelitian tentang Binance Futures Multi-Values Hedging Strategy Bagian 4
Penulis:Kebaikan, Dibuat: 2020-05-14 15:18:56, Diperbarui: 2023-11-04 19:51:33
Binance futures multi-currency strategi lindung nilai
Tiga laporan penelitian tentang strategi lindung nilai multi-mata uang Binance telah diterbitkan, inilah yang keempat. hubungan dari tiga artikel pertama, Anda harus membacanya lagi jika Anda belum membacanya, Anda dapat memahami gagasan pembentukan strategi, pengaturan parameter spesifik dan logika strategi.
Penelitian tentang Binance Futures Multi-currency Hedging Strategy Bagian 1:https://www.fmz.com/digest-topic/5584
Penelitian tentang Binance Futures Multi-currency Hedging Strategy Bagian 2:https://www.fmz.com/digest-topic/5588
Penelitian tentang Binance Futures Multi-currency Hedging Strategy Bagian 3:https://www.fmz.com/digest-topic/5605
Artikel ini adalah untuk meninjau situasi pasar yang sebenarnya dalam beberapa minggu terakhir, dan meringkas keuntungan dan kerugian.
# Libraries to import
import pandas as pd
import requests
import matplotlib.pyplot as plt
import seaborn as sns
import numpy as np
%matplotlib inline
symbols = ['BTC','ETH', 'BCH', 'XRP', 'EOS', 'LTC', 'TRX', 'ETC', 'LINK', 'XLM', 'ADA', 'XMR', 'DASH', 'ZEC', 'XTZ', 'BNB', 'ATOM', 'ONT', 'IOTA', 'BAT', 'VET', 'NEO', 'QTUM', 'IOST']
Data baris tingkat K menit
Data dari 21 Februari hingga 15 April pukul dua sore, total 77160 * 24, yang sangat mengurangi kecepatan backtest kami, mesin backtest tidak cukup efisien, Anda dapat mengoptimalkan sendiri.
price_usdt = pd.read_csv('https://www.fmz.com/upload/asset/2b1fa7ab641385067ad.csv',index_col = 0)
price_usdt.shape
(77160, 24)
price_usdt.index = pd.to_datetime(price_usdt.index,unit='ms')
price_usdt_norm = price_usdt/price_usdt.fillna(method='bfill').iloc[0,]
price_usdt_btc = price_usdt.divide(price_usdt['BTC'],axis=0)
price_usdt_btc_norm = price_usdt_btc/price_usdt_btc.fillna(method='bfill').iloc[0,]
class Exchange:

    def __init__(self, trade_symbols, leverage=20, commission=0.00005,  initial_balance=10000, log=False):
        self.initial_balance = initial_balance # Initial asset
        self.commission = commission
        self.leverage = leverage
        self.trade_symbols = trade_symbols
        self.date = ''
        self.log = log
        self.df = pd.DataFrame(columns=['margin','total','leverage','realised_profit','unrealised_profit'])
        self.account = {'USDT':{'realised_profit':0, 'margin':0, 'unrealised_profit':0, 'total':initial_balance, 'leverage':0, 'fee':0}}
        for symbol in trade_symbols:
            self.account[symbol] = {'amount':0, 'hold_price':0, 'value':0, 'price':0, 'realised_profit':0, 'margin':0, 'unrealised_profit':0,'fee':0}

    def Trade(self, symbol, direction, price, amount, msg=''):
        if self.date and self.log:
            print('%-20s%-5s%-5s%-10.8s%-8.6s %s'%(str(self.date), symbol, 'buy' if direction == 1 else 'sell', price, amount, msg))

        cover_amount = 0 if direction*self.account[symbol]['amount'] >=0 else min(abs(self.account[symbol]['amount']), amount)
        open_amount = amount - cover_amount

        self.account['USDT']['realised_profit'] -= price*amount*self.commission # Minus handling fee
        self.account['USDT']['fee'] += price*amount*self.commission
        self.account[symbol]['fee'] += price*amount*self.commission

        if cover_amount > 0: # close position first
            self.account['USDT']['realised_profit'] += -direction*(price - self.account[symbol]['hold_price'])*cover_amount  # profit
            self.account['USDT']['margin'] -= cover_amount*self.account[symbol]['hold_price']/self.leverage # Free margin

            self.account[symbol]['realised_profit'] += -direction*(price - self.account[symbol]['hold_price'])*cover_amount
            self.account[symbol]['amount'] -= -direction*cover_amount
            self.account[symbol]['margin'] -=  cover_amount*self.account[symbol]['hold_price']/self.leverage
            self.account[symbol]['hold_price'] = 0 if self.account[symbol]['amount'] == 0 else self.account[symbol]['hold_price']

        if open_amount > 0:
            total_cost = self.account[symbol]['hold_price']*direction*self.account[symbol]['amount'] + price*open_amount
            total_amount = direction*self.account[symbol]['amount']+open_amount

            self.account['USDT']['margin'] +=  open_amount*price/self.leverage
            self.account[symbol]['hold_price'] = total_cost/total_amount
            self.account[symbol]['amount'] += direction*open_amount
            self.account[symbol]['margin'] +=  open_amount*price/self.leverage

        self.account[symbol]['unrealised_profit'] = (price - self.account[symbol]['hold_price'])*self.account[symbol]['amount']
        self.account[symbol]['price'] = price
        self.account[symbol]['value'] = abs(self.account[symbol]['amount'])*price

        return True

    def Buy(self, symbol, price, amount, msg=''):
        self.Trade(symbol, 1, price, amount, msg)

    def Sell(self, symbol, price, amount, msg=''):
        self.Trade(symbol, -1, price, amount, msg)

    def Update(self, date, close_price): # Update assets
        self.date = date
        self.close = close_price
        self.account['USDT']['unrealised_profit'] = 0
        for symbol in self.trade_symbols:
            if np.isnan(close_price[symbol]):
                continue
            self.account[symbol]['unrealised_profit'] = (close_price[symbol] - self.account[symbol]['hold_price'])*self.account[symbol]['amount']
            self.account[symbol]['price'] = close_price[symbol]
            self.account[symbol]['value'] = abs(self.account[symbol]['amount'])*close_price[symbol]
            self.account['USDT']['unrealised_profit'] += self.account[symbol]['unrealised_profit']

        self.account['USDT']['total'] = round(self.account['USDT']['realised_profit'] + self.initial_balance + self.account['USDT']['unrealised_profit'],6)
        self.account['USDT']['leverage'] = round(self.account['USDT']['margin']/self.account['USDT']['total'],4)*self.leverage
        self.df.loc[self.date] = [self.account['USDT']['margin'],self.account['USDT']['total'],self.account['USDT']['leverage'],self.account['USDT']['realised_profit'],self.account['USDT']['unrealised_profit']]
Tinjauan minggu lalu
Strategi ini dirilis di grup WeChat pada tanggal 10 April. Pada awalnya, sekelompok orang menjalankan strategi 2 ((pendek over-rise dan long over-fall). Pada tiga hari pertama, pengembalian sangat baik, dan retracement sangat rendah. pada hari-hari berikutnya, beberapa pedagang memperbesar leverage, beberapa bahkan menggunakan seluruh jumlah dana mereka untuk beroperasi, dan keuntungan mencapai 10% dalam satu hari. Strategy Square juga merilis banyak strategi pasar nyata, banyak orang mulai tidak puas dengan parameter yang direkomendasikan konservatif, dan telah memperkuat volume transaksi. Setelah 13 April, karena tren independen BNB
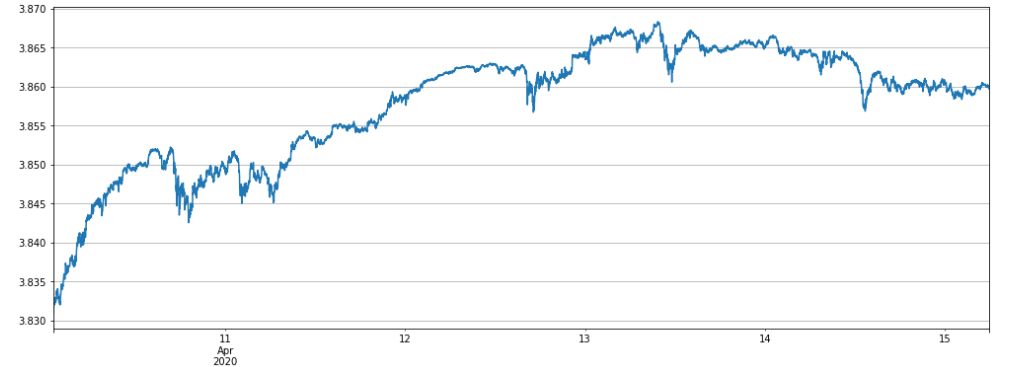
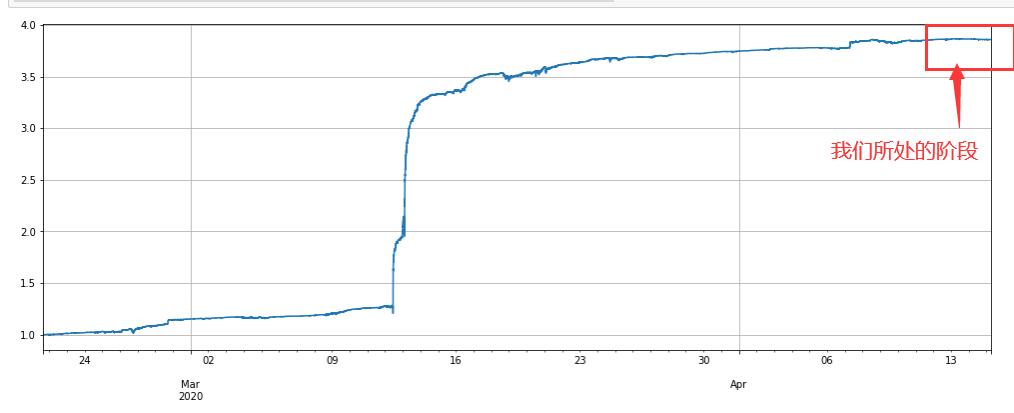
Mari kita lihat backtest mata uang penuh dari Strategi 2. Di sini, karena ini adalah pembaruan tingkat menit, parameter Alpha perlu disesuaikan. Dari sudut pandang pasar nyata, tren kurva konsisten, menunjukkan bahwa backtest kami dapat digunakan sebagai referensi yang kuat. Nilai bersih telah mencapai puncak nilai bersih dari 4.13 dan seterusnya dan telah berada dalam fase retracement dan sisi.
Alpha = 0.001
#price_usdt_btc_norm2 = price_usdt_btc/price_usdt_btc.rolling(20).mean() # Ordinary moving average
price_usdt_btc_norm2 = price_usdt_btc/price_usdt_btc.ewm(alpha=Alpha).mean() # Here is consistent with the strategy, using EMA
trade_symbols = list(set(symbols))
price_usdt_btc_norm_mean = price_usdt_btc_norm2[trade_symbols].mean(axis=1)
e = Exchange(trade_symbols,initial_balance=10000,commission=0.00075,log=False)
trade_value = 300
for row in price_usdt.iloc[-7500:].iterrows():
    e.Update(row[0], row[1])
    for symbol in trade_symbols:
        price = row[1][symbol]
        if np.isnan(price):
            continue
        diff = price_usdt_btc_norm2.loc[row[0],symbol] - price_usdt_btc_norm_mean[row[0]]
        aim_value = -trade_value*round(diff/0.01,1)
        now_value = e.account[symbol]['value']*np.sign(e.account[symbol]['amount'])
        if aim_value - now_value > 0.5*trade_value:
            e.Buy(symbol, price, round((aim_value - now_value)/price, 6),round(e.account[symbol]['realised_profit']+e.account[symbol]['unrealised_profit'],2))
        if aim_value - now_value < -0.5*trade_value:
            e.Sell(symbol, price, -round((aim_value - now_value)/price, 6),round(e.account[symbol]['realised_profit']+e.account[symbol]['unrealised_profit'],2))
stragey_2a = e
(stragey_2a.df['total']/stragey_2d.initial_balance).plot(figsize=(17,6),grid = True);
Strategi 1, strategi short altcoin mencapai pengembalian positif
trade_symbols = list(set(symbols)-set(['LINK','BTC','XTZ','BCH', 'ETH'])) # Selling short currencies
e = Exchange(trade_symbols+['BTC'],initial_balance=10000,commission=0.00075,log=False)
trade_value = 2000
for row in price_usdt.iloc[-7500:].iterrows():
    e.Update(row[0], row[1])
    empty_value = 0
    for symbol in trade_symbols:
        price = row[1][symbol]
        if np.isnan(price):
            continue
        if e.account[symbol]['value'] - trade_value  < -120 :
            e.Sell(symbol, price, round((trade_value-e.account[symbol]['value'])/price, 6),round(e.account[symbol]['realised_profit']+e.account[symbol]['unrealised_profit'],2))
        if e.account[symbol]['value'] - trade_value > 120 :
            e.Buy(symbol, price, round((e.account[symbol]['value']-trade_value)/price, 6),round(e.account[symbol]['realised_profit']+e.account[symbol]['unrealised_profit'],2))
        empty_value += e.account[symbol]['value']
    price = row[1]['BTC']
    if e.account['BTC']['value'] - empty_value < -120:
        e.Buy('BTC', price, round((empty_value-e.account['BTC']['value'])/price,6),round(e.account['BTC']['realised_profit']+e.account['BTC']['unrealised_profit'],2))
    if e.account['BTC']['value'] - empty_value > 120:
        e.Sell('BTC', price, round((e.account['BTC']['value']-empty_value)/price,6),round(e.account['BTC']['realised_profit']+e.account['BTC']['unrealised_profit'],2))
stragey_1 = e
(stragey_1.df['total']/stragey_1.initial_balance).plot(figsize=(17,6),grid = True);
Strategi 2 membeli over-fall panjang dan menjual short over-rise analisis keuntungan
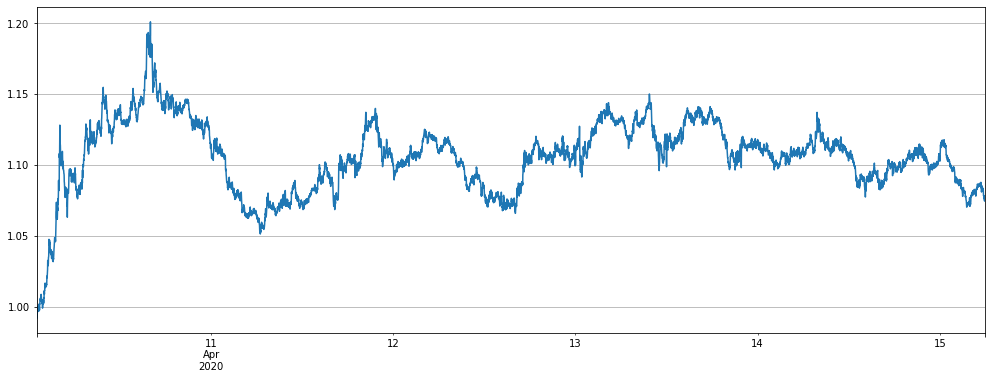
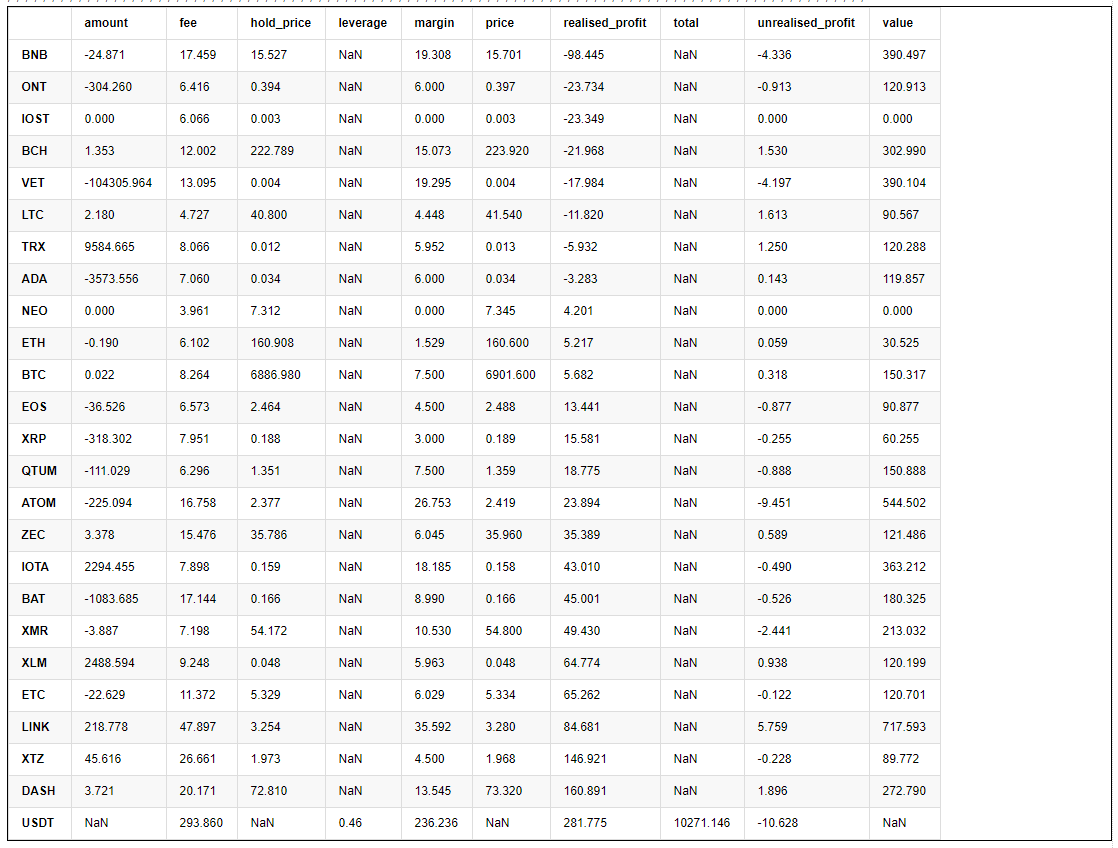
Mencetak informasi rekening akhir menunjukkan bahwa sebagian besar mata uang telah membawa keuntungan, dan BNB telah mengalami kerugian paling banyak.
pd.DataFrame(stragey_2a.account).T.apply(lambda x:round(x,3)).sort_values(by='realised_profit')
# BNB deviation
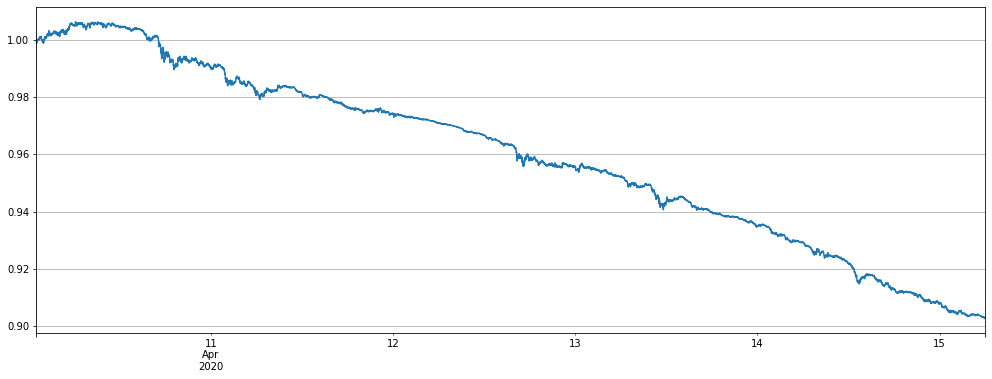
(price_usdt_btc_norm2.iloc[-7500:].BNB-price_usdt_btc_norm_mean[-7500:]).plot(figsize=(17,6),grid = True);
#price_usdt_btc_norm_mean[-7500:].plot(figsize=(17,6),grid = True);
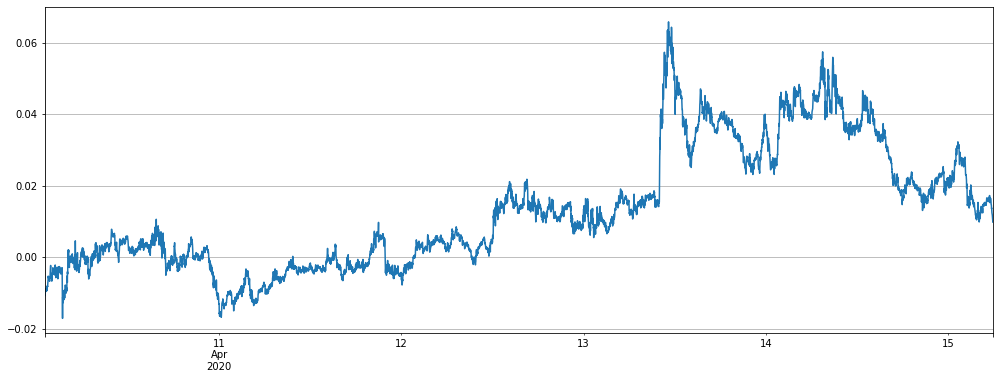
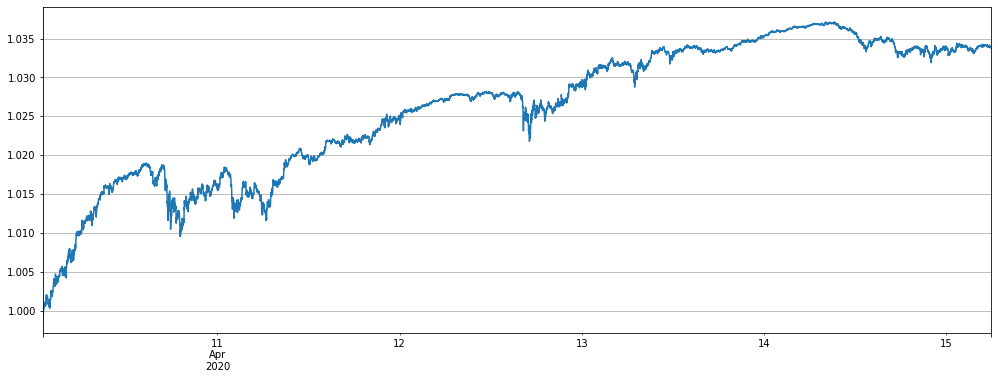
Jika BNB dan ATOM dihapus, hasilnya lebih baik, tetapi strategi masih akan berada di tahap retracement baru-baru ini.
Alpha = 0.001
price_usdt_btc_norm2 = price_usdt_btc/price_usdt_btc.ewm(alpha=Alpha).mean() # Here is consistent with the strategy, using EMA
trade_symbols = list(set(symbols)-set(['BNB','ATOM']))
price_usdt_btc_norm_mean = price_usdt_btc_norm2[trade_symbols].mean(axis=1)
e = Exchange(trade_symbols,initial_balance=10000,commission=0.00075,log=False)
trade_value = 300
for row in price_usdt.iloc[-7500:].iterrows():
    e.Update(row[0], row[1])
    for symbol in trade_symbols:
        price = row[1][symbol]
        if np.isnan(price):
            continue
        diff = price_usdt_btc_norm2.loc[row[0],symbol] - price_usdt_btc_norm_mean[row[0]]
        aim_value = -trade_value*round(diff/0.01,1)
        now_value = e.account[symbol]['value']*np.sign(e.account[symbol]['amount'])
        if aim_value - now_value > 0.5*trade_value:
            e.Buy(symbol, price, round((aim_value - now_value)/price, 6),round(e.account[symbol]['realised_profit']+e.account[symbol]['unrealised_profit'],2))
        if aim_value - now_value < -0.5*trade_value:
            e.Sell(symbol, price, -round((aim_value - now_value)/price, 6),round(e.account[symbol]['realised_profit']+e.account[symbol]['unrealised_profit'],2))
stragey_2b = e
(stragey_2b.df['total']/stragey_2b.initial_balance).plot(figsize=(17,6),grid = True);
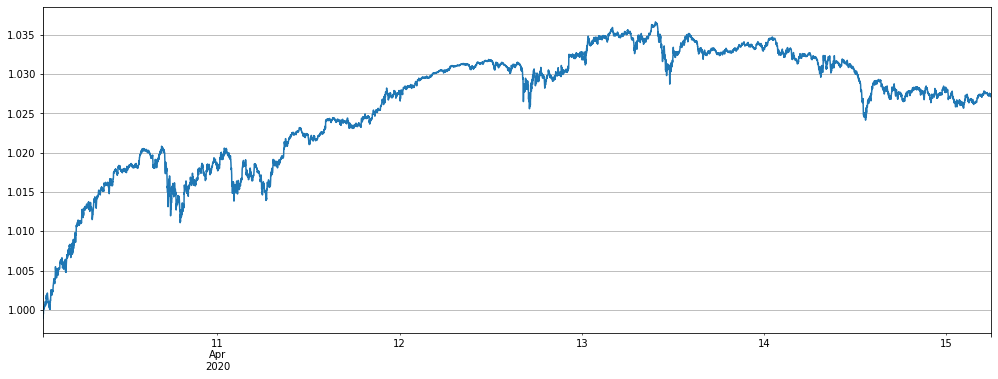
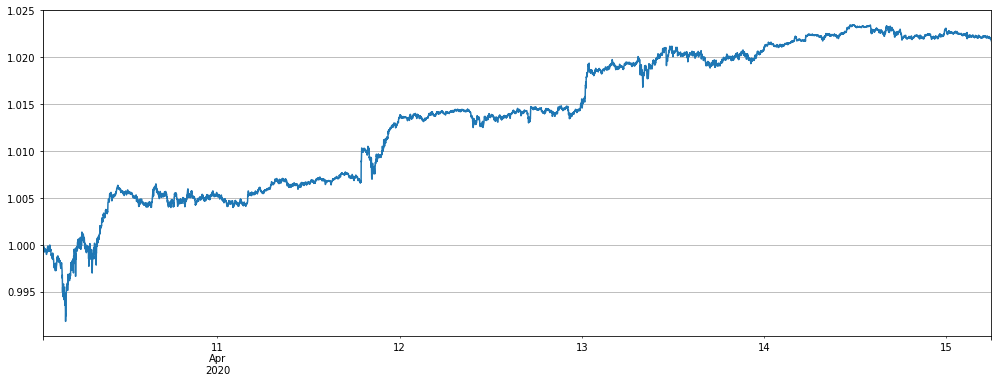
Dalam dua hari terakhir, telah menjadi populer untuk menjalankan strategi mata uang arus utama. Mari kita backtest strategi ini. Karena penurunan variasi mata uang, trade_value secara tepat meningkat 4 kali untuk perbandingan, dan hasilnya berkinerja baik, terutama karena retracement baru-baru ini kecil.
Perlu dicatat bahwa hanya mata uang utama yang tidak sebagus mata uang penuh dalam backtest waktu yang lebih lama, dan ada lebih banyak retracements.
Alpha = 0.001
price_usdt_btc_norm2 = price_usdt_btc/price_usdt_btc.ewm(alpha=Alpha).mean() # Here is consistent with the strategy, using EMA
trade_symbols = ['ETH','LTC','EOS','XRP','BCH']
price_usdt_btc_norm_mean = price_usdt_btc_norm2[trade_symbols].mean(axis=1)
e = Exchange(trade_symbols,initial_balance=10000,commission=0.00075,log=False)
trade_value = 1200
for row in price_usdt.iloc[-7500:].iterrows():
    e.Update(row[0], row[1])
    for symbol in trade_symbols:
        price = row[1][symbol]
        if np.isnan(price):
            continue
        diff = price_usdt_btc_norm2.loc[row[0],symbol] - price_usdt_btc_norm_mean[row[0]]
        aim_value = -trade_value*round(diff/0.01,1)
        now_value = e.account[symbol]['value']*np.sign(e.account[symbol]['amount'])
        if aim_value - now_value > 0.5*trade_value:
            e.Buy(symbol, price, round((aim_value - now_value)/price, 6),round(e.account[symbol]['realised_profit']+e.account[symbol]['unrealised_profit'],2))
        if aim_value - now_value < -0.5*trade_value:
            e.Sell(symbol, price, -round((aim_value - now_value)/price, 6),round(e.account[symbol]['realised_profit']+e.account[symbol]['unrealised_profit'],2))
stragey_2c = e
(stragey_2c.df['total']/e.initial_balance).plot(figsize=(17,6),grid = True);
Biaya penanganan dan analisis parameter strategi
Karena beberapa laporan pertama menggunakan garis tingkat k jam, dan parameter yang sebenarnya sangat berbeda dengan situasi pasar yang sebenarnya, sekarang dengan garis tingkat menit k, Anda dapat melihat bagaimana mengatur beberapa parameter.
-
Alpha = 0.03 Parameter Alpha dari rata-rata bergerak eksponensial. Semakin besar pengaturan, semakin sensitif pelacakan harga acuan dan semakin sedikit transaksi. Posisi kepemilikan akhir juga akan lebih rendah, yang mengurangi leverage, tetapi juga akan mengurangi pengembalian dan retracement maksimum.
-
Update_base_price_time_interval = 30 * 60 Seberapa sering untuk memperbarui harga dasar, dalam detik, terkait dengan parameter Alpha, semakin kecil pengaturan Alpha, semakin kecil interval dapat diatur
-
Trade_value: Setiap 1% dari harga altcoin (didenominasi BTC) menyimpang dari nilai kepemilikan indeks, yang perlu ditentukan sesuai dengan total dana yang diinvestasikan dan preferensi risiko. Disarankan untuk menetapkan 3-10% dari total dana. Anda dapat melihat ukuran lever melalui backtest lingkungan penelitian. Trade_value dapat kurang dari Adjust_value, seperti setengah dari Adjust_value, yang setara dengan nilai kepemilikan 2% dari indeks.
-
Adjust_value: Nilai kontrak (penilaian USDT) menyesuaikan nilai penyimpangan. Ketika indeks menyimpang dari * Trade_value-posisi saat ini> Adjust_value, yaitu, perbedaan antara posisi target dan posisi saat ini melebihi nilai ini, perdagangan akan dimulai. Penyesuaian yang terlalu besar lambat, transaksi yang terlalu kecil sering dan tidak dapat kurang dari 10, jika tidak transaksi minimum tidak akan tercapai, disarankan untuk menetapkannya lebih dari 40% dari Trade_value.
Tidak perlu dikatakan, Trade_value secara langsung terkait dengan keuntungan dan risiko kita. jika Trade_value belum berubah, seharusnya menguntungkan sejauh ini.
Karena Alpha memiliki data frekuensi yang lebih tinggi kali ini, jelas lebih masuk akal untuk memperbarui setiap 1 menit.
Adjust_value selalu merekomendasikan lebih dari 40% dari Trade_value. Pengaturan garis 1h K asli memiliki sedikit efek. Beberapa orang ingin menyesuaikan sangat rendah, sehingga dapat lebih dekat ke posisi target. Di sini kita akan menganalisis mengapa tidak harus dilakukan.
Pertama menganalisis masalah penanganan biaya
Hal ini dapat dilihat bahwa di bawah tingkat default 0,00075, biaya penanganan adalah 293 dan keuntungan adalah 270, yang merupakan proporsi yang sangat tinggi.
stragey_2a.account['USDT']
{'fee': 293.85972778530453,
 'leverage': 0.45999999999999996,
 'margin': 236.23559736312995,
 'realised_profit': 281.77464608744435,
 'total': 10271.146238,
 'unrealised_profit': -10.628408369648495}
Alpha = 0.001
#price_usdt_btc_norm2 = price_usdt_btc/price_usdt_btc.rolling(20).mean() # Ordinary moving average
price_usdt_btc_norm2 = price_usdt_btc/price_usdt_btc.ewm(alpha=Alpha).mean() # Here is consistent with the strategy, using EMA
trade_symbols = list(set(symbols))
price_usdt_btc_norm_mean = price_usdt_btc_norm2[trade_symbols].mean(axis=1)
e = Exchange(trade_symbols,initial_balance=10000,commission=0,log=False)
trade_value = 300
for row in price_usdt.iloc[-7500:].iterrows():
    e.Update(row[0], row[1])
    for symbol in trade_symbols:
        price = row[1][symbol]
        if np.isnan(price):
            continue
        diff = price_usdt_btc_norm2.loc[row[0],symbol] - price_usdt_btc_norm_mean[row[0]]
        aim_value = -trade_value*round(diff/0.01,1)
        now_value = e.account[symbol]['value']*np.sign(e.account[symbol]['amount'])
        if aim_value - now_value > 10:
            e.Buy(symbol, price, round((aim_value - now_value)/price, 6),round(e.account[symbol]['realised_profit']+e.account[symbol]['unrealised_profit'],2))
        if aim_value - now_value < 10:
            e.Sell(symbol, price, -round((aim_value - now_value)/price, 6),round(e.account[symbol]['realised_profit']+e.account[symbol]['unrealised_profit'],2))
stragey_2d = e
(stragey_2d.df['total']/e.initial_balance).plot(figsize=(17,6),grid = True);
Hasilnya adalah garis lurus ke atas, BNB hanya membawa sedikit tikungan, Adjust_value yang lebih rendah menangkap setiap fluktuasi.
Bagaimana jika adjustment_value kecil jika ada sejumlah kecil biaya penanganan?
Alpha = 0.001
#price_usdt_btc_norm2 = price_usdt_btc/price_usdt_btc.rolling(20).mean() # Ordinary moving average
price_usdt_btc_norm2 = price_usdt_btc/price_usdt_btc.ewm(alpha=Alpha).mean() # Here is consistent with the strategy, using EMA
trade_symbols = list(set(symbols))
price_usdt_btc_norm_mean = price_usdt_btc_norm2[trade_symbols].mean(axis=1)
e = Exchange(trade_symbols,initial_balance=10000,commission=0.00075,log=False)
trade_value = 300
for row in price_usdt.iloc[-7500:].iterrows():
    e.Update(row[0], row[1])
    for symbol in trade_symbols:
        price = row[1][symbol]
        if np.isnan(price):
            continue
        diff = price_usdt_btc_norm2.loc[row[0],symbol] - price_usdt_btc_norm_mean[row[0]]
        aim_value = -trade_value*round(diff/0.01,1)
        now_value = e.account[symbol]['value']*np.sign(e.account[symbol]['amount'])
        if aim_value - now_value > 10:
            e.Buy(symbol, price, round((aim_value - now_value)/price, 6),round(e.account[symbol]['realised_profit']+e.account[symbol]['unrealised_profit'],2))
        if aim_value - now_value < 10:
            e.Sell(symbol, price, -round((aim_value - now_value)/price, 6),round(e.account[symbol]['realised_profit']+e.account[symbol]['unrealised_profit'],2))
stragey_2e = e
(stragey_2e.df['total']/e.initial_balance).plot(figsize=(17,6),grid = True);
Hasilnya, juga keluar dari kurva ke bawah garis lurus. mudah dimengerti jika Anda memikirkannya, sering penyesuaian dalam spread kecil hanya akan kehilangan biaya penanganan.
Secara keseluruhan, semakin rendah tingkat biaya, semakin kecil nilai Adjust_value dapat ditetapkan, semakin sering transaksi, dan semakin tinggi keuntungan.
Masalah dengan pengaturan Alpha
Karena ada garis menit, harga acuan akan diperbarui sekali per menit, di sini kita hanya backtest untuk menentukan ukuran alpha.
for Alpha in [0.0001, 0.0003, 0.0006, 0.001, 0.0015, 0.002, 0.004, 0.01, 0.02]:
#price_usdt_btc_norm2 = price_usdt_btc/price_usdt_btc.rolling(20).mean() # Ordinary moving average
    price_usdt_btc_norm2 = price_usdt_btc/price_usdt_btc.ewm(alpha=Alpha).mean() #Here is consistent with the strategy, using EMA
    trade_symbols = list(set(symbols))
    price_usdt_btc_norm_mean = price_usdt_btc_norm2[trade_symbols].mean(axis=1)
    e = Exchange(trade_symbols,initial_balance=10000,commission=0.00075,log=False)
    trade_value = 300
    for row in price_usdt.iloc[-7500:].iterrows():
        e.Update(row[0], row[1])
        for symbol in trade_symbols:
            price = row[1][symbol]
            if np.isnan(price):
                continue
            diff = price_usdt_btc_norm2.loc[row[0],symbol] - price_usdt_btc_norm_mean[row[0]]
            aim_value = -trade_value*round(diff/0.01,1)
            now_value = e.account[symbol]['value']*np.sign(e.account[symbol]['amount'])
            if aim_value - now_value > 0.5*trade_value:
                e.Buy(symbol, price, round((aim_value - now_value)/price, 6),round(e.account[symbol]['realised_profit']+e.account[symbol]['unrealised_profit'],2))
            if aim_value - now_value < -0.5*trade_value:
                e.Sell(symbol, price, -round((aim_value - now_value)/price, 6),round(e.account[symbol]['realised_profit']+e.account[symbol]['unrealised_profit'],2))
    print(Alpha, e.account['USDT']['unrealised_profit']+e.account['USDT']['realised_profit'])
0.0001 -77.80281760941007
0.0003 179.38803796199724
0.0006 218.12579924541367
0.001 271.1462377177959
0.0015 250.0014065973528
0.002 207.38692166891275
0.004 129.08021828803027
0.01 65.12410041648158
0.02 58.62356792410955
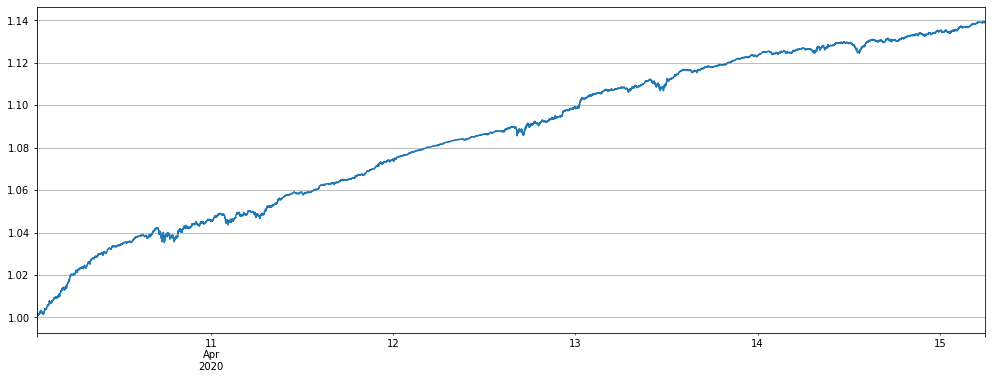
Hasil tes balik dari garis menit dalam dua bulan terakhir
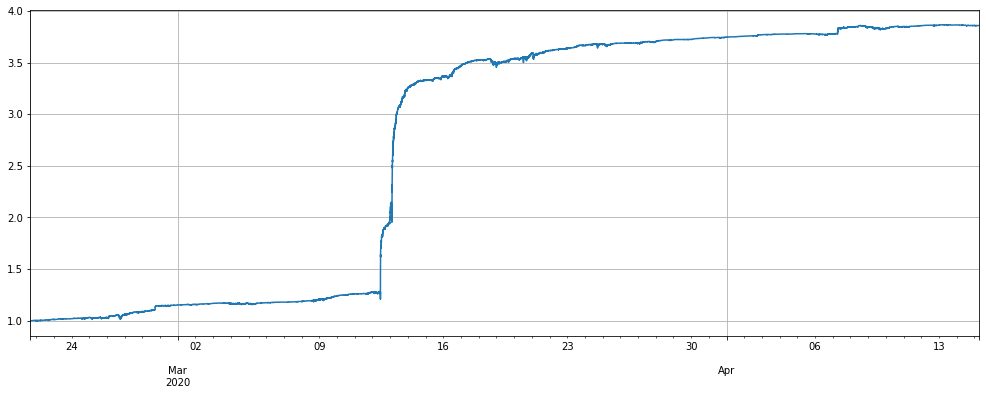
Akhirnya, lihatlah hasil dari backtest waktu yang lama. sekarang, satu demi satu naik, dan kekayaan bersih hari ini berada di titik terendah baru. mari kita berikan keyakinan berikut. karena frekuensi garis menit lebih tinggi, itu akan membuka dan menutup posisi dalam satu jam, sehingga keuntungan akan jauh lebih tinggi.
Titik lain, kita selalu menggunakan trade_value tetap, yang membuat pemanfaatan dana di periode kemudian tidak cukup, dan tingkat pengembalian yang sebenarnya masih dapat meningkat banyak.
Di mana kita dalam periode backtest dua bulan?
Alpha = 0.001
#price_usdt_btc_norm2 = price_usdt_btc/price_usdt_btc.rolling(20).mean() # Ordinary moving average
price_usdt_btc_norm2 = price_usdt_btc/price_usdt_btc.ewm(alpha=Alpha).mean() # Here is consistent with the strategy, using EMA
trade_symbols = list(set(symbols))
price_usdt_btc_norm_mean = price_usdt_btc_norm2[trade_symbols].mean(axis=1)
e = Exchange(trade_symbols,initial_balance=10000,commission=0.00075,log=False)
trade_value = 300
for row in price_usdt.iloc[:].iterrows():
    e.Update(row[0], row[1])
    for symbol in trade_symbols:
        price = row[1][symbol]
        if np.isnan(price):
            continue
        diff = price_usdt_btc_norm2.loc[row[0],symbol] - price_usdt_btc_norm_mean[row[0]]
        aim_value = -trade_value*round(diff/0.01,1)
        now_value = e.account[symbol]['value']*np.sign(e.account[symbol]['amount'])
        if aim_value - now_value > 0.5*trade_value:
            e.Buy(symbol, price, round((aim_value - now_value)/price, 6),round(e.account[symbol]['realised_profit']+e.account[symbol]['unrealised_profit'],2))
        if aim_value - now_value < -0.5*trade_value:
            e.Sell(symbol, price, -round((aim_value - now_value)/price, 6),round(e.account[symbol]['realised_profit']+e.account[symbol]['unrealised_profit'],2))
stragey_2f = e
(stragey_2f.df['total']/stragey_2e.initial_balance).plot(figsize=(17,6),grid = True);
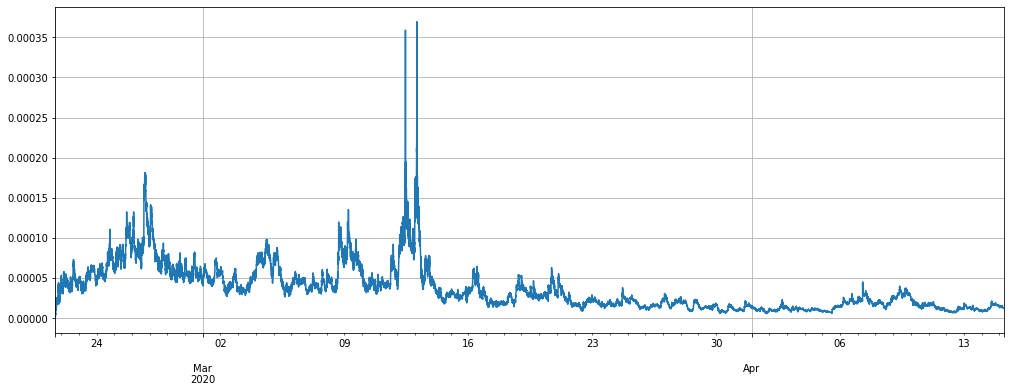
(stragey_2f.df['leverage']/stragey_2e.initial_balance).plot(figsize=(17,6),grid = True);
- Mengkuantifikasi Analisis Fundamental di Pasar Cryptocurrency: Biarkan Data Berbicara Sendiri!
- Di sini, saya akan membahas beberapa hal yang sangat penting tentang penelitian kuantitatif dasar dalam lingkaran mata uang - jangan percaya lagi pada guru-guru sihir yang bodoh, data berbicara secara obyektif!
- Alat penting dalam bidang transaksi kuantitatif - inventor modul eksplorasi data kuantitatif
- Menguasai Semuanya - Pendahuluan ke FMZ Versi Baru Terminal Trading (dengan TRB Arbitrage Source Code)
- Untuk mengetahui semua tentang FMZ, silahkan kunjungi situs resmi FMZ.
- FMZ Quant: Analisis Contoh Desain Persyaratan Umum di Pasar Cryptocurrency (II)
- Cara Mengeksploitasi Robot Penjual Tanpa Otak dengan Strategi Frekuensi Tinggi dalam 80 Baris Kode
- FMZ Kuantitas: Perencanaan Contoh Desain Permintaan Umum di Pasar Cryptocurrency (II)
- Cara Mengeksploitasi Robot Tanpa Otak untuk Dijual dengan Strategi Frekuensi Tinggi 80 Baris Kode
- FMZ Quant: Analisis Contoh Desain Persyaratan Umum di Pasar Cryptocurrency (I)
- Kuantitas FMZ: Perbedaan antara permintaan umum pasar cryptocurrency dan contoh desain (1)