SAR parabola
Penulis:ChaoZhang, Tanggal: 2022-05-31 19:01:00Tag:SAR
Ini adalah desain ulang dari indikator SAR Parabolic built-in. Saya menambahkan sistem input yang tepat, opsi untuk menyoroti titik awal untuk kedua garis dan opsi untuk memilih lebar titik. jadi, sesuaikan seperti yang Anda inginkan.
Parabolic SAR awalnya dikembangkan oleh J. Welles Wilder dan dijelaskan dalam bukunya
Untuk mengetahui pengaturan untuk PSAR yang paling menguntungkan pada instrumen dan jangka waktu Anda dapat menggunakan alat ini
backtest
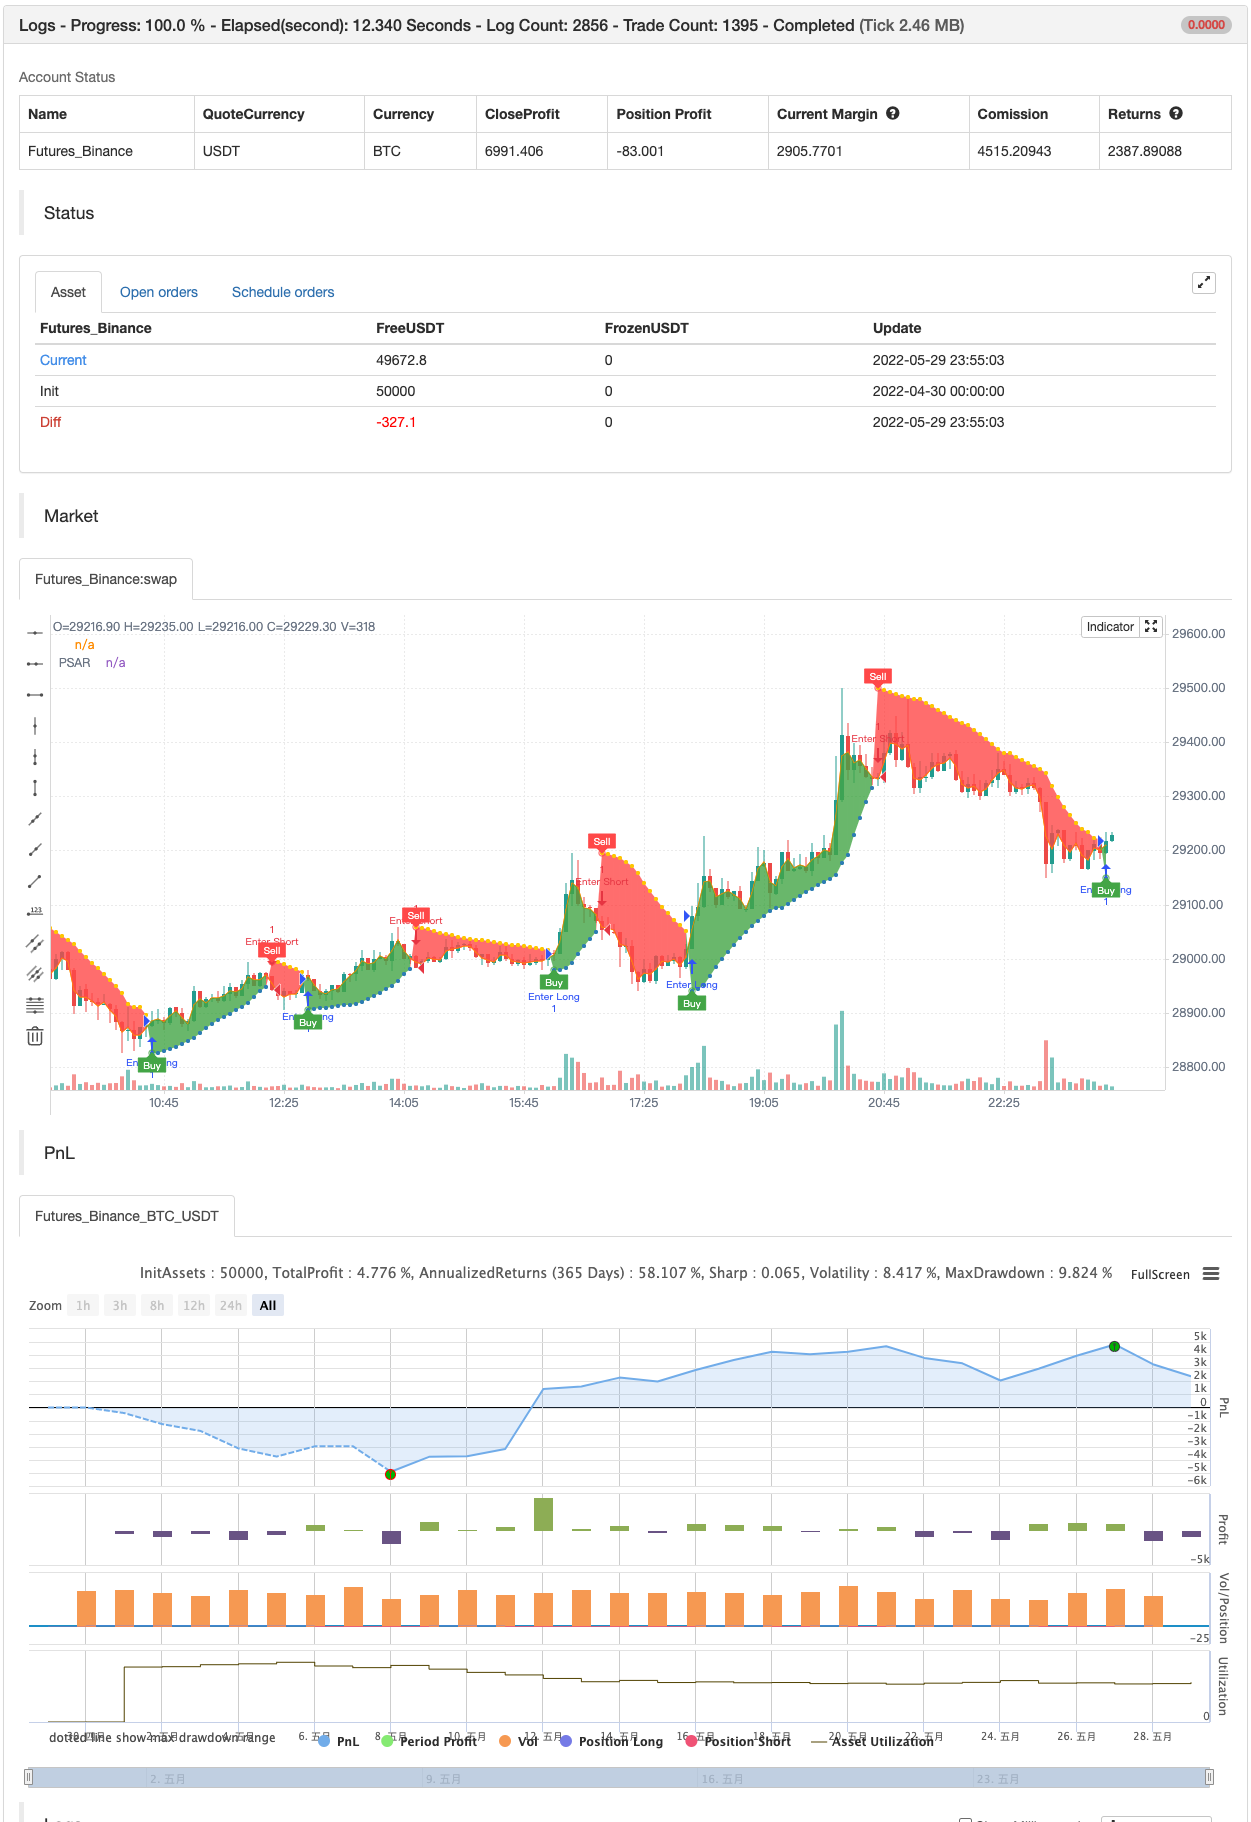
/*backtest
start: 2022-04-30 00:00:00
end: 2022-05-29 23:59:00
period: 5m
basePeriod: 1m
exchanges: [{"eid":"Futures_Binance","currency":"BTC_USDT"}]
*/

//@version=4
// Copyright (c) 2019-present, Alex Orekhov (everget)
// Parabolic SAR script may be freely distributed under the terms of the GPL-3.0 license.
study("Parabolic SAR", shorttitle="PSAR", overlay=true)

start = input(title="Start", type=input.float, step=0.001, defval=0.02)
increment = input(title="Increment", type=input.float, step=0.001, defval=0.02)
maximum = input(title="Maximum", type=input.float, step=0.01, defval=0.2)
width = input(title="Point Width", type=input.integer, minval=1, defval=2)
highlightStartPoints = input(title="Highlight Start Points ?", type=input.bool, defval=true)
showLabels = input(title="Show Buy/Sell Labels ?", type=input.bool, defval=true)
highlightState = input(title="Highlight State ?", type=input.bool, defval=true)

psar = sar(start, increment, maximum)
dir = psar < close ? 1 : -1

psarColor = dir == 1 ? #3388bb : #fdcc02
psarPlot = plot(psar, title="PSAR", style=plot.style_circles, linewidth=width, color=psarColor, transp=0)

var color longColor = color.green
var color shortColor = color.red

buySignal = dir == 1 and dir[1] == -1
plotshape(buySignal and highlightStartPoints ? psar : na, title="Long Start", location=location.absolute, style=shape.circle, size=size.tiny, color=longColor, transp=0)
plotshape(buySignal and showLabels ? psar : na, title="Buy Label", text="Buy", location=location.absolute, style=shape.labelup, size=size.tiny, color=longColor, textcolor=color.white, transp=0)

sellSignal = dir == -1 and dir[1] == 1
plotshape(sellSignal and highlightStartPoints ? psar : na, title="Short Start", location=location.absolute, style=shape.circle, size=size.tiny, color=shortColor, transp=0)
plotshape(sellSignal and showLabels ? psar : na, title="Sell Label", text="Sell", location=location.absolute, style=shape.labeldown, size=size.tiny, color=shortColor, textcolor=color.white, transp=0)

midPricePlot = plot(ohlc4, title="", display=display.none)

fillColor = highlightState ? (dir == 1 ? longColor : shortColor) : na
fill(midPricePlot, psarPlot, title="Trade State Filling", color=fillColor)

changeCond = dir != dir[1]
alertcondition(changeCond, title="Alert: PSAR Direction Change", message="PSAR has changed direction!")
alertcondition(buySignal, title="Alert: PSAR Long", message="PSAR Long")
alertcondition(sellSignal, title="Alert: PSAR Short", message="PSAR Sell")


if buySignal
    strategy.entry("Enter Long", strategy.long)
else if sellSignal
    strategy.entry("Enter Short", strategy.short)
Berkaitan
- Elliott Wave Theory 4-9 Impulse Wave Deteksi Otomatis Strategi Perdagangan
- SAR - tinggi dan rendah
- SAR tinggi rendah
- SAR Parabolik Beli dan Jual
- 15MIN BTCUSDTPERP BOT
Lebih banyak
- TUE ADX/MACD Confluence V1.0
- Twin Range Filter
- SAR - tinggi dan rendah
- Sistem Perdagangan Swing yang Tepat
- Tren linier
- Pola Waktu Fibonacci
- Darvas Box Beli Jual
- Demark Setup Indicator
- Bollinger Bands Stochastic RSI Ekstrem
- AK MACD BB INDIKATOR V 1,00
- Indikator Divergensi RSI
- Indikator OBV MACD
- Tren Pivot
- Strategi Divergensi Harga v1.0
- Pemecahan Dukungan-Resistensi
- Slope Adaptive Moving Average
- Strategi osilator Delta-RSI
- Low Scanner strategi crypto
- [blackcat] L2 Reversal Label Strategi
- SuperB