仮想通貨先物 多シンボル ART 戦略 (教学)
作者: リン・ハーンニナバダス作成日: 2022-04-07 11:09:42,更新日: 2022-04-07 16:15:14仮想通貨先物 多シンボル ART 戦略 (教学)
最近,当社のプラットフォームの一部のユーザーは,Mylanguage 戦略をJavaScript 戦略に移植することを非常に楽しみにしており,多くの最適化アイデアを柔軟に追加することができます.彼らは,戦略をマルチシンボルバージョンに拡張したいと考えています.Mylanguage 戦略は通常トレンド戦略であり,多くは近い価格モデルで実行されるため,これらの戦略はプラットフォーム API インターフェースを非常に頻繁に要求しません.これはマルチシンボル戦略バージョンに移植するのにより適しています.記事では,簡単なMylanguage 戦略を例として取り,JavaScript 言語のシンプルなバージョンに移植します.主な目的は教え,バックテスト,研究です.戦略を実行したい場合は,いくつかの詳細を追加する必要があります (例えば注文金額,精度,注文金額,資産による注文状況,表示情報比率,およびbot の実際のテストを実行する必要があります).
ミランゲージ戦略を移植する
TR:=MAX(MAX((H-L),ABS(REF(C,1)-H)),ABS(REF(C,1)-L));
ATR:=EMA(TR,LENGTH2);

MIDLINE^^EMA((H + L + C)/3,LENGTH1);
UPBAND^^MIDLINE + N*ATR;
DOWNBAND^^MIDLINE - N*ATR;


BKVOL=0 AND C>=UPBAND AND REF(C,1)<REF(UPBAND,1),BPK;
SKVOL=0 AND C<=DOWNBAND AND REF(C,1)>REF(DOWNBAND,1),SPK;

BKVOL>0 AND C<=MIDLINE,SP(BKVOL);
SKVOL>0 AND C>=MIDLINE,BP(SKVOL);
// stop loss
C>=SKPRICE*(1+SLOSS*0.01),BP;
C<=BKPRICE*(1-SLOSS*0.01),SP;
AUTOFILTER;
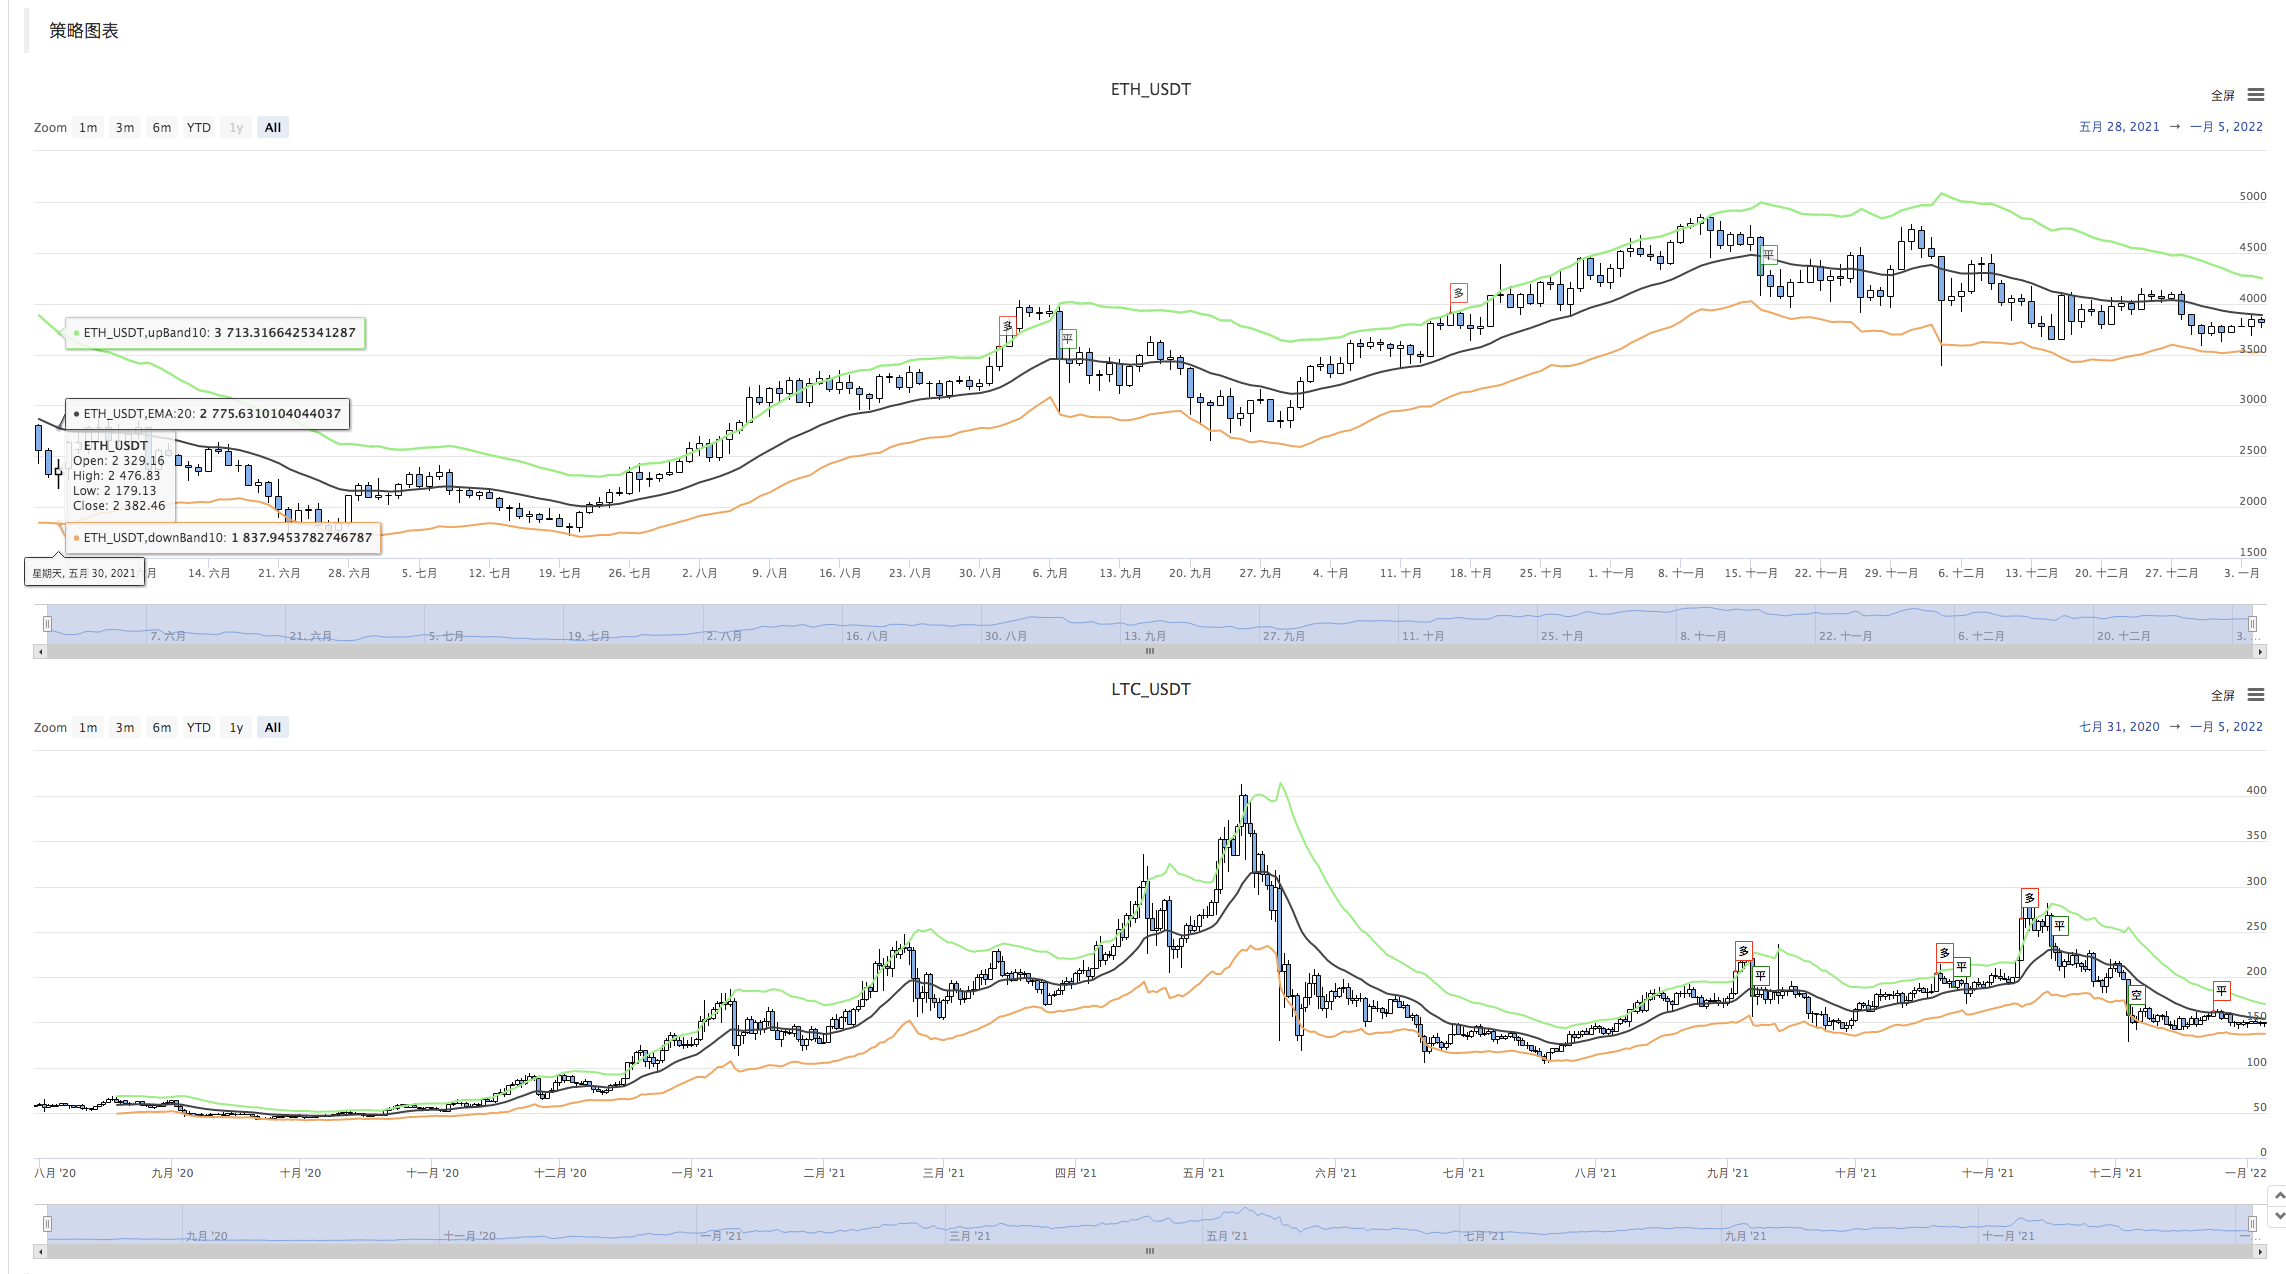
戦略の論理は非常に単純です.まず,パラメータに従ってATRを計算し,その後,すべてのKラインBARの最高,最低,閉じる,開く価格の平均値を計算し,EMA指標を計算します.最後に,パラメータ内のATRと比 Nに基づいて,upBandとdownBandを計算します.
オープンポジションとリバースは,閉じる価格がアップバンドとダウンバンドを切り裂くことをベースにします. アップバンドをリバース (ショートホールディングの場合),ロングをオープンします. ダウンバンドをリバースして,ショートを開きます. 閉じる価格がミッドラインに達すると,閉じるポジション; 閉じる価格がストップ・ロスの価格に達すると,閉じるポジション (SLOSSによるストップ・ロスの基準で,SLOSSが1である場合,0.01,すなわち1%). ストラテジーは,閉じる価格モデルで実行されます.
Mylanguageの戦略要求と考えを理解したら ポートを開始できます
港と設計戦略プロトタイプ
戦略プロトタイプコードは長くない. 1~200行しかありません. 戦略を書くアイデアを簡単に勉強するために,私は直接戦略コードにコメントを書きます.
// parse params, from string to object
var arrParam = JSON.parse(params)

// the function creates the chart configuration
function createChartConfig(symbol, atrPeriod, emaPeriod, index) {   // symbol: trading pair; atrPeriod: ATR parameter period;  emaPeriod: EMA parameter period; index: index of the corresponding exchange object
    var chart = {
        __isStock: true,
        extension: {
                layout: 'single',
                height: 600,
        },
        title : { text : symbol},
        xAxis: { type: 'datetime'},
        series : [
            {
                type: 'candlestick',    // K-line data series
                name: symbol,
                id: symbol + "-" + index,
                data: []
            }, {
                type: 'line',           // EMA
                name: symbol + ',EMA:' + emaPeriod,
                data: [],
            }, {
                type: 'line',           // upBand
                name: symbol + ',upBand' + atrPeriod,
                data: []
            }, {
                type: 'line',           // downBand
                name: symbol + ',downBand' + atrPeriod,
                data: []
            }, {
                type: 'flags',
                onSeries: symbol + "-" + index,
                data: [],
            }
        ]
    }
    return chart
}

// main logic
function process(e, kIndex, c) {    // e is the exchange object, such as exchanges[0] ... ; kIndex is the data series of K-line data in the chart; c is the chart object
    // obtain K-line data
    var r = e.GetRecords(e.param.period)
    if (!r || r.length < e.param.atrPeriod + 2 || r.length < e.param.emaPeriod + 2) {
        // if K-line data length is insufficient, return
        return
    }

    // calculate ATR indicator
    var atr = TA.ATR(r, e.param.atrPeriod)
    var arrAvgPrice = []
    _.each(r, function(bar) {
        arrAvgPrice.push((bar.High + bar.Low + bar.Close) / 3)
    })
    // calculate EMA indicator
    var midLine = TA.EMA(arrAvgPrice, e.param.emaPeriod)
    // calculate upBand and downBand
    var upBand = []
    var downBand = []
    _.each(midLine, function(mid, index) {
        if (index < e.param.emaPeriod - 1 || index < e.param.atrPeriod - 1) {
            upBand.push(NaN)
            downBand.push(NaN)
            return
        }
        upBand.push(mid + e.param.trackRatio * atr[index])
        downBand.push(mid - e.param.trackRatio * atr[index])
    })

    // plot
    for (var i = 0 ; i < r.length ; i++) {
        if (r[i].Time == e.state.lastBarTime) {
            // update
            c.add(kIndex, [r[i].Time, r[i].Open, r[i].High, r[i].Low, r[i].Close], -1)
            c.add(kIndex + 1, [r[i].Time, midLine[i]], -1)
            c.add(kIndex + 2, [r[i].Time, upBand[i]], -1)
            c.add(kIndex + 3, [r[i].Time, downBand[i]], -1)
        } else if (r[i].Time > e.state.lastBarTime) {
            // add
            e.state.lastBarTime = r[i].Time
            c.add(kIndex, [r[i].Time, r[i].Open, r[i].High, r[i].Low, r[i].Close])
            c.add(kIndex + 1, [r[i].Time, midLine[i]])
            c.add(kIndex + 2, [r[i].Time, upBand[i]])
            c.add(kIndex + 3, [r[i].Time, downBand[i]])
        }
    }

    // detect position
    var pos = e.GetPosition()
    if (!pos) {
        return
    }
    var holdAmount = 0
    var holdPrice = 0
    if (pos.length > 1) {
        throw "Long and short positions are detected simultaneously!"
    } else if (pos.length != 0) {
        holdAmount = pos[0].Type == PD_LONG ? pos[0].Amount : -pos[0].Amount
        holdPrice = pos[0].Price
    }

    if (e.state.preBar == -1) {
        e.state.preBar = r[r.length - 1].Time
    }
    // detect signal
    if (e.state.preBar != r[r.length - 1].Time) {   // close price model
        if (holdAmount <= 0 && r[r.length - 3].Close < upBand[upBand.length - 3] && r[r.length - 2].Close > upBand[upBand.length - 2]) {   // close price up cross the upBand
            if (holdAmount < 0) {   // holding short, close position
                Log(e.GetCurrency(), "close short position", "#FF0000")
                $.CoverShort(e, e.param.symbol, Math.abs(holdAmount))
                c.add(kIndex + 4, {x: r[r.length - 2].Time, color: 'red', shape: 'flag', title: 'close', text: "close short position"})
            }
            // open long
            Log(e.GetCurrency(), "open long position", "#FF0000")
            $.OpenLong(e, e.param.symbol, 10)
            c.add(kIndex + 4, {x: r[r.length - 2].Time, color: 'red', shape: 'flag', title: 'long', text: "open long position"})
        } else if (holdAmount >= 0 && r[r.length - 3].Close > downBand[downBand.length - 3] && r[r.length - 2].Close < downBand[downBand.length - 2]) {  // close price down cross the downBand
            if (holdAmount > 0) {   // holding long, close position
                Log(e.GetCurrency(), "close long position", "#FF0000")
                $.CoverLong(e, e.param.symbol, Math.abs(holdAmount))
                c.add(kIndex + 4, {x: r[r.length - 2].Time, color: 'green', shape: 'flag', title: 'close', text: "close long position"})
            }
            // open short
            Log(e.GetCurrency(), "open short position", "#FF0000")
            $.OpenShort(e, e.param.symbol, 10)
            c.add(kIndex + 4, {x: r[r.length - 2].Time, color: 'green', shape: 'flag', title: 'short', text: "open short position"})
        } else {
            // close position
            if (holdAmount > 0 && (r[r.length - 2].Close <= holdPrice * (1 - e.param.stopLoss) || r[r.length - 2].Close <= midLine[midLine.length - 2])) {   // if holding long position, close price is equal to or less than midline, stop loss according to open position price
                Log(e.GetCurrency(), "if midline is triggered or stop loss, close long position", "#FF0000")
                $.CoverLong(e, e.param.symbol, Math.abs(holdAmount))
                c.add(kIndex + 4, {x: r[r.length - 2].Time, color: 'green', shape: 'flag', title: 'close', text: "close long position"})
            } else if (holdAmount < 0 && (r[r.length - 2].Close >= holdPrice * (1 + e.param.stopLoss) || r[r.length - 2].Close >= midLine[midLine.length - 2])) {  // if holding short position, close price is equal to or more than midline, stop loss according to open position price
                Log(e.GetCurrency(), "if midline is triggered or stop loss, close short position", "#FF0000")
                $.CoverShort(e, e.param.symbol, Math.abs(holdAmount))
                c.add(kIndex + 4, {x: r[r.length - 2].Time, color: 'red', shape: 'flag', title: 'close', text: "close short position"})
            }
        }
        e.state.preBar = r[r.length - 1].Time
    }
}

function main() {
    var arrChartConfig = []
    if (arrParam.length != exchanges.length) {
        throw "The parameter and the exchange object do not match!"
    }
    var arrState = _G("arrState")
    _.each(exchanges, function(e, index) {
        if (e.GetName() != "Futures_Binance") {
            throw "The platform is not supported!"
        }
        e.param = arrParam[index]
        e.state = {lastBarTime: 0, symbol: e.param.symbol, currency: e.GetCurrency()}
        if (arrState) {
            if (arrState[index].symbol == e.param.symbol && arrState[index].currency == e.GetCurrency()) {
                Log("Recover:", e.state)
                e.state = arrState[index]
            } else {
                throw "The recovered data and the current setting do not match!"
            }
        }
        e.state.preBar = -1   // initially set -1
        e.SetContractType(e.param.symbol)
        Log(e.GetName(), e.GetLabel(), "Set contract:", e.param.symbol)
        arrChartConfig.push(createChartConfig(e.GetCurrency(), e.param.atrPeriod, e.param.emaPeriod, index))
    })
    var chart = Chart(arrChartConfig)
    chart.reset()

    while (true) {
        _.each(exchanges, function(e, index) {
            process(e, index + index * 4, chart)
            Sleep(500)
        })
    }
}

function onexit() {
    // record e.state
    var arrState = []
    _.each(exchanges, function(e) {
        arrState.push(e.state)
    })
    Log("Record:", arrState)
    _G("arrState", arrState)
}
戦略パラメータ:
var params = '[{
        "symbol" : "swap",    // contract code
        "period" : 86400,     // K-line period; 86400 seconds indicates 1 day
        "stopLoss" : 0.07,    // ratio of stoploss; 0.07 means 7%
        "atrPeriod" : 10,     // ATR indicator parameter
        "emaPeriod" : 10,     // EMA indicator parameter
        "trackRatio" : 1,     // ratio of upBand or downBand
        "openRatio" : 0.1     // ratio of reserved open position (temporarily not supported)
    }, {
        "symbol" : "swap",
        "period" : 86400,
        "stopLoss" : 0.07,
        "atrPeriod" : 10,
        "emaPeriod" : 10,
        "trackRatio" : 1,
        "openRatio" : 0.1
    }]'
バックテスト
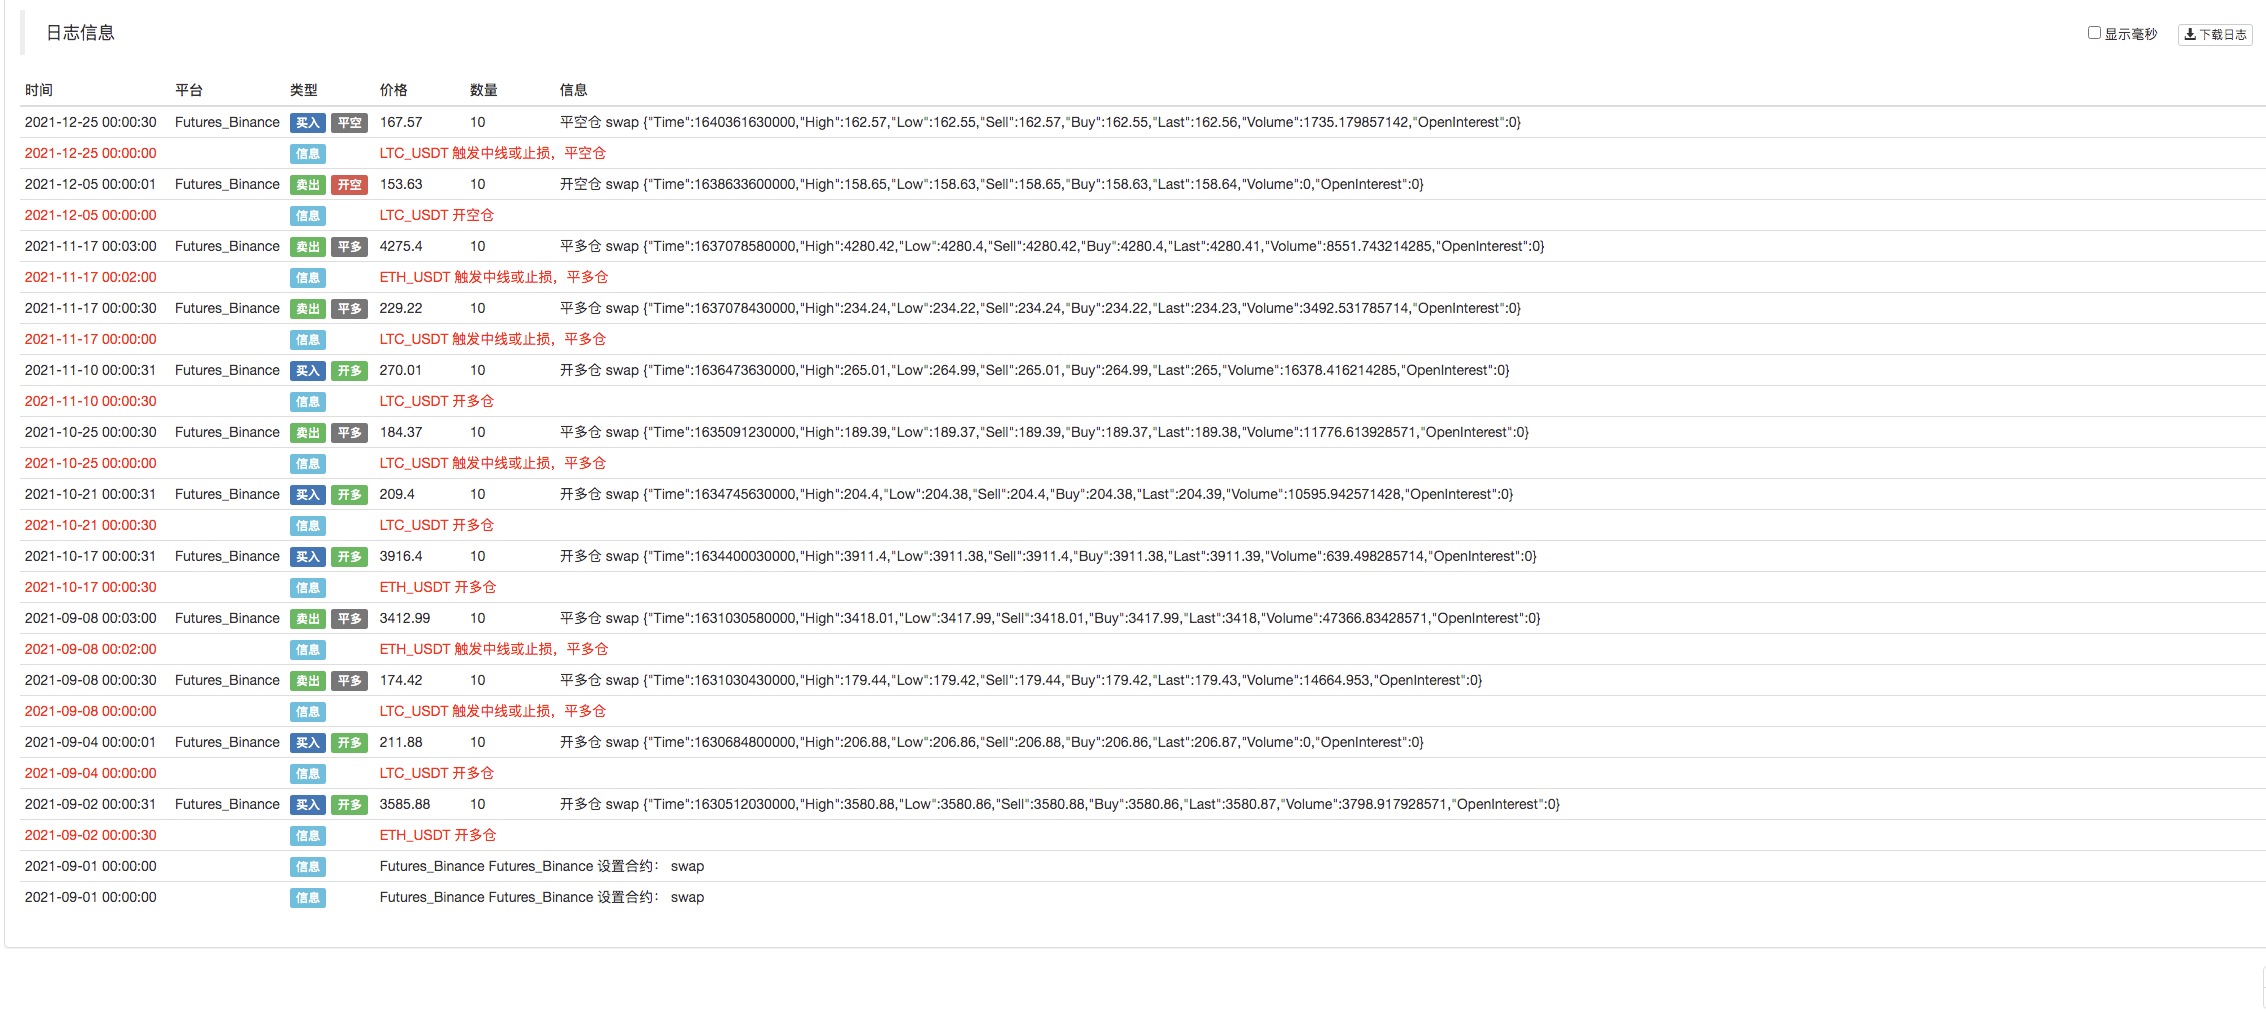
戦略 ソースコード:https://www.fmz.com/strategy/339344
戦略はコミュニケーションと研究のためにのみ使用されます. 実用的な使用のために,自分でそれを修正,調整,最適化する必要があります.
- 面値の問題
- dYdX 戦略設計例
- FMZの Python クローラーアプリケーションの初期調査
クローリングバイナンス 発表内容 - ヘッジ 戦略 設計 研究 & 待機中のスポットと先物注文の例
- 最近の状況と資金調達の利子戦略の推奨運用
- 暗号通貨先物 (Teaching) の二重移動平均ブレイクポイント戦略
- 仮想通貨スポット・マルチ・シンボル・ダブル・ムービング・平均戦略 (教学)
- JavaScript でフィッシャー インディケーターの実現と FMZ でのプロティング
- 管理者
- 2021年暗号通貨のTAQレビュー&10倍増の最もシンプルな見逃した戦略
- アップグレード! 仮想通貨先物 マーティンゲール戦略
- Getrecords は秒単位で K 線図を取得できません
- FMZベースのオーダー同期管理システム設計 (2)
- Getticker が返した Volume データは間違っています
- FMZベースのオーダー同期管理システム設計 (1)
- 複数のチャート の 図書 室 を 設計 する
- 模擬ディスク環境
- 60行コードで"つのアイデアを実現する - 契約底釣り
- FMZ決済システムのアップグレードと調整のお知らせ
- FMZのゴーストライティング戦略に関する通知