JavaScript でフィッシャー インディケーターの実現と FMZ でのプロティング
作者: リン・ハーンニナバダス作成日:2022-04-07 16:04:22,更新日:2022-04-07 16:04:22, 更新日:2022-04-07 16:04:22, 更新日:2022-04-07 16:04:22, 更新日:2022-04-07 16:04:22, 更新日:2020-04-07 16:04:22, 更新日:2020-04-07 16:04:22, 更新日:2020-04-07 16:04:22, 更新日:2020-04-07 16:04:22, 更新日:2020-04-07 16:04:22, 更新日:2020-04-07JavaScript でフィッシャー インディケーターの実現と FMZ でのプロティング
トレーディングにおける技術分析では,トレーダーは皆,通常分布したデータとして株式価格データを分析し研究します.しかし,株式価格データの分布は標準的な正常分布に適合しません.Fisher Transformation通常分布に似たものへと変換できる方法ですFisher Transformation今日と前日の指標の交差を使用して取引シグナルを送信できます.
沢山の引用がありますFisher Transformation詳細に説明しません. しかし,この問題は,
インディケーター アルゴリズム:
-
今日の中央価格:
mid=(low + high) / 2 -
計算期間を確認します.各期間を10日使用できます. 期間中の最高価格と最低価格を計算します.
lowestLow = the lowest price in the period,highestHigh = the highest price in the period. -
価格変化パラメータを定義する (そのパラメータは
ratio0から1までの定数です.例えば,0.5か0.33を選択できます):(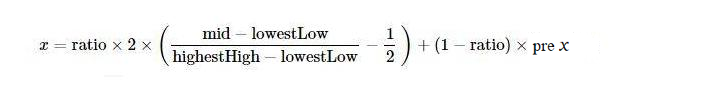
-
適用する
Fisher価格変化パラメータへの変換xそして,Fisherこの指標は,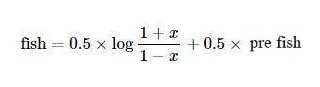
アルゴリズムを認識するためにJavaScriptを使用する
このアルゴリズムは繰り返しのアルゴリズムであり,preX, preFish初期設定は0ですMath.logさらに,上記のアルゴリズムでは x の修正について言及されていません. この問題を書きながらほとんど無視しました.
xの値を修正します.値が0.99を超えると,強制的に0.999に設定します.値が-0.999未満なら-0.999に設定します.
        if (x > 0.99) {
            x = 0.999
        } else if (x < -0.99) {
            x = -0.999
        }
アルゴリズムとインディケーターを初めて見ました. アルゴリズムに従って移植した後に. 実装を確認していません. 研究に興味のある学生は,エラーがあるかどうかを確認できます. 間違いがある場合は指摘してくれてありがとう.
ソースコードFisher Transformインディケーター アルゴリズム:
function getHighest(arr, period) {
    if (arr.length == 0 || arr.length - period < 0) {
        return null
    }
    var beginIndex = arr.length - period
    var ret = arr[beginIndex].High
    for (var i = 0 ; i < arr.length - 1 ; i++) {
        if (arr[i + 1].High > ret) {
            ret = arr[i + 1].High
        }
    }
    return ret
}

function getLowest(arr, period) {
    if (arr.length == 0 || arr.length - period < 0) {
        return null
    }
    var beginIndex = arr.length - period
    var ret = arr[beginIndex].Low
    for (var i = 0 ; i < arr.length - 1 ; i++) {
        if (arr[i + 1].Low < ret) {
            ret = arr[i + 1].Low
        }
    }
    return ret
}

function calcFisher(records, ratio, period) {
    var preFish = 0
    var preX = 0
    var arrFish = []
    // when the K-line length is not long enough to meet the K-line period
    if (records.length < period) {
        for (var i = 0 ; i < records.length ; i++) {
            arrFish.push(0)
        }
        return arrFish
    }

    // traverse K-lines
    for (var i = 0 ; i < records.length ; i++) {
        var fish = 0
        var x = 0
        var bar = records[i]
        var mid = (bar.High + bar.Low) / 2
        // when the current BAR is not enough for period to calculate
        if (i < period - 1) {
            fish = 0
            preFish = 0
            arrFish.push(fish)
            continue
        }

        // calculate the highest price and the lowest price in the period
        var bars = []
        for (var j = 0 ; j <= i ; j++) {
            bars.push(records[j])
        }
        var lowestLow = getLowest(bars, period)
        var highestHigh = getHighest(bars, period)

        // price change parameter x
        x = ratio * 2 * ((mid - lowestLow) / (highestHigh - lowestLow) - 0.5) + (1 - ratio) * preX
        if (x > 0.99) {
            x = 0.999
        } else if (x < -0.99) {
            x = -0.999
        }
        preX = x
        fish = 0.5 * Math.log((1 + x) / (1 - x)) + 0.5 * preFish
        preFish = fish
        arrFish.push(fish)
    }
    return arrFish
}
ストーリー
FMZのグラフ作成は非常に簡単です. 戦略スクエアには多くの例があります.https://www.fmz.com/square必要な戦略も検索できます
var cfg = {    // used to initially configure the chart objects (namely chart settings)
    plotOptions: {
        candlestick: {
            color: '#d75442',  // color value
            upColor: '#6ba583' // color vlaue
        }
    },
    title: { text: 'Fisher Transform'},     //title
    subtitle: {text: ''},     //subtitle
    plotOptions: {
        candlestick: {
        tooltip: {
            pointFormat:
            '<span style="color:{point.color}">\u25CF</span> <b> {series.name}</b><br/>' +
            'open: {point.open}<br/>' +
            'highest: {point.high}<br/>' +
            'lowest: {point.low}<br/>' +
            'close: {point.close}<br/>'
            }
        }
    },
    yAxis: [{
        title: {
            text: 'K-line market quote'
        },
        height: '70%',
        lineWidth: 1
    }, {
        title: {
            text: 'Fisher Transform'
        },
        top: '75%',
        height: '30%',
        offset: 0,
        lineWidth: 1
    }],
    series: [//series
        {
            type: 'candlestick',
            yAxis: 0,
            name: 'K-line',
            id: 'KLine',
            // control the candlestick color of fall
            color: 'green',
            lineColor: 'green',
            // control the candlestick color of rise
            upColor: 'red',
            upLineColor: 'red',
            data: []
        },{
            type: 'line',         // set the type of the current data series as: line
            yAxis: 1,             // the y axis for use is the y axis with index 0 (in highcharts, there can be multiple y axis, and here it indicates the y axis with index 0)
            showInLegend: true,   //
            name: 'fish',          // set according the parameter label  passed by the function
            lineWidth: 1,
            data: [],             // data item of the data series
            tooltip: {            // tip for tool
                valueDecimals: 2  //  the decimals of the value reserve 5
            }
        },{
            type: 'line',         // set the type of the current data series as: line
            yAxis: 1,             // the y axis for use is the y axis with index 0 (in highcharts, there can be multiple y axis, and here it indicates the y axis with index 0)
            showInLegend: true,   //
            name: 'preFish',      // set according the parameter label  passed by the function
            lineWidth: 1,
            data: [],             // data item of the data series
            tooltip: {            // tip for tool
                valueDecimals: 2  // the decimals of the value reserve 5
            }
        }
    ]
}

var chart = Chart(cfg)
function main() {
    var ts = 0
    chart.reset()
    while (true) {
        var r = exchange.GetRecords()
        var fisher = calcFisher(r, 0.33, 10)
        if (!r || !fisher) {
            Sleep(500)
            continue
        }

        for (var i = 0; i < r.length; i++){
            if (ts == r[i].Time) {
                chart.add([0,[r[i].Time, r[i].Open, r[i].High, r[i].Low, r[i].Close], -1])
                chart.add([1,[r[i].Time, fisher[i]], -1])
                if (i - 1 >= 0) {
                    chart.add([2,[r[i].Time, fisher[i - 1]], -1])
                }
            }else if (ts < r[i].Time) {
                chart.add([0,[r[i].Time, r[i].Open, r[i].High, r[i].Low, r[i].Close]])
                chart.add([1,[r[i].Time, fisher[i]]])
                if (i - 1 >= 0) {
                    chart.add([2,[r[i].Time, fisher[i - 1]]])
                }
                ts = r[i].Time
            }
        }
    }
}
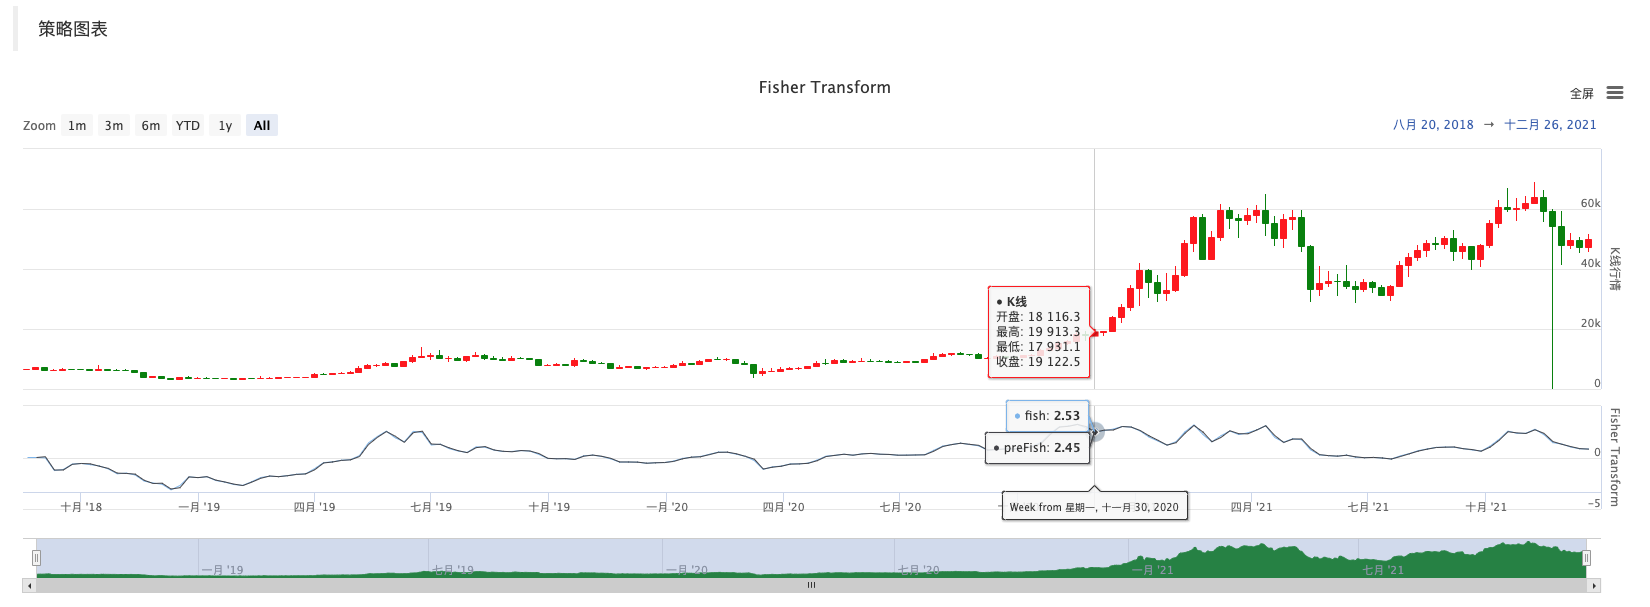
FMZでデータ,チャート表示,戦略設計を研究するのは非常に便利です 教師や生徒のコメントを歓迎します 教師や生徒のコメントを歓迎します
- 暗号通貨契約 単純なオーダー監督ボット
- getdepth で対応する時間軸を取得します.
- 無視して解決した
- 面値の問題
- dYdX 戦略設計例
- FMZの Python クローラーアプリケーションの初期調査
クローリングバイナンス 発表内容 - ヘッジ 戦略 設計 研究 & 待機中のスポットと先物注文の例
- 最近の状況と資金調達の利子戦略の推奨運用
- 暗号通貨先物 (Teaching) の二重移動平均ブレイクポイント戦略
- 仮想通貨スポット・マルチ・シンボル・ダブル・ムービング・平均戦略 (教学)
- 管理者
- 2021年暗号通貨のTAQレビュー&10倍増の最もシンプルな見逃した戦略
- 仮想通貨先物 多シンボル ART 戦略 (教学)
- アップグレード! 仮想通貨先物 マーティンゲール戦略
- Getrecords は秒単位で K 線図を取得できません
- FMZベースのオーダー同期管理システム設計 (2)
- Getticker が返した Volume データは間違っています
- FMZベースのオーダー同期管理システム設計 (1)
- 複数のチャート の 図書 室 を 設計 する
- 模擬ディスク環境