
YouTube マスターによる「魔法のダブル EMA 移動平均戦略」
今回は、「株式および暗号通貨市場のキラー」と呼ばれる、YouTube の「魔法のダブル EMA 移動平均戦略」について説明します。ビデオを見た後、この戦略は 2 つの Trading View インジケーターを使用する Trading View Pine 言語戦略であることがわかりました。ビデオのバックテスト結果が非常に良好で、FMZ が Trading View の Pine 言語もサポートしていることを知ったので、自分でバックテストして分析をテストしたくなりました。それでは、人生を始めましょう!ビデオの戦略を再現してみましょう。
戦略で使用される指標
- EMAインジケーター
設計を簡素化するために、ビデオに記載されている移動平均指数は使用しません。代わりに、Trading View に組み込まれている ta.ema を使用します (実際には同じものです)。
- VuManChuスイングフリーインジケーター
これはTrading View上のインジケーターです。Trading Viewにアクセスしてソースコードをダウンロードする必要があります。
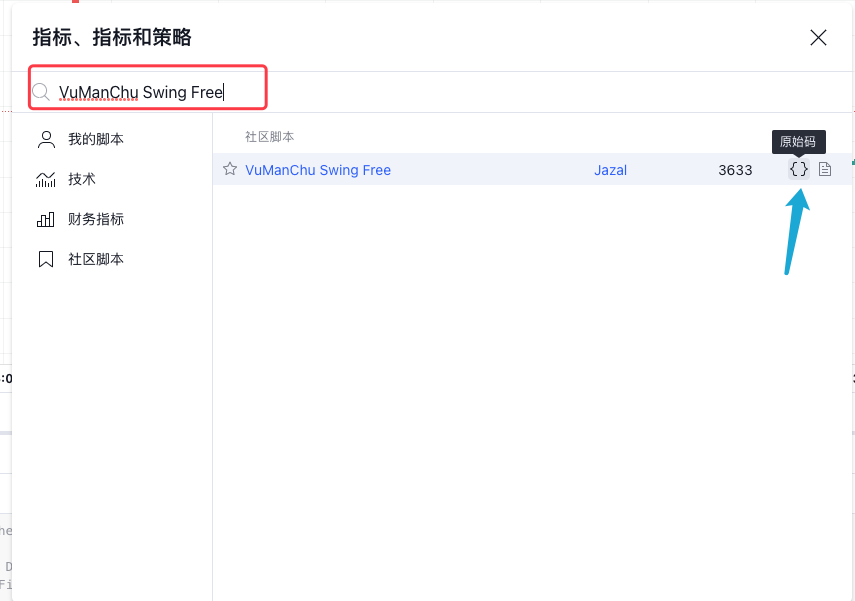
VuManChu Swing 無料コード:
pine
// This source code is subject to the terms of the Mozilla Public License 2.0 at https://mozilla.org/MPL/2.0/
// Credits to the original Script - Range Filter DonovanWall https://www.tradingview.com/script/lut7sBgG-Range-Filter-DW/
// This version is the old version of the Range Filter with less settings to tinker with
//@version=4
study(title="Range Filter - B&S Signals", shorttitle="RF - B&S Signals", overlay=true)
//-----------------------------------------------------------------------------------------------------------------------------------------------------------------
//Functions
//-----------------------------------------------------------------------------------------------------------------------------------------------------------------
//Range Size Function
rng_size(x, qty, n)=>
// AC = Cond_EMA(abs(x - x[1]), 1, n)
wper = (n*2) - 1
avrng = ema(abs(x - x[1]), n)
AC = ema(avrng, wper)*qty
rng_size = AC
//Range Filter Function
rng_filt(x, rng_, n)=>
r = rng_
var rfilt = array.new_float(2, x)
array.set(rfilt, 1, array.get(rfilt, 0))
if x - r > array.get(rfilt, 1)
array.set(rfilt, 0, x - r)
if x + r < array.get(rfilt, 1)
array.set(rfilt, 0, x + r)
rng_filt1 = array.get(rfilt, 0)
hi_band = rng_filt1 + r
lo_band = rng_filt1 - r
rng_filt = rng_filt1
[hi_band, lo_band, rng_filt]
//-----------------------------------------------------------------------------------------------------------------------------------------------------------------
//Inputs
//-----------------------------------------------------------------------------------------------------------------------------------------------------------------
//Range Source
rng_src = input(defval=close, type=input.source, title="Swing Source")
//Range Period
rng_per = input(defval=20, minval=1, title="Swing Period")
//Range Size Inputs
rng_qty = input(defval=3.5, minval=0.0000001, title="Swing Multiplier")
//Bar Colors
use_barcolor = input(defval=false, type=input.bool, title="Bar Colors On/Off")
//-----------------------------------------------------------------------------------------------------------------------------------------------------------------
//Definitions
//-----------------------------------------------------------------------------------------------------------------------------------------------------------------
//Range Filter Values
[h_band, l_band, filt] = rng_filt(rng_src, rng_size(rng_src, rng_qty, rng_per), rng_per)
//Direction Conditions
var fdir = 0.0
fdir := filt > filt[1] ? 1 : filt < filt[1] ? -1 : fdir
upward = fdir==1 ? 1 : 0
downward = fdir==-1 ? 1 : 0
//Trading Condition
longCond = rng_src > filt and rng_src > rng_src[1] and upward > 0 or rng_src > filt and rng_src < rng_src[1] and upward > 0
shortCond = rng_src < filt and rng_src < rng_src[1] and downward > 0 or rng_src < filt and rng_src > rng_src[1] and downward > 0
CondIni = 0
CondIni := longCond ? 1 : shortCond ? -1 : CondIni[1]
longCondition = longCond and CondIni[1] == -1
shortCondition = shortCond and CondIni[1] == 1
//Colors
filt_color = upward ? #05ff9b : downward ? #ff0583 : #cccccc
bar_color = upward and (rng_src > filt) ? (rng_src > rng_src[1] ? #05ff9b : #00b36b) :
downward and (rng_src < filt) ? (rng_src < rng_src[1] ? #ff0583 : #b8005d) : #cccccc
//-----------------------------------------------------------------------------------------------------------------------------------------------------------------
//Outputs
//-----------------------------------------------------------------------------------------------------------------------------------------------------------------
//Filter Plot
filt_plot = plot(filt, color=filt_color, transp=67, linewidth=3, title="Filter")
//Band Plots
h_band_plot = plot(h_band, color=color.new(#05ff9b, 100), title="High Band")
l_band_plot = plot(l_band, color=color.new(#ff0583, 100), title="Low Band")
//Band Fills
fill(h_band_plot, filt_plot, color=color.new(#00b36b, 92), title="High Band Fill")
fill(l_band_plot, filt_plot, color=color.new(#b8005d, 92), title="Low Band Fill")
//Bar Color
barcolor(use_barcolor ? bar_color : na)
//Plot Buy and Sell Labels
plotshape(longCondition, title = "Buy Signal", text ="BUY", textcolor = color.white, style=shape.labelup, size = size.normal, location=location.belowbar, color = color.new(color.green, 0))
plotshape(shortCondition, title = "Sell Signal", text ="SELL", textcolor = color.white, style=shape.labeldown, size = size.normal, location=location.abovebar, color = color.new(color.red, 0))
//Alerts
alertcondition(longCondition, title="Buy Alert", message = "BUY")
alertcondition(shortCondition, title="Sell Alert", message = "SELL")
戦略ロジック
EMA インジケーター: この戦略では、2 つの EMA 移動平均、1 つの高速ライン (小さいサイクル パラメーター) と 1 つの低速ライン (大きいサイクル パラメーター) を使用します。二重 EMA 移動平均の主な機能は、市場のトレンドの方向を判断することです。
-
ロングアレンジ
高速ラインは低速ラインの上にあります。 -
ショートアレンジ
高速ラインは低速ラインの下にあります。
VuManChu Swing Free インジケーター: VuManChu Swing Free インジケーターは、シグナルを送信するために使用され、その後、他の条件と組み合わせて、取引の注文を出すかどうかを決定します。 VuManChu Swing Free インジケーターのソース コードから、longCondition 変数は買いシグナルを表し、shortCondition 変数は売りシグナルを表していることがわかります。これら 2 つの変数は、後で注文条件を記述するときに使用されます。
ここで、戦略の特定の取引シグナルのトリガー条件について説明します。
-
ロングポジションに入るためのルール:
ポジティブなKラインの終値はEMAの高速ラインより上、2つのEMA移動平均は強気の配置(高速ラインが低速ラインより上)で、VuManChu Swing Freeインジケーターは買いシグナルを示しているはずです。 (longCondition は true)。 3 つの条件が満たされている場合、この K ラインはロング ポジションに入るための重要な K ラインとなり、この K ラインの終値がエントリー ポジションとなります。 -
ショートポジションに入るためのルール(ロングポジションの反対):
ネガティブローソク足の終値は高速EMAラインを下回り、2つのEMA移動平均はショートポジション(高速ラインは低速ラインを下回る)になり、VuManChu Swing Freeインジケーターは売りシグナル(shortCondition)を示す必要があります。は本当です。 3 つの条件が満たされた場合、この K ラインの終値が空売りのエントリー ポイントになります。
取引ロジックは非常にシンプルではないでしょうか?ソースビデオではテイクプロフィットとストップロスが指定されていないため、エディターは固定ポイントのストップロスとトラッキングを使用して、より穏やかなテイクプロフィットとストップロスの方法を使用します。利益確定。
コード設計
VuManChu Swing Free インジケーターのコードをそのまま戦略コードに直接組み込みました。
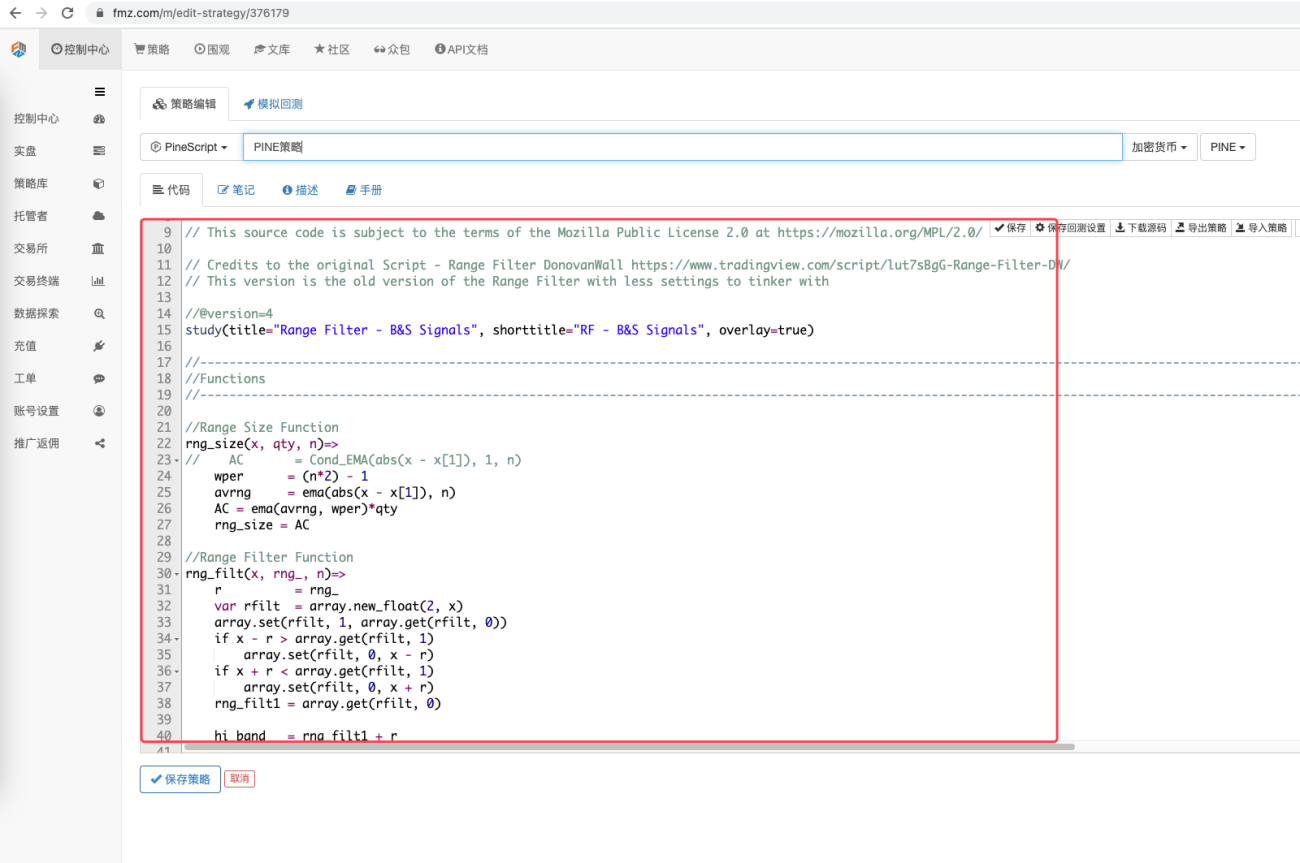
次に、トランザクション機能を実装するための Pine 言語コードを記述します。
pine
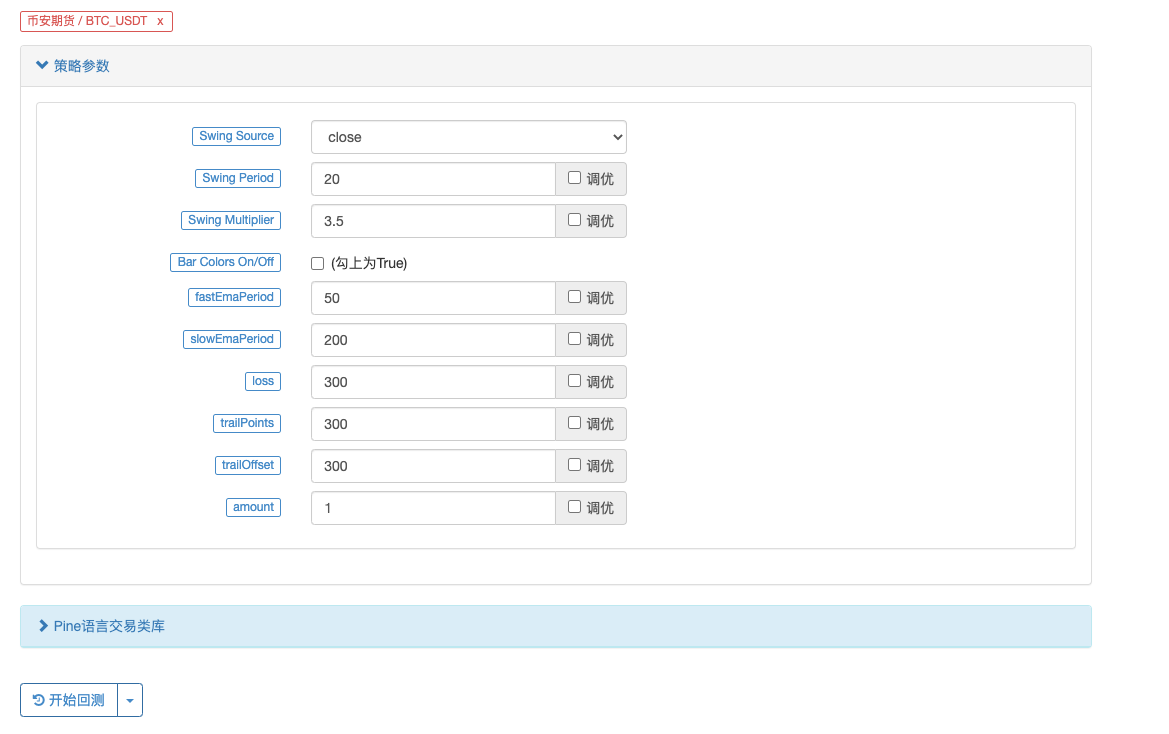
// extend
fastEmaPeriod = input(50, "fastEmaPeriod") // 快线周期
slowEmaPeriod = input(200, "slowEmaPeriod") // 慢线周期
loss = input(30, "loss") // 止损点数
trailPoints = input(30, "trailPoints") // 移动止盈触发点数
trailOffset = input(30, "trailOffset") // 移动止盈偏移量(点数)
amount = input(1, "amount") // 下单量
emaFast = ta.ema(close, fastEmaPeriod) // 计算快线EMA
emaSlow = ta.ema(close, slowEmaPeriod) // 计算慢线EMA
buyCondition = longCondition and emaFast > emaSlow and close > open and close > emaFast // 做多入场条件
sellCondition = shortCondition and emaFast < emaSlow and close < open and close < emaFast // 做空入场条件
if buyCondition and strategy.position_size == 0
strategy.entry("long", strategy.long, amount)
strategy.exit("exit_long", "long", amount, loss=loss, trail_points=trailPoints, trail_offset=trailOffset)
if sellCondition and strategy.position_size == 0
strategy.entry("short", strategy.short, amount)
strategy.exit("exit_short", "short", amount, loss=loss, trail_points=trailPoints, trail_offset=trailOffset)
A. ご覧のとおり、buyCondition が true の場合:
- longCondition 変数は true です (VuManChu Swing Free インジケーターはロングになる信号を送信します)。
- emaFast > emaSlow (EMA 強気配置)。
- 終値 > 始値 (現在の BAR が正のラインであることを示します)、終値 > emaFast (終値が EMA ファスト ラインより上にあることを示します)。
ロングになるための3つの条件が満たされています。
B. sellCondition が true の場合、空売りの 3 つの条件が満たされます (ここでは説明しません)。
次に、if 条件によってシグナルがトリガーされたと判断された場合、strategy.entry 関数を使用して市場に参入し、ポジションを開き、strategy.exit 関数を設定して損失とトレーリング プロフィットを停止します。
完全なコード
            pine

            /*backtest
start: 2022-01-01 00:00:00
end: 2022-10-08 00:00:00
period: 15m
basePeriod: 5m
exchanges: [{"eid":"Futures_Binance","currency":"ETH_USDT"}]
args: [["ZPrecision",0,358374]]
*/

// This source code is subject to the terms of the Mozilla Public License 2.0 at https://mozilla.org/MPL/2.0/

// Credits to the original Script - Range Filter DonovanWall https://www.tradingview.com/script/lut7sBgG-Range-Filter-DW/
// This version is the old version of the Range Filter with less settings to tinker with

//@version=4
study(title="Range Filter - B&S Signals", shorttitle="RF - B&S Signals", overlay=true)

//-----------------------------------------------------------------------------------------------------------------------------------------------------------------
//Functions
//-----------------------------------------------------------------------------------------------------------------------------------------------------------------

//Range Size Function
rng_size(x, qty, n)=>
//    AC       = Cond_EMA(abs(x - x[1]), 1, n)
    wper      = (n*2) - 1
    avrng     = ema(abs(x - x[1]), n)
    AC = ema(avrng, wper)*qty
    rng_size = AC

//Range Filter Function
rng_filt(x, rng_, n)=>
    r          = rng_
    var rfilt  = array.new_float(2, x)
    array.set(rfilt, 1, array.get(rfilt, 0))
    if x - r > array.get(rfilt, 1)
        array.set(rfilt, 0, x - r)
    if x + r < array.get(rfilt, 1)
        array.set(rfilt, 0, x + r)
    rng_filt1 = array.get(rfilt, 0)

    hi_band   = rng_filt1 + r
    lo_band   = rng_filt1 - r
    rng_filt  = rng_filt1
    [hi_band, lo_band, rng_filt]

//-----------------------------------------------------------------------------------------------------------------------------------------------------------------
//Inputs
//-----------------------------------------------------------------------------------------------------------------------------------------------------------------

//Range Source
rng_src = input(defval=close, type=input.source, title="Swing Source")

//Range Period
rng_per = input(defval=20, minval=1, title="Swing Period")

//Range Size Inputs
rng_qty   = input(defval=3.5, minval=0.0000001, title="Swing Multiplier")

//Bar Colors
use_barcolor = input(defval=false, type=input.bool, title="Bar Colors On/Off")

//-----------------------------------------------------------------------------------------------------------------------------------------------------------------
//Definitions
//-----------------------------------------------------------------------------------------------------------------------------------------------------------------

//Range Filter Values
[h_band, l_band, filt] = rng_filt(rng_src, rng_size(rng_src, rng_qty, rng_per), rng_per)

//Direction Conditions
var fdir = 0.0
fdir    := filt > filt[1] ? 1 : filt < filt[1] ? -1 : fdir
upward   = fdir==1 ? 1 : 0
downward = fdir==-1 ? 1 : 0

//Trading Condition
longCond = rng_src > filt and rng_src > rng_src[1] and upward > 0 or rng_src > filt and rng_src < rng_src[1] and upward > 0
shortCond = rng_src < filt and rng_src < rng_src[1] and downward > 0 or rng_src < filt and rng_src > rng_src[1] and downward > 0

CondIni = 0
CondIni := longCond ? 1 : shortCond ? -1 : CondIni[1]
longCondition = longCond and CondIni[1] == -1
shortCondition = shortCond and CondIni[1] == 1

//Colors
filt_color = upward ? #05ff9b : downward ? #ff0583 : #cccccc
bar_color  = upward and (rng_src > filt) ? (rng_src > rng_src[1] ? #05ff9b : #00b36b) :
             downward and (rng_src < filt) ? (rng_src < rng_src[1] ? #ff0583 : #b8005d) : #cccccc

//-----------------------------------------------------------------------------------------------------------------------------------------------------------------
//Outputs
//-----------------------------------------------------------------------------------------------------------------------------------------------------------------

//Filter Plot
filt_plot = plot(filt, color=filt_color, transp=67, linewidth=3, title="Filter")

//Band Plots
h_band_plot = plot(h_band, color=color.new(#05ff9b, 100), title="High Band")
l_band_plot = plot(l_band, color=color.new(#ff0583, 100), title="Low Band")

//Band Fills
fill(h_band_plot, filt_plot, color=color.new(#00b36b, 92), title="High Band Fill")
fill(l_band_plot, filt_plot, color=color.new(#b8005d, 92), title="Low Band Fill")

//Bar Color
barcolor(use_barcolor ? bar_color : na)

//Plot Buy and Sell Labels
plotshape(longCondition, title = "Buy Signal", text ="BUY", textcolor = color.white, style=shape.labelup, size = size.normal, location=location.belowbar, color = color.new(color.green, 0))
plotshape(shortCondition, title = "Sell Signal", text ="SELL", textcolor = color.white, style=shape.labeldown, size = size.normal, location=location.abovebar, color = color.new(color.red, 0))

//Alerts
alertcondition(longCondition, title="Buy Alert", message = "BUY")
alertcondition(shortCondition, title="Sell Alert", message = "SELL")


// extend
fastEmaPeriod = input(50, "fastEmaPeriod")
slowEmaPeriod = input(200, "slowEmaPeriod")
loss = input(30, "loss")
trailPoints = input(30, "trailPoints")
trailOffset = input(30, "trailOffset")
amount = input(1, "amount")

emaFast = ta.ema(close, fastEmaPeriod)
emaSlow = ta.ema(close, slowEmaPeriod)

buyCondition = longCondition and emaFast > emaSlow and close > open and close > emaFast
sellCondition = shortCondition and emaFast < emaSlow and close < open and close < emaFast

if buyCondition and strategy.position_size == 0
    strategy.entry("long", strategy.long, amount)
    strategy.exit("exit_long", "long", amount, loss=loss, trail_points=trailPoints, trail_offset=trailOffset)
if sellCondition and strategy.position_size == 0
    strategy.entry("short", strategy.short, amount)
    strategy.exit("exit_short", "short", amount, loss=loss, trail_points=trailPoints, trail_offset=trailOffset)
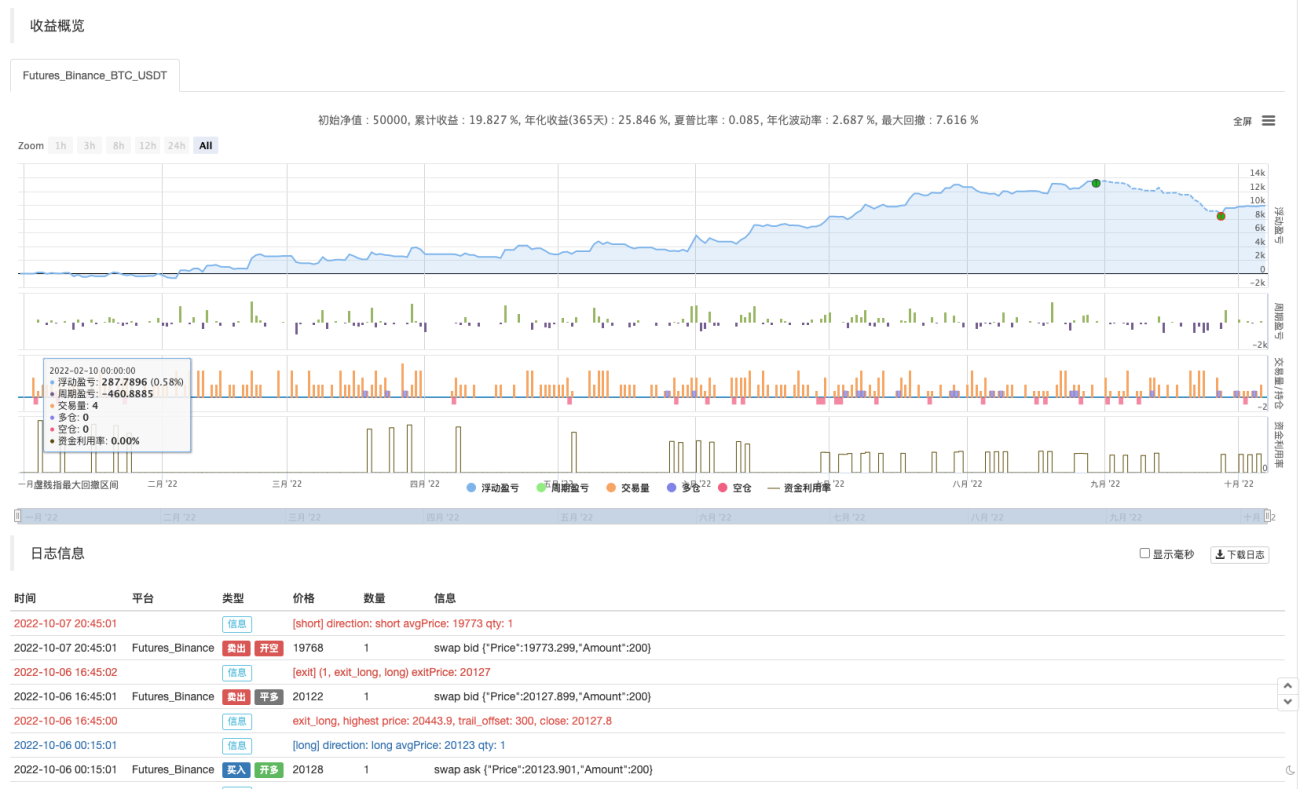
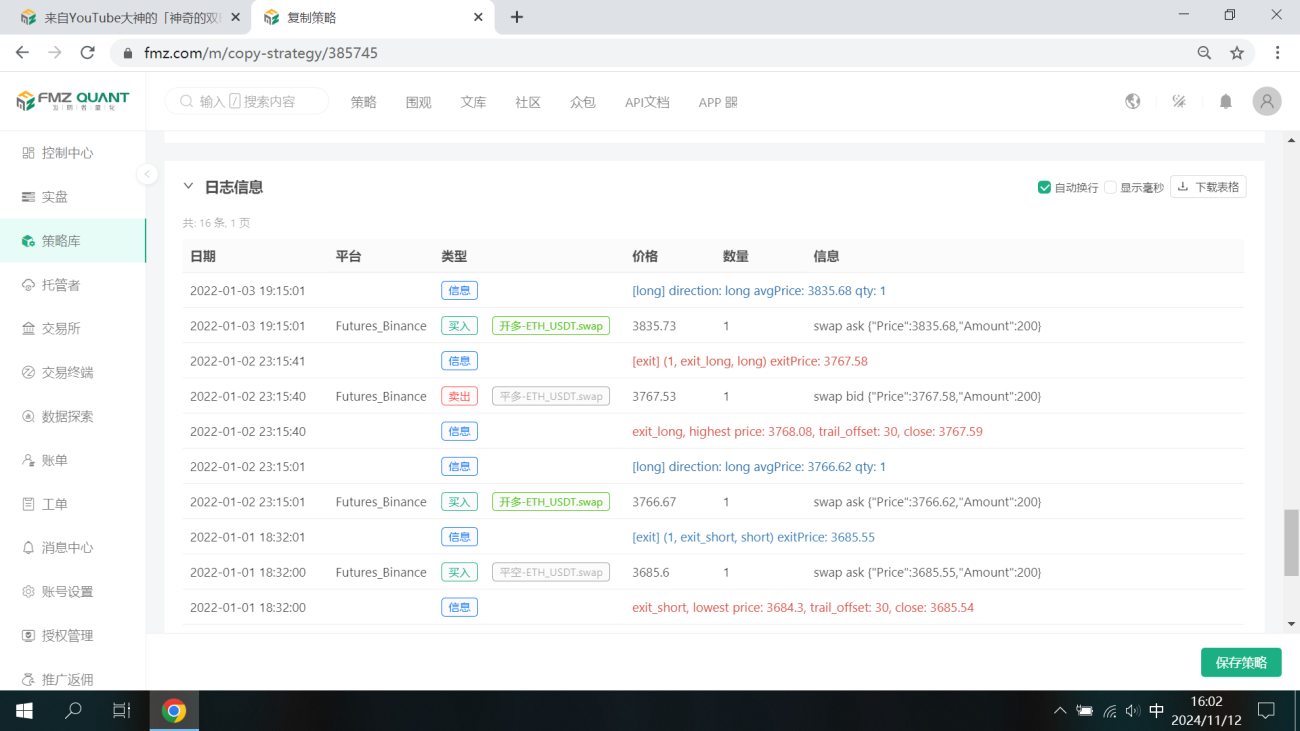
バックテスト
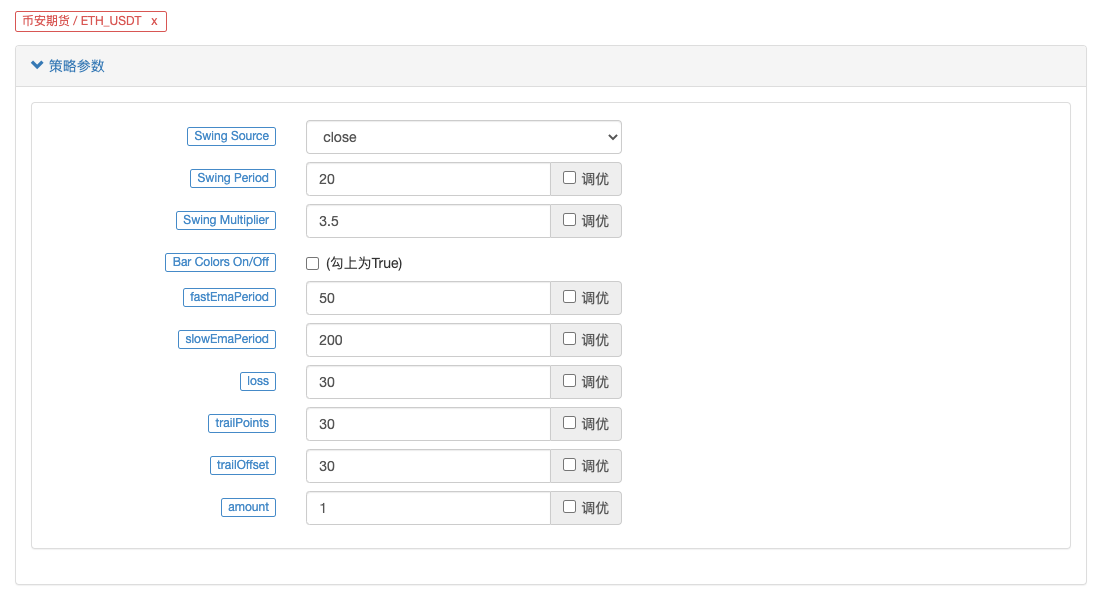
バックテストの時間範囲は 2022 年 1 月から 2022 年 10 月まで選択され、K ライン期間は 15 分であり、バックテストには終値モデルが使用されます。市場はBinanceのETH_USDT永久契約を選択します。パラメータ設定はソース ビデオに記載されているとおりです。高速ラインの場合は 50 期間、低速ラインの場合は 200 期間で、その他のパラメータはデフォルトで変更されません。私はストップロスとトレーリングプロフィットポイントの設定に少し主観的であり、それらを 30 ポイントに設定しています。
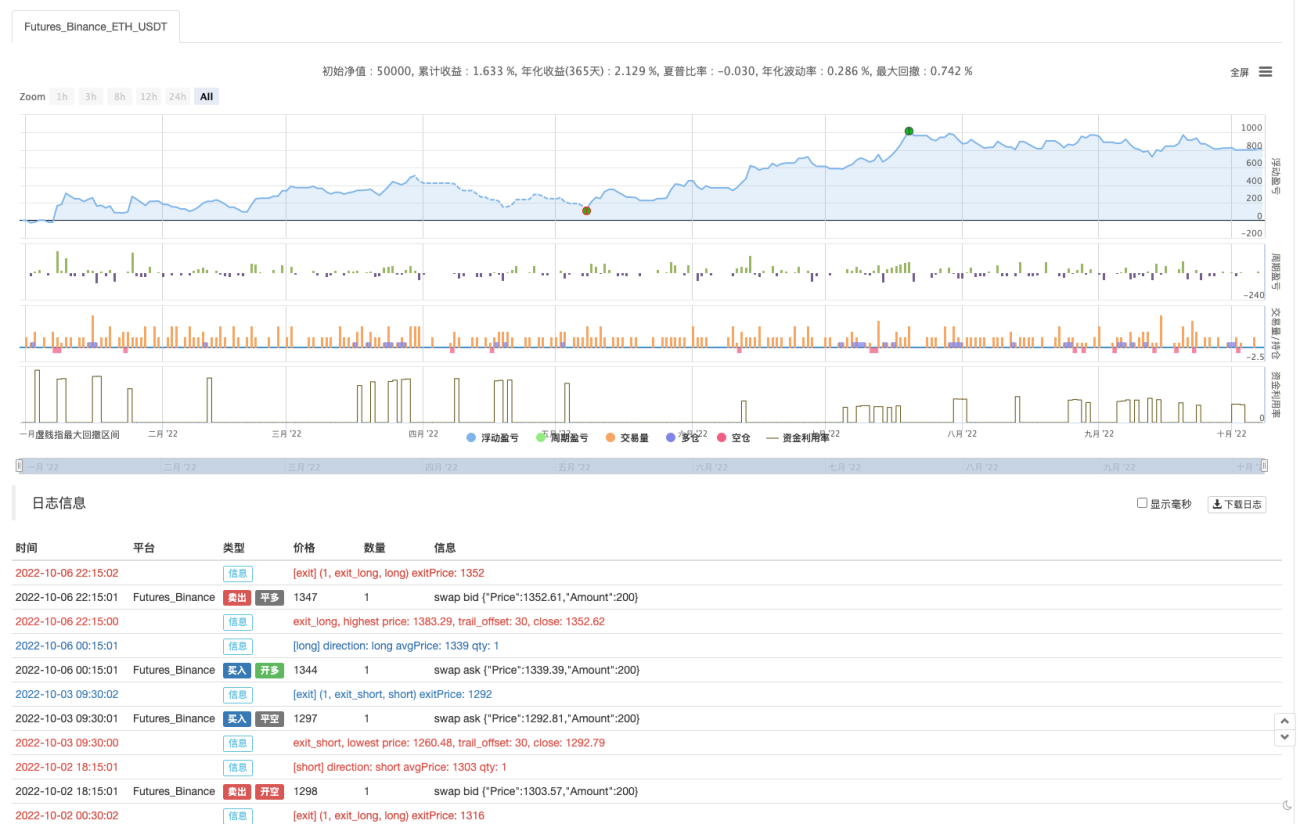
バックテストの結果はまあまあです。複数回のバックテストの後、テイクプロフィットやストップロスなどのパラメータがバックテストの結果に何らかの影響を与えているようです。この側面はさらに最適化する必要があると感じています。ただし、戦略シグナルがトランザクションをトリガーした後も、勝率は依然として良好です。
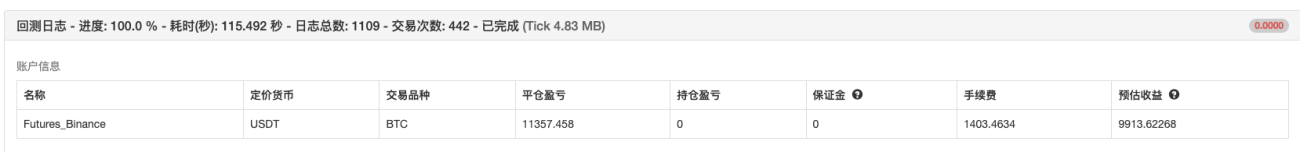
BTC_USDT 永久契約を試してみましょう:
BTC のバックテストの結果も爆発的です。
戦略アドレス: https://www.fmz.com/strategy/385745
この取引方法はトレンドを把握するのに比較的信頼性が高く、このアイデアに基づいて設計をさらに最適化できると思われます。この記事では、二重移動平均戦略の考え方を学んだだけでなく、YouTube の達人の戦略を処理して学習する方法も学びました。上記の戦略コードはあくまでも私の提案です。バックテストの結果は、具体的な実際の結果を表すものではありません。戦略コードと設計は参考用です。応援ありがとうございました、また次回お会いしましょう!


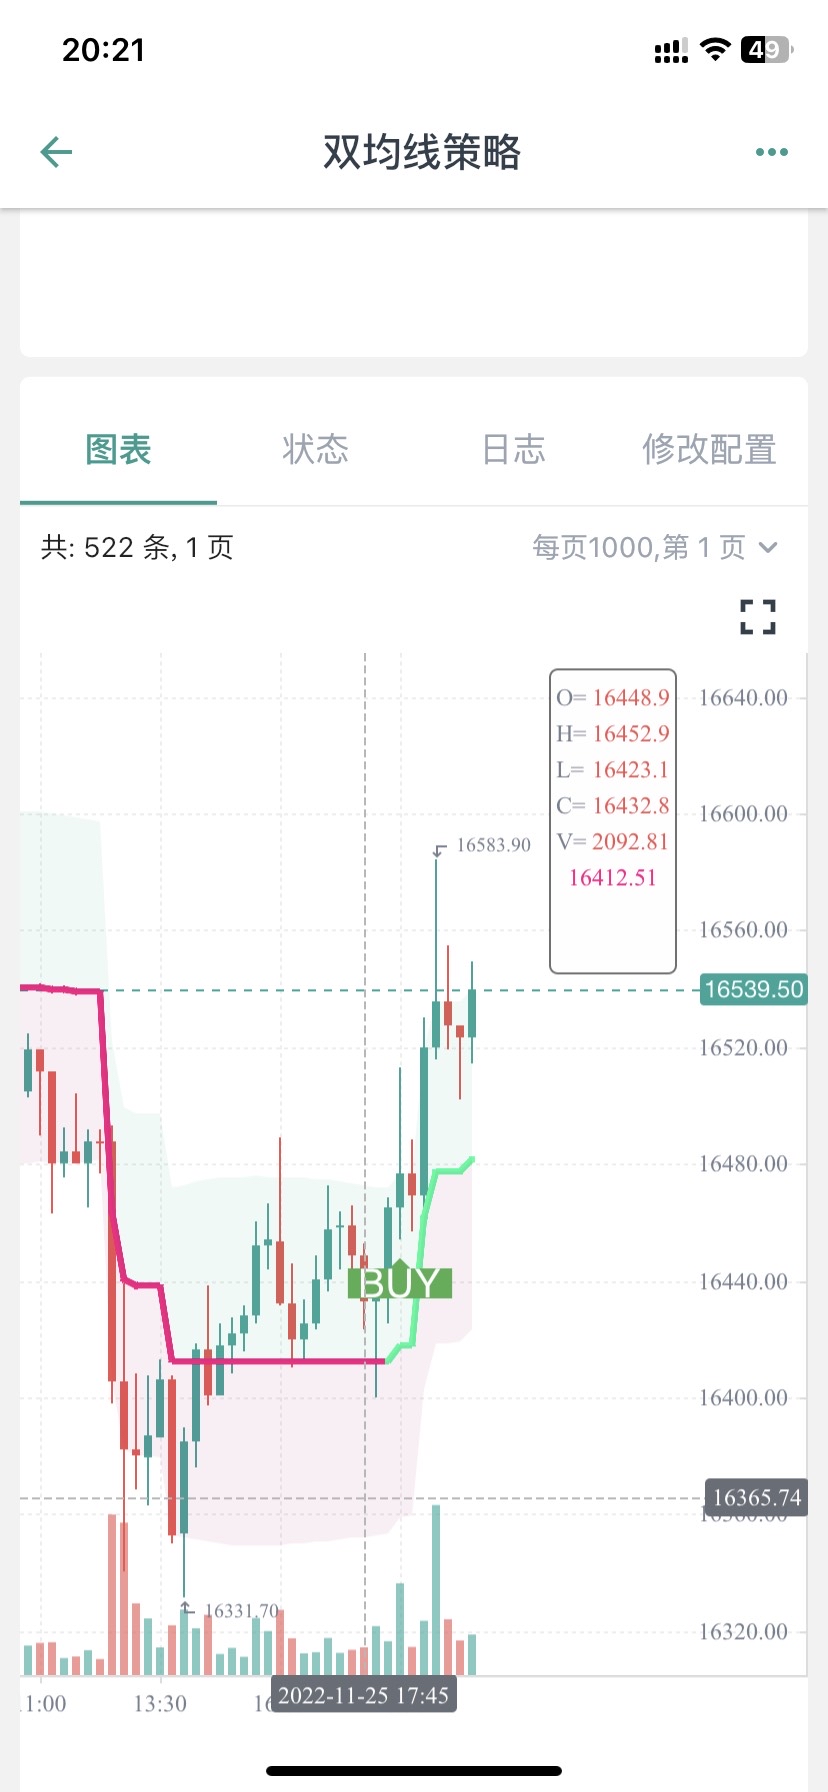


您好,这个是因为图表上显示的BUY标记只是文章中指标的信号显示,后面还结合了均线。
            //Plot Buy and Sell Labels
plotshape(longCondition, title = "Buy Signal", text ="BUY", textcolor = color.white, style=shape.labelup, size = size.normal, location=location.belowbar, color = color.new(color.green, 0))
plotshape(shortCondition, title = "Sell Signal", text ="SELL", textcolor = color.white, style=shape.labeldown, size = size.normal, location=location.abovebar, color = color.new(color.red, 0))
plotshape(longCondition, title = "Buy Signal", text ="BUY 画图显示时,只是longCondition条件符合了。
下单条件在这一块:
            if buyCondition and strategy.position_size == 0
    strategy.entry("long", strategy.long, amount)
    strategy.exit("exit_long", "long", amount, loss=loss, trail_points=trailPoints, trail_offset=trailOffset)
if sellCondition and strategy.position_size == 0
    strategy.entry("short", strategy.short, amount)
    strategy.exit("exit_short", "short", amount, loss=loss, trail_points=trailPoints, trail_offset=trailOffset)

梦大,建议从油管找两三个具有代表性的,改写难度较大,函数、参数、运算方式较多的策略做几个文字版的教程,比如带有类似【line.delete】这样的。(不需要策略盈利,就算是亏损的策略也无所谓,主要是用来学习写策略)。
我现在用这个双均线的策略,已经学会改一些不是非常复杂的组合策略了,改了十几个组合策略,其中有一两个确实是21年22年数据回测结果非常不错的,也已经在跑实盘测试了,但是遇到复杂函数参数运算这种【比如提示:line: 62 Could not find function or function reference 'line.delete',】而在FMZ PINE Script 文档并没有找到line.delete相关解释,用法说明,就懵圈了,所以希望梦大能弄点儿复杂策略改写一下,当然注释也多一些最好。就更方便学习了。[抱拳]
谢谢梦大。


梦大,请教下,PINE可以写复杂点儿的止盈方式吗?比如分层级止盈这样的???谢谢。
如果PINE可以和JS混编就好了,比如用PINE写指标,JS写交易部分就方便多了。。。。。
好的,谢谢梦大,另外请教下,PINE回测时间区间有限制吗?我选择2021年1月1日,到2022年10月11日,提示错误:
RuntimeError: abort(undefined) at Error at jsStackTrace (eval at self.onmessage (https://www.fmz.com/scripts/worker_detours.393054f7.js:1:147), <anonymous>:1:2096171) at stackTrace (eval at self.onmessage (https://www.fmz.com/scripts/worker_detours.393054f7.js:1:147), <anonymous>:1:2096345) at abort (eval at self.onmessage (https://www.fmz.com/scripts/worker_detours.393054f7.js:1:147), <anonymous>:1:2092408) at _abort (eval at self.onmessage (https://www.fmz.com/scripts/worker_detours.393054f7.js:1:147), <anonymous>:1:2137287) at <anonymous>:wasm-function[1297]:0x76bdc at <anonymous>:wasm-function[466]:0x3d789 at <anonymous>:wasm-function[477]:0x42e6b at <anonymous>:wasm-function[471]:0x4149e at <anonymous>:wasm-function[453]:0x3bf18 at <anonymous>:wasm-function[173]:0x13122
但是如果不改时间段就正常回测了。。。。 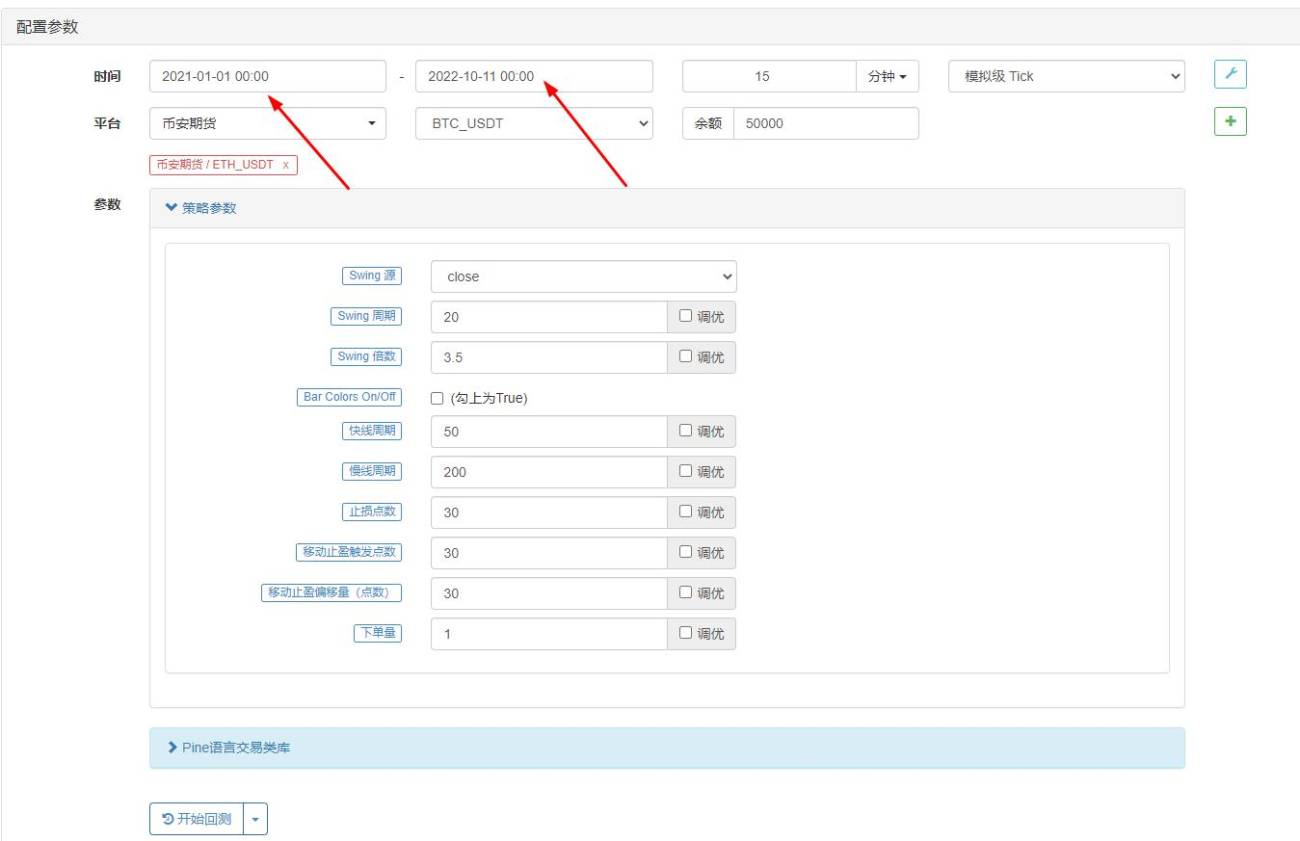

- 1