線形回帰 ++
作者: リン・ハーンチャオチャン開催日:2022年5月24日 (火) 14:17:42タグ:DEV
公共の需要に
線形回帰式 警告 を 含め て 削除 さ れ た 計算
富んだ機能を愛するトレーダーのための線形回帰スクリプトです
特徴 ++ 多時間枠 -> 異なるチャートからのソース回帰 ++ カスタマイズされた色 -> これは松の線を含みます ++スムージング -> フィルタリング回帰を許可する; 注: 1 を使用し,元の行にデフォルトを設定します. デフォルトは 1 です. ++ チャンネル/範囲の横断に関する警報
使用 ++ ブレイクアウトとリバースでこれを使います ++ このスクリプトは独立して使用することはできません.
リスク このスクリプトはボリンジャー帯のようなもので,トレンド範囲に落ちるリスクがあります. シグナルが同じ方向に動いて 市場が逆転している間も
要求事項 機能のご要望があれば,下記にコメントするか,DMしてください. できる限りお答えします. 図表に書き込み,アイデアを共有してください.
このスクリプトを使用してください 元の計算式はここにあります
気に入って欲しい 心から
バックテスト
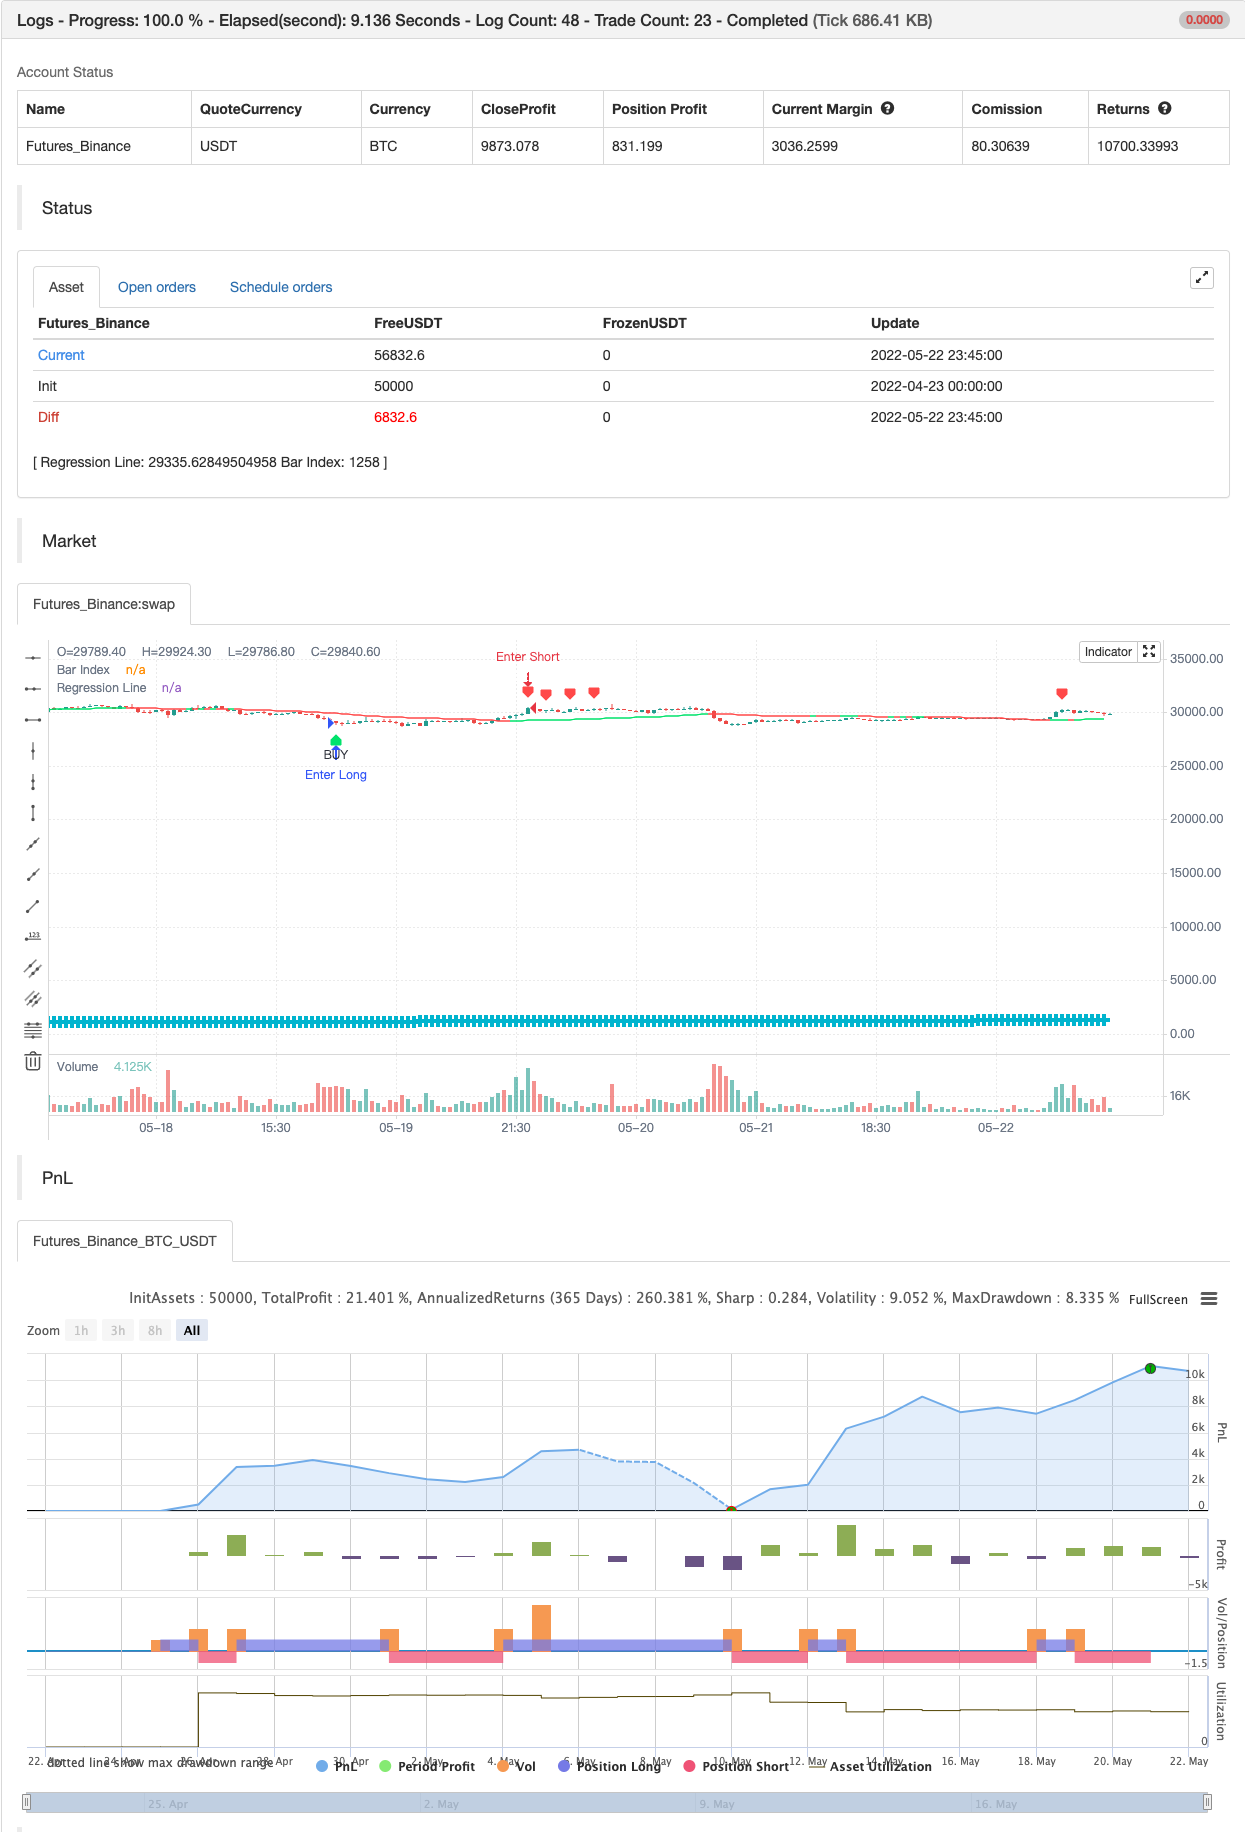
/*backtest
start: 2022-04-23 00:00:00
end: 2022-05-22 23:59:00
period: 45m
basePeriod: 5m
exchanges: [{"eid":"Futures_Binance","currency":"BTC_USDT"}]
*/

// This source code is subject to the terms of the Mozilla Public License 2.0 at https://mozilla.org/MPL/2.0/
// © LucemAnb
// User Version

//@version=4
study("Linear Regression ++ [Lucem Anb]", "Lin Reg ++ [Lucem Anb]", overlay=true)


source      = input(close)
length      = input(100, minval=1)
offset      = input(0, minval=0)
dev         = input(2.0, "Deviation")
smoothing   = input(1, minval=1)
mtf_val     = input("", "Resolution", input.resolution)
line_thick  = input(4, "S&R Thickness", minval=1, maxval=4)
signals     = input("Recent", "Signals Display", options=["Recent", "All"])
p           = input("Lime", "Up Color", options=["Red", "Lime", "Orange", "Teal", "Yellow", "White", "Black"])
q           = input("Red", "Down Color", options=["Red", "Lime", "Orange", "Teal", "Yellow", "White", "Black"])
goto        = input(0, "End At Bar Index")

cc(x) => x=="Red"?color.red:x=="Lime"?color.lime:x=="Orange"?color.orange:x=="Teal"?
 color.teal:x=="Yellow"?color.yellow:x=="Black"?color.black:color.white
data(x) => sma(security(syminfo.tickerid, mtf_val!="" ? mtf_val : timeframe.period, x), smoothing)

linreg = data(linreg(source, length, offset))
linreg_p = data(linreg(source, length, offset+1))
plot(linreg, "Regression Line", cc(linreg>linreg[1]?p:q), editable=false)

x = bar_index
slope = linreg - linreg_p
intercept = linreg - x*slope
deviationSum = 0.0
for i=0 to length-1
    deviationSum:= deviationSum + pow(source[i]-(slope*(x-i)+intercept), 2)
deviation = sqrt(deviationSum/(length))
x1 = x-length
x2 = x
y1 = slope*(x-length)+intercept
y2 = linreg

updating = goto <= 0 or x < goto


dm_current = -deviation*dev + y2
dp_current = deviation*dev + y2
buy = crossunder(close, dm_current)
sell = crossover(close, dp_current)
alertcondition(buy, "Buy Lin Reg", "Crossing On the Lower Regression Channel")
alertcondition(sell, "Sell Lin Reg", "Crossing On the Higher Regression Channel")

plotshape(buy, "BUY", shape.labelup, location.belowbar, color.lime, text='BUY', textcolor=color.black, show_last=signals=="All"?99999999:length)
plotshape(sell, "SELL", shape.labeldown, location.abovebar, color.red, text='SELL', textcolor=color.white, show_last=signals=="All"?99999999:length)

plot(x, "Bar Index", color.aqua, line_thick, plot.style_cross, display=display.none)

if buy
    strategy.entry("Enter Long", strategy.long)
else if sell
    strategy.entry("Enter Short", strategy.short)
関連性
もっと
- Scalping Swing Trading ツール R1-4
- 最良の飲み込み+脱出戦略
- Bollinger Awesome アラート R1
- マルチ取引所兼用プラグイン
- 三角利息 (小額通貨の格差)
- bybit逆契約動的格子 (特異格子)
- MT4 MT5 + ダイナミック変数へのTradingViewアラート
- マトリックスシリーズ
- スーパースカルパー - 5分 15分
- 相対力指数 - 差異 - リバータス
- レッドK ダュアル・ヴァーダー エネルギーバー
- コンソリデーションゾーン - ライブ
- 定量 定性 評価
- 移動平均のクロスアラート,多時間枠 (MTF)
- MACD 再充電戦略
- 超トレンド移動平均値
- ABC取引
- 15MIN BTCUSDTPERP BOT
- シャノンエントロピー V2
- 負荷が減る