암호화폐 선물 다중 기호 ART 전략 (교양)
저자:니나바다스, 창작: 2022-04-07 11:09:42, 업데이트: 2022-04-07 16:15:14암호화폐 선물 다중 기호 ART 전략 (교양)
최근, 우리 플랫폼의 일부 사용자는 MyLanguage 전략을 JavaScript 전략으로 포트하는 것을 매우 기대하고 있습니다. 따라서 많은 최적화 아이디어를 유연하게 추가 할 수 있습니다. 그들은 심지어 전략을 멀티 심볼 버전으로 확장하기를 원합니다. MyLanguage 전략은 일반적으로 트렌드 전략이며, 많은 것이 가까운 가격 모델에서 실행되기 때문입니다. 그러한 전략은 플랫폼 API 인터페이스를 매우 자주 요청하지 않으며, 멀티 심볼 전략 버전으로 포트하는 데 더 적합합니다. 기사에서는 간단한 MyLanguage 전략을 예로 받아 간단한 JavaScript 언어 버전으로 포트합니다. 주요 목적은 교육, 백테스트 및 연구입니다. 전략을 실행하고 싶다면 몇 가지 세부 사항을 추가해야 할 수 있습니다. (예: 주문 금액, 정확성, 주문 금액, 자산에 따라 주문 상태, 정보 비율 표시 및 기타), 또한 실제 틱 테스트를 실행해야합니다.
마이랑게이지 전략이 포트될 것
TR:=MAX(MAX((H-L),ABS(REF(C,1)-H)),ABS(REF(C,1)-L));
ATR:=EMA(TR,LENGTH2);

MIDLINE^^EMA((H + L + C)/3,LENGTH1);
UPBAND^^MIDLINE + N*ATR;
DOWNBAND^^MIDLINE - N*ATR;


BKVOL=0 AND C>=UPBAND AND REF(C,1)<REF(UPBAND,1),BPK;
SKVOL=0 AND C<=DOWNBAND AND REF(C,1)>REF(DOWNBAND,1),SPK;

BKVOL>0 AND C<=MIDLINE,SP(BKVOL);
SKVOL>0 AND C>=MIDLINE,BP(SKVOL);
// stop loss
C>=SKPRICE*(1+SLOSS*0.01),BP;
C<=BKPRICE*(1-SLOSS*0.01),SP;
AUTOFILTER;
전략 논리는 매우 간단합니다. 먼저 매개 변수에 따라 ATR을 계산하고, K-라인 BAR의 모든 최고, 최저, 폐쇄 및 개방 가격의 평균 값을 계산하여 EMA 지표를 계산합니다. 마지막으로, 매개 변수에서 ATR 및 비율 N을 기반으로 upBand 및 downBand를 계산합니다.
오픈 포지션과 리버스 포지션은 마이너스 포지션과 마이너스 포지션의 마이너스 포지션을 구분하여 마이너스 포지션과 마이너스 포지션을 구분합니다. 마이너스 포지션은 마이너스 포지션과 마이너스 포지션을 구분합니다. 클로즈 가격이 중간선에 도달하면 클로즈 포지션; 클로즈 가격이 스톱 로스 가격에 도달하면 클로즈 포지션 (SLOSS에 따라 스톱 로스; SLOSS가 1이면 0.01, 즉 1%). 이 전략은 클로즈 가격 모델로 실행됩니다.
Mylanguage의 전략적 요구사항과 생각을 이해하면
항구 및 설계 전략 프로토타입
전략 프로토타입 코드는 너무 길지 않고 1~200줄 정도입니다. 전략 작성 아이디어를 편리하게 공부할 수 있도록, 저는 직접 전략 코드에 언급을 적습니다.
// parse params, from string to object
var arrParam = JSON.parse(params)

// the function creates the chart configuration
function createChartConfig(symbol, atrPeriod, emaPeriod, index) {   // symbol: trading pair; atrPeriod: ATR parameter period;  emaPeriod: EMA parameter period; index: index of the corresponding exchange object
    var chart = {
        __isStock: true,
        extension: {
                layout: 'single',
                height: 600,
        },
        title : { text : symbol},
        xAxis: { type: 'datetime'},
        series : [
            {
                type: 'candlestick',    // K-line data series
                name: symbol,
                id: symbol + "-" + index,
                data: []
            }, {
                type: 'line',           // EMA
                name: symbol + ',EMA:' + emaPeriod,
                data: [],
            }, {
                type: 'line',           // upBand
                name: symbol + ',upBand' + atrPeriod,
                data: []
            }, {
                type: 'line',           // downBand
                name: symbol + ',downBand' + atrPeriod,
                data: []
            }, {
                type: 'flags',
                onSeries: symbol + "-" + index,
                data: [],
            }
        ]
    }
    return chart
}

// main logic
function process(e, kIndex, c) {    // e is the exchange object, such as exchanges[0] ... ; kIndex is the data series of K-line data in the chart; c is the chart object
    // obtain K-line data
    var r = e.GetRecords(e.param.period)
    if (!r || r.length < e.param.atrPeriod + 2 || r.length < e.param.emaPeriod + 2) {
        // if K-line data length is insufficient, return
        return
    }

    // calculate ATR indicator
    var atr = TA.ATR(r, e.param.atrPeriod)
    var arrAvgPrice = []
    _.each(r, function(bar) {
        arrAvgPrice.push((bar.High + bar.Low + bar.Close) / 3)
    })
    // calculate EMA indicator
    var midLine = TA.EMA(arrAvgPrice, e.param.emaPeriod)
    // calculate upBand and downBand
    var upBand = []
    var downBand = []
    _.each(midLine, function(mid, index) {
        if (index < e.param.emaPeriod - 1 || index < e.param.atrPeriod - 1) {
            upBand.push(NaN)
            downBand.push(NaN)
            return
        }
        upBand.push(mid + e.param.trackRatio * atr[index])
        downBand.push(mid - e.param.trackRatio * atr[index])
    })

    // plot
    for (var i = 0 ; i < r.length ; i++) {
        if (r[i].Time == e.state.lastBarTime) {
            // update
            c.add(kIndex, [r[i].Time, r[i].Open, r[i].High, r[i].Low, r[i].Close], -1)
            c.add(kIndex + 1, [r[i].Time, midLine[i]], -1)
            c.add(kIndex + 2, [r[i].Time, upBand[i]], -1)
            c.add(kIndex + 3, [r[i].Time, downBand[i]], -1)
        } else if (r[i].Time > e.state.lastBarTime) {
            // add
            e.state.lastBarTime = r[i].Time
            c.add(kIndex, [r[i].Time, r[i].Open, r[i].High, r[i].Low, r[i].Close])
            c.add(kIndex + 1, [r[i].Time, midLine[i]])
            c.add(kIndex + 2, [r[i].Time, upBand[i]])
            c.add(kIndex + 3, [r[i].Time, downBand[i]])
        }
    }

    // detect position
    var pos = e.GetPosition()
    if (!pos) {
        return
    }
    var holdAmount = 0
    var holdPrice = 0
    if (pos.length > 1) {
        throw "Long and short positions are detected simultaneously!"
    } else if (pos.length != 0) {
        holdAmount = pos[0].Type == PD_LONG ? pos[0].Amount : -pos[0].Amount
        holdPrice = pos[0].Price
    }

    if (e.state.preBar == -1) {
        e.state.preBar = r[r.length - 1].Time
    }
    // detect signal
    if (e.state.preBar != r[r.length - 1].Time) {   // close price model
        if (holdAmount <= 0 && r[r.length - 3].Close < upBand[upBand.length - 3] && r[r.length - 2].Close > upBand[upBand.length - 2]) {   // close price up cross the upBand
            if (holdAmount < 0) {   // holding short, close position
                Log(e.GetCurrency(), "close short position", "#FF0000")
                $.CoverShort(e, e.param.symbol, Math.abs(holdAmount))
                c.add(kIndex + 4, {x: r[r.length - 2].Time, color: 'red', shape: 'flag', title: 'close', text: "close short position"})
            }
            // open long
            Log(e.GetCurrency(), "open long position", "#FF0000")
            $.OpenLong(e, e.param.symbol, 10)
            c.add(kIndex + 4, {x: r[r.length - 2].Time, color: 'red', shape: 'flag', title: 'long', text: "open long position"})
        } else if (holdAmount >= 0 && r[r.length - 3].Close > downBand[downBand.length - 3] && r[r.length - 2].Close < downBand[downBand.length - 2]) {  // close price down cross the downBand
            if (holdAmount > 0) {   // holding long, close position
                Log(e.GetCurrency(), "close long position", "#FF0000")
                $.CoverLong(e, e.param.symbol, Math.abs(holdAmount))
                c.add(kIndex + 4, {x: r[r.length - 2].Time, color: 'green', shape: 'flag', title: 'close', text: "close long position"})
            }
            // open short
            Log(e.GetCurrency(), "open short position", "#FF0000")
            $.OpenShort(e, e.param.symbol, 10)
            c.add(kIndex + 4, {x: r[r.length - 2].Time, color: 'green', shape: 'flag', title: 'short', text: "open short position"})
        } else {
            // close position
            if (holdAmount > 0 && (r[r.length - 2].Close <= holdPrice * (1 - e.param.stopLoss) || r[r.length - 2].Close <= midLine[midLine.length - 2])) {   // if holding long position, close price is equal to or less than midline, stop loss according to open position price
                Log(e.GetCurrency(), "if midline is triggered or stop loss, close long position", "#FF0000")
                $.CoverLong(e, e.param.symbol, Math.abs(holdAmount))
                c.add(kIndex + 4, {x: r[r.length - 2].Time, color: 'green', shape: 'flag', title: 'close', text: "close long position"})
            } else if (holdAmount < 0 && (r[r.length - 2].Close >= holdPrice * (1 + e.param.stopLoss) || r[r.length - 2].Close >= midLine[midLine.length - 2])) {  // if holding short position, close price is equal to or more than midline, stop loss according to open position price
                Log(e.GetCurrency(), "if midline is triggered or stop loss, close short position", "#FF0000")
                $.CoverShort(e, e.param.symbol, Math.abs(holdAmount))
                c.add(kIndex + 4, {x: r[r.length - 2].Time, color: 'red', shape: 'flag', title: 'close', text: "close short position"})
            }
        }
        e.state.preBar = r[r.length - 1].Time
    }
}

function main() {
    var arrChartConfig = []
    if (arrParam.length != exchanges.length) {
        throw "The parameter and the exchange object do not match!"
    }
    var arrState = _G("arrState")
    _.each(exchanges, function(e, index) {
        if (e.GetName() != "Futures_Binance") {
            throw "The platform is not supported!"
        }
        e.param = arrParam[index]
        e.state = {lastBarTime: 0, symbol: e.param.symbol, currency: e.GetCurrency()}
        if (arrState) {
            if (arrState[index].symbol == e.param.symbol && arrState[index].currency == e.GetCurrency()) {
                Log("Recover:", e.state)
                e.state = arrState[index]
            } else {
                throw "The recovered data and the current setting do not match!"
            }
        }
        e.state.preBar = -1   // initially set -1
        e.SetContractType(e.param.symbol)
        Log(e.GetName(), e.GetLabel(), "Set contract:", e.param.symbol)
        arrChartConfig.push(createChartConfig(e.GetCurrency(), e.param.atrPeriod, e.param.emaPeriod, index))
    })
    var chart = Chart(arrChartConfig)
    chart.reset()

    while (true) {
        _.each(exchanges, function(e, index) {
            process(e, index + index * 4, chart)
            Sleep(500)
        })
    }
}

function onexit() {
    // record e.state
    var arrState = []
    _.each(exchanges, function(e) {
        arrState.push(e.state)
    })
    Log("Record:", arrState)
    _G("arrState", arrState)
}
전략 매개 변수
var params = '[{
        "symbol" : "swap",    // contract code
        "period" : 86400,     // K-line period; 86400 seconds indicates 1 day
        "stopLoss" : 0.07,    // ratio of stoploss; 0.07 means 7%
        "atrPeriod" : 10,     // ATR indicator parameter
        "emaPeriod" : 10,     // EMA indicator parameter
        "trackRatio" : 1,     // ratio of upBand or downBand
        "openRatio" : 0.1     // ratio of reserved open position (temporarily not supported)
    }, {
        "symbol" : "swap",
        "period" : 86400,
        "stopLoss" : 0.07,
        "atrPeriod" : 10,
        "emaPeriod" : 10,
        "trackRatio" : 1,
        "openRatio" : 0.1
    }]'
백테스트
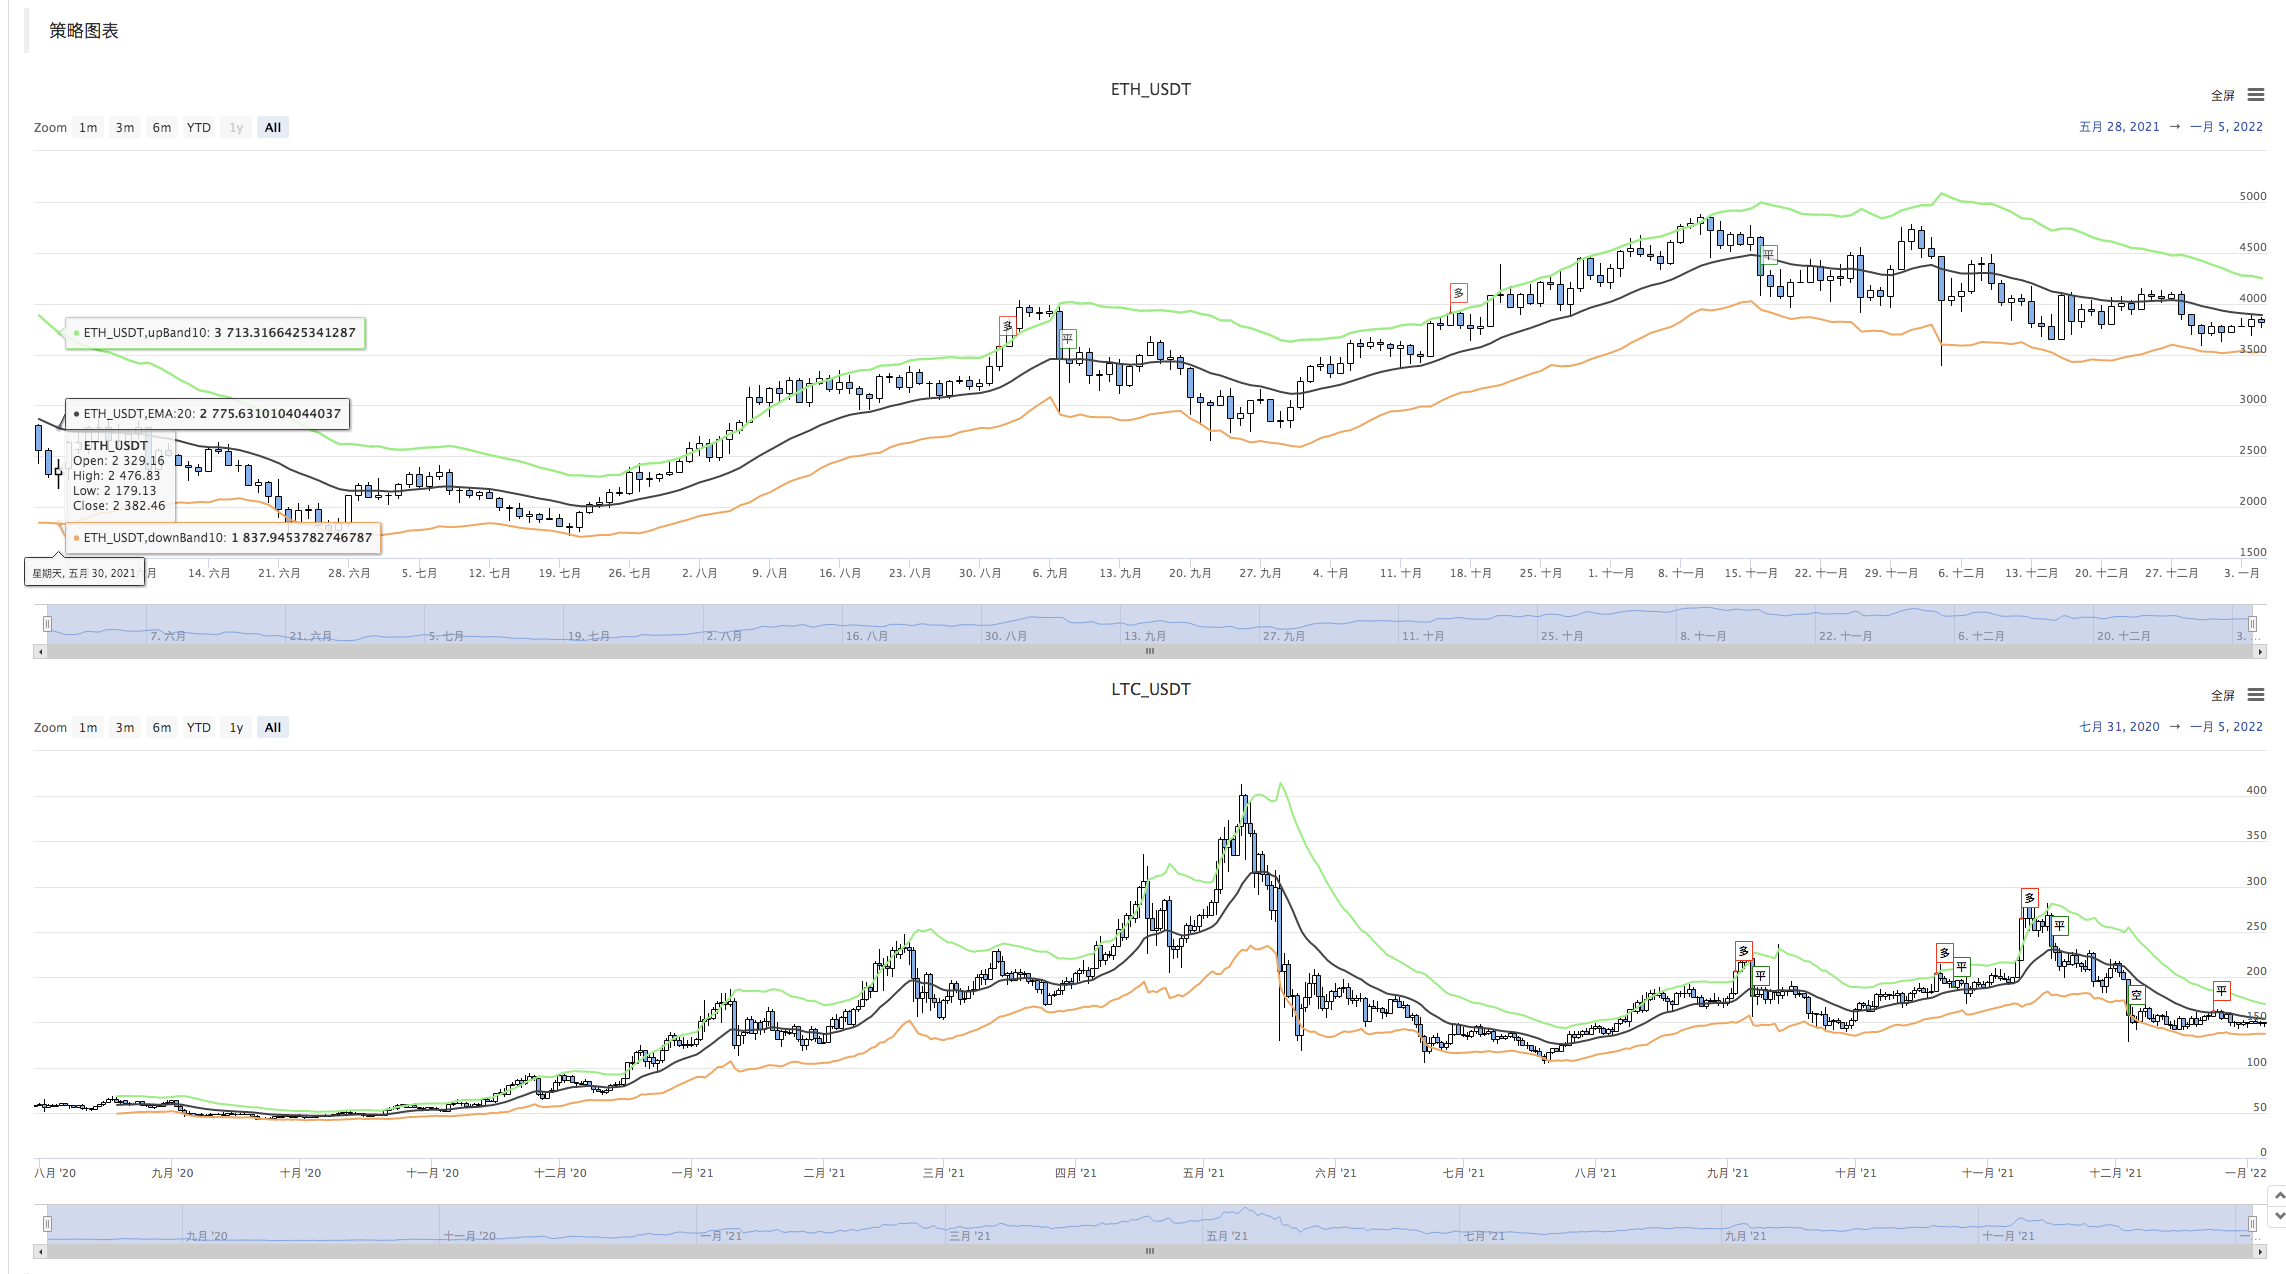
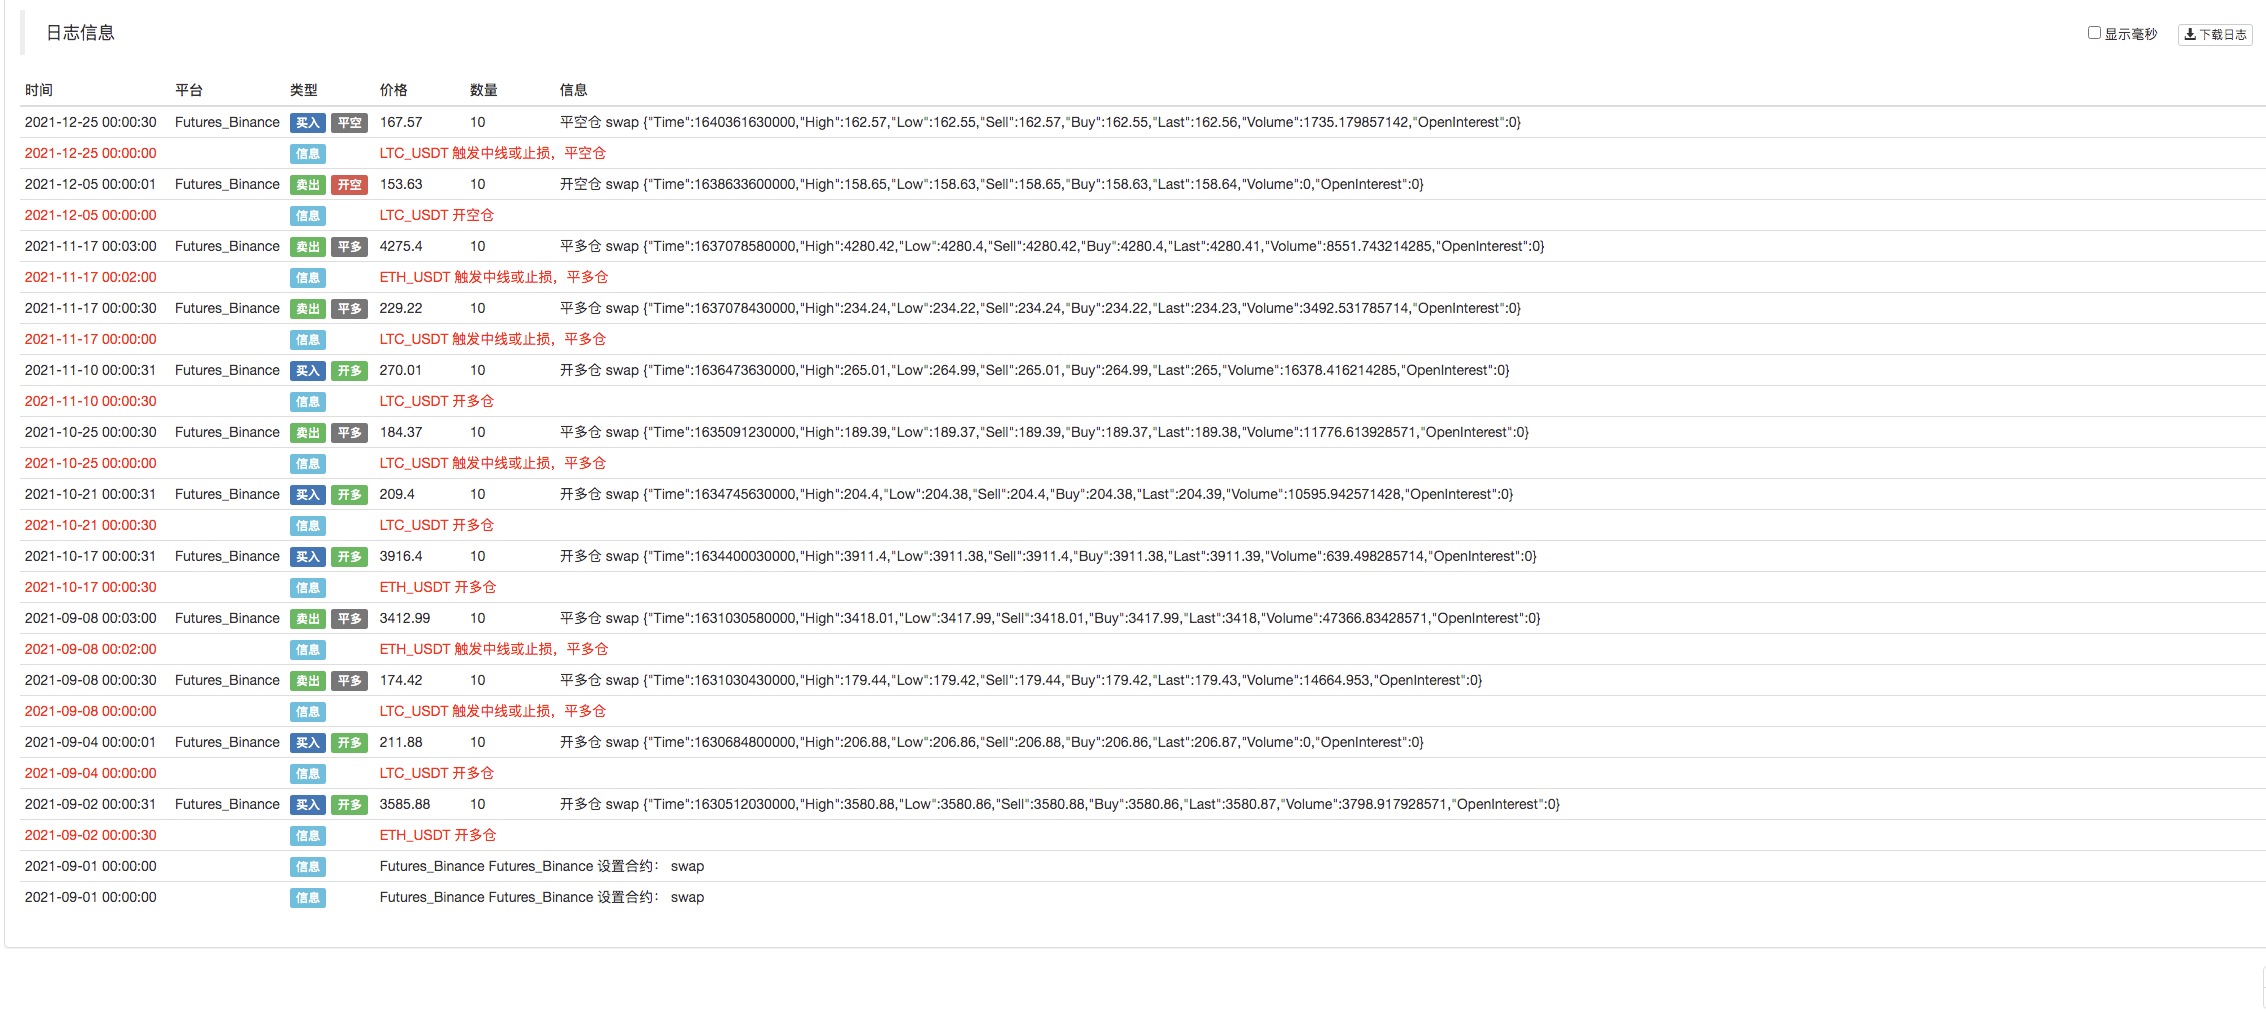
전략 소스 코드:https://www.fmz.com/strategy/339344
전략은 의사소통과 공부를 위해만 사용되는데, 실용적인 용도로는 스스로 수정하고 조정하고 최적화해야 합니다.
- 면적 문제
- dYdX 전략 설계 예제
- FMZ에 파이썬 크롤러를 적용하기 위한 초기 탐구
크롤링 바이낸스 발표 내용 - 헤지 전략 설계 연구 및 대기 중인 스팟 및 선물 주문의 예
- 최근 상황 및 자금율 전략의 권장 운영
- 암호화폐 선물의 이중 이동 평균 절정점 전략 (Teaching)
- 암호화폐 스팟 멀티 심볼 듀얼 이동 평균 전략 (Teaching)
- 자바스크립트에서 피셔 지표를 구현하고 FMZ에서 플롯링
- 관리자
- 2021 암호화폐 TAQ 검토 & 10배 증가의 가장 간단한 놓친 전략
- 업그레이드! 암호화폐 선물 마틴게일 전략
- Getrecords 함수는 세컨드 단위로 K 문자열을 얻을 수 없습니다
- FMZ에 기반한 순서 동기 관리 시스템 설계 (2)
- Getticker가 반환한 볼륨 데이터는 틀렸습니다.
- FMZ에 기반한 순서 동기 관리 시스템 설계 (1)
- 다중 차트 그래프 라이브러리 설계
- 모형 디스크 환경
- 60줄의 코드 하나의 생각을 실현 - 계약 바닥 낚시
- FMZ 청구 시스템 업그레이드 및 조정 발표
- FMZ에서 유령 글쓰기 전략에 대한 통지