자바스크립트에서 피셔 지표를 구현하고 FMZ에서 플롯링
저자:니나바다스, 창작: 2022-04-07 16:04:22, 업데이트:자바스크립트에서 피셔 지표를 구현하고 FMZ에서 플롯링
거래의 기술적 분석 과정에서 거래자는 모두 주식 가격 데이터를 분석하고 연구하기 위해 일반적으로 분산된 데이터로 사용합니다. 그러나 주식 가격 데이터 분포는 표준 정상 분포에 맞지 않습니다.Fisher Transformation이것은 가격 데이터를 정상적인 분포와 비슷한 것으로 변환할 수 있는 방법입니다.Fisher Transformation시장 데이터를 부드럽게하고 일부 날카로운 작은 주기적인 진동을 제거합니다. 거래 신호는 오늘과 전날의 지표의 교류를 사용하여 전송 될 수 있습니다.
많은 언급이 있습니다.Fisher Transformation바이두와 지후에 대해 설명하지 않겠습니다.
표시 알고리즘:
-
오늘날의 중간 가격:
mid=(low + high) / 2 -
계산 기간을 확인; 당신은 10 일 한 기간을 사용할 수 있습니다. 기간 중 가장 높은 가격과 가장 낮은 가격을 계산:
lowestLow = the lowest price in the period,highestHigh = the highest price in the period. -
가격 변화 매개 변수를 정의합니다.
ratio0에서 1까지의 상수입니다. 예를 들어 0.5 또는 0.33를 선택할 수 있습니다.)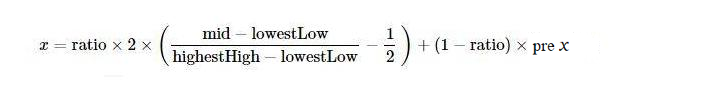
-
적용
Fisher가격 변화 매개 변수로 변환x, 그리고Fisher지표는 다음과 같이 얻을 수 있습니다.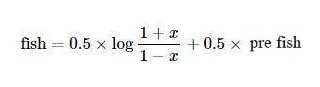
알고리즘을 실현하기 위해 자바스크립트를 사용
지표 알고리즘에 따라 단계적으로 실현. 이 알고리즘은 반복 알고리즘이며,preX, preFish, 그들은 처음에 0으로 설정됩니다.Math.log자연 상수 e를 기반으로 하는 로그리듬입니다. 또한 위의 알고리즘에서는 x의 변형이 언급되지 않습니다.
x의 값을 수정합니다. 값이 0.99보다 크면 0.999로 강제로 설정합니다. 값이 -0.99보다 작다면 -0.999로 설정합니다.
        if (x > 0.99) {
            x = 0.999
        } else if (x < -0.99) {
            x = -0.999
        }
이것은 알고리즘과 지표를 처음 보는 것입니다. 알고리즘에 따라 포팅 한 후. 구현을 확인하지 않았습니다. 연구에 관심이있는 학생들은 오류가 있는지 확인할 수 있습니다. 오류가있는 경우 지적 주셔서 감사합니다.
소스 코드Fisher Transform지표 알고리즘:
function getHighest(arr, period) {
    if (arr.length == 0 || arr.length - period < 0) {
        return null
    }
    var beginIndex = arr.length - period
    var ret = arr[beginIndex].High
    for (var i = 0 ; i < arr.length - 1 ; i++) {
        if (arr[i + 1].High > ret) {
            ret = arr[i + 1].High
        }
    }
    return ret
}

function getLowest(arr, period) {
    if (arr.length == 0 || arr.length - period < 0) {
        return null
    }
    var beginIndex = arr.length - period
    var ret = arr[beginIndex].Low
    for (var i = 0 ; i < arr.length - 1 ; i++) {
        if (arr[i + 1].Low < ret) {
            ret = arr[i + 1].Low
        }
    }
    return ret
}

function calcFisher(records, ratio, period) {
    var preFish = 0
    var preX = 0
    var arrFish = []
    // when the K-line length is not long enough to meet the K-line period
    if (records.length < period) {
        for (var i = 0 ; i < records.length ; i++) {
            arrFish.push(0)
        }
        return arrFish
    }

    // traverse K-lines
    for (var i = 0 ; i < records.length ; i++) {
        var fish = 0
        var x = 0
        var bar = records[i]
        var mid = (bar.High + bar.Low) / 2
        // when the current BAR is not enough for period to calculate
        if (i < period - 1) {
            fish = 0
            preFish = 0
            arrFish.push(fish)
            continue
        }

        // calculate the highest price and the lowest price in the period
        var bars = []
        for (var j = 0 ; j <= i ; j++) {
            bars.push(records[j])
        }
        var lowestLow = getLowest(bars, period)
        var highestHigh = getHighest(bars, period)

        // price change parameter x
        x = ratio * 2 * ((mid - lowestLow) / (highestHigh - lowestLow) - 0.5) + (1 - ratio) * preX
        if (x > 0.99) {
            x = 0.999
        } else if (x < -0.99) {
            x = -0.999
        }
        preX = x
        fish = 0.5 * Math.log((1 + x) / (1 - x)) + 0.5 * preFish
        preFish = fish
        arrFish.push(fish)
    }
    return arrFish
}
플롯
FMZ에서 그래프를 그리는 것은 매우 쉽습니다. 전략 사각형에서 많은 예를 참조할 수 있습니다.https://www.fmz.com/square, 그리고 필요한 전략을 검색할 수도 있습니다.
var cfg = {    // used to initially configure the chart objects (namely chart settings)
    plotOptions: {
        candlestick: {
            color: '#d75442',  // color value
            upColor: '#6ba583' // color vlaue
        }
    },
    title: { text: 'Fisher Transform'},     //title
    subtitle: {text: ''},     //subtitle
    plotOptions: {
        candlestick: {
        tooltip: {
            pointFormat:
            '<span style="color:{point.color}">\u25CF</span> <b> {series.name}</b><br/>' +
            'open: {point.open}<br/>' +
            'highest: {point.high}<br/>' +
            'lowest: {point.low}<br/>' +
            'close: {point.close}<br/>'
            }
        }
    },
    yAxis: [{
        title: {
            text: 'K-line market quote'
        },
        height: '70%',
        lineWidth: 1
    }, {
        title: {
            text: 'Fisher Transform'
        },
        top: '75%',
        height: '30%',
        offset: 0,
        lineWidth: 1
    }],
    series: [//series
        {
            type: 'candlestick',
            yAxis: 0,
            name: 'K-line',
            id: 'KLine',
            // control the candlestick color of fall
            color: 'green',
            lineColor: 'green',
            // control the candlestick color of rise
            upColor: 'red',
            upLineColor: 'red',
            data: []
        },{
            type: 'line',         // set the type of the current data series as: line
            yAxis: 1,             // the y axis for use is the y axis with index 0 (in highcharts, there can be multiple y axis, and here it indicates the y axis with index 0)
            showInLegend: true,   //
            name: 'fish',          // set according the parameter label  passed by the function
            lineWidth: 1,
            data: [],             // data item of the data series
            tooltip: {            // tip for tool
                valueDecimals: 2  //  the decimals of the value reserve 5
            }
        },{
            type: 'line',         // set the type of the current data series as: line
            yAxis: 1,             // the y axis for use is the y axis with index 0 (in highcharts, there can be multiple y axis, and here it indicates the y axis with index 0)
            showInLegend: true,   //
            name: 'preFish',      // set according the parameter label  passed by the function
            lineWidth: 1,
            data: [],             // data item of the data series
            tooltip: {            // tip for tool
                valueDecimals: 2  // the decimals of the value reserve 5
            }
        }
    ]
}

var chart = Chart(cfg)
function main() {
    var ts = 0
    chart.reset()
    while (true) {
        var r = exchange.GetRecords()
        var fisher = calcFisher(r, 0.33, 10)
        if (!r || !fisher) {
            Sleep(500)
            continue
        }

        for (var i = 0; i < r.length; i++){
            if (ts == r[i].Time) {
                chart.add([0,[r[i].Time, r[i].Open, r[i].High, r[i].Low, r[i].Close], -1])
                chart.add([1,[r[i].Time, fisher[i]], -1])
                if (i - 1 >= 0) {
                    chart.add([2,[r[i].Time, fisher[i - 1]], -1])
                }
            }else if (ts < r[i].Time) {
                chart.add([0,[r[i].Time, r[i].Open, r[i].High, r[i].Low, r[i].Close]])
                chart.add([1,[r[i].Time, fisher[i]]])
                if (i - 1 >= 0) {
                    chart.add([2,[r[i].Time, fisher[i - 1]]])
                }
                ts = r[i].Time
            }
        }
    }
}
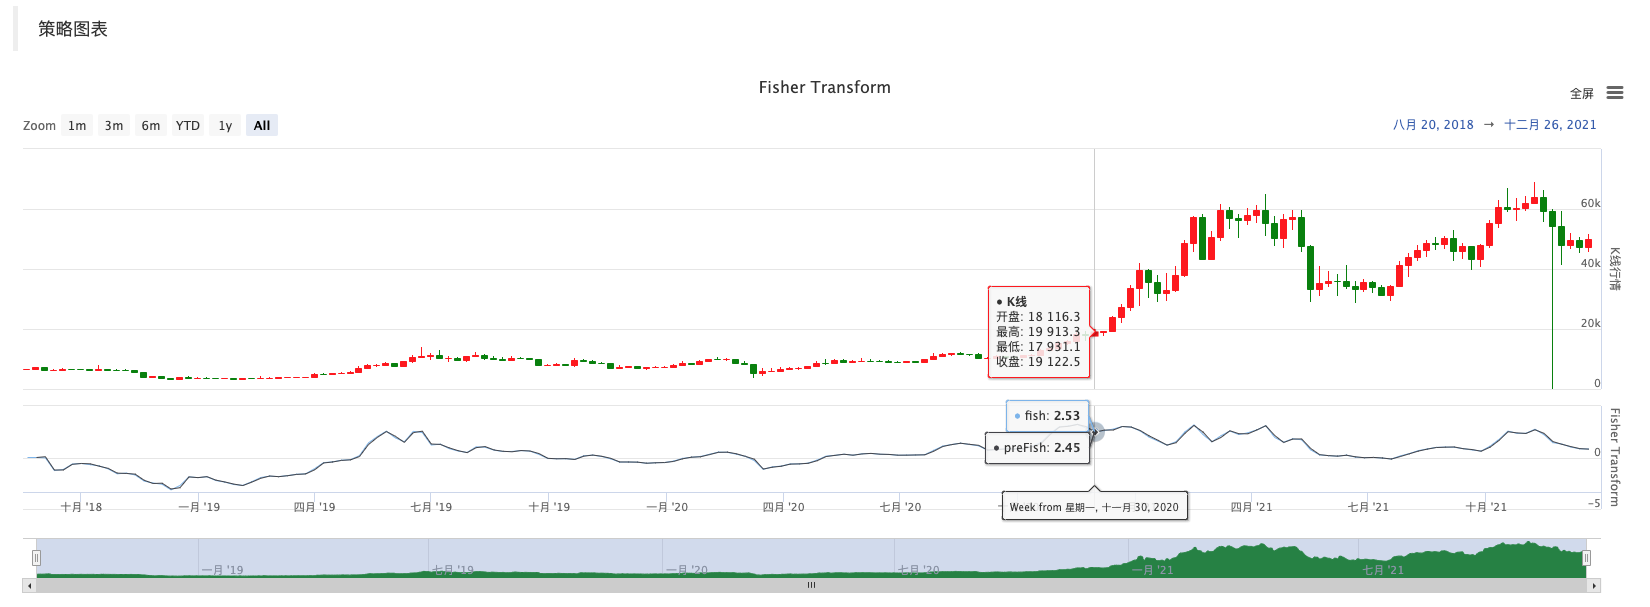
따라서 FMZ에서 데이터, 차트 표시 및 전략 디자인을 연구하는 것이 매우 편리합니다. 여기서 더 많은 아이디어에 대한 토론을 시작하겠습니다. 그래서 선생님들과 학생들이 댓글을 남길 것을 환영합니다.
- 암호화폐 계약 단순 명령어 감독 로봇
- getdepth를 사용해서 해당 시간대를 얻으려면
- 방치, 해결
- 면적 문제
- dYdX 전략 설계 예제
- FMZ에 파이썬 크롤러를 적용하기 위한 초기 탐구
크롤링 바이낸스 발표 내용 - 헤지 전략 설계 연구 및 대기 중인 스팟 및 선물 주문의 예
- 최근 상황 및 자금율 전략의 권장 운영
- 암호화폐 선물의 이중 이동 평균 절정점 전략 (Teaching)
- 암호화폐 스팟 멀티 심볼 듀얼 이동 평균 전략 (Teaching)
- 관리자
- 2021 암호화폐 TAQ 검토 & 10배 증가의 가장 간단한 놓친 전략
- 암호화폐 선물 다중 기호 ART 전략 (교양)
- 업그레이드! 암호화폐 선물 마틴게일 전략
- Getrecords 함수는 세컨드 단위로 K 문자열을 얻을 수 없습니다
- FMZ에 기반한 순서 동기 관리 시스템 설계 (2)
- Getticker가 반환한 볼륨 데이터는 틀렸습니다.
- FMZ에 기반한 순서 동기 관리 시스템 설계 (1)
- 다중 차트 그래프 라이브러리 설계
- 모형 디스크 환경