파이썬에서 이중 추진 디지털 통화 양적 거래 전략을 구현합니다.
저자:리디아, 창작: 2023-01-10 17:07:49, 업데이트: 2023-09-20 10:53:48
파이썬에서 이중 추진 디지털 통화 양적 거래 전략을 구현합니다.
이중 추진력 거래 알고리즘에 대한 소개
이중 추진력 거래 알고리즘 (Dual Thrust trading algorithm) 은 마이클
이 문서에서는 이 전략의 상세한 논리적인 세부 사항을 제공하고 FMZ Quant 플랫폼에서 이 알고리즘을 구현하는 방법을 보여준다. 우선, 거래하고자 하는 주체의 역사적 가격을 선택해야 한다. 이 범위는 마지막 N 일 동안의 종료 가격, 최고 가격 및 최저 가격에 기초하여 계산된다. 시장이 개시 가격에서 특정 범위로 이동하면 포지션을 열어야 한다.
우리는 트렌드 시장과 쇼크 시장이라는 두 가지 일반적인 시장 조건 하에서 단일 거래 쌍으로 이 전략을 테스트했습니다. 그 결과는 동력 거래 시스템이 트렌드 시장에서 더 잘 작동하고 변동성 시장에서 일부 유효하지 않은 거래 신호를 유발한다는 것을 보여주었습니다. 간격 시장에서 우리는 더 나은 수익을 얻기 위해 매개 변수를 조정할 수 있습니다. 개별 참조 거래 목표의 비교로 국내 재화 선물 시장도 테스트했습니다. 그 결과는 전략이 평균 성과보다 낫다는 것을 보여주었습니다.
DT 전략 원칙
그것의 논리적 프로토타입은 일반적인 내일 거래 전략이다. 오픈 레인지 브레이크로브 전략은 상위 및 하위 트랙을 결정하기 위해 오늘의 오픈 가격 더 또는 어제의 범위의 일정 비율을 빼기 위해 기반을 둔다. 가격이 상위 트랙을 넘을 때, 그것은 구매를 위해 위치를 열고, 하위 트랙을 깨면, 그것은 짧은 지위를 열 것입니다.
전략 원칙
-
클로즈먼트 후 두 개의 값이 계산됩니다. 가장 높은 가격인 클로즈먼트 가격과 가장 낮은 가격인 클로즈먼트 가격. 두 값 중 더 큰 값을 가지고 값을 0.7로 곱합니다.
-
다음 날 시장이 열리면 개장 가격을 기록하고, 가격이 초과되면 즉시 구매합니다 (개시 가격 + 트리거 값) 또는 가격이 낮을 때 짧은 포지션을 판매합니다 (개시 가격 - 트리거 값).
-
이 전략은 명백한 스톱 로스를 가지고 있지 않습니다. 이 시스템은 역 시스템입니다. 즉, 가격이 초과 (개시 가격 + 트리거 값) 할 때 짧은 포지션 주문이 있으면 두 개의 구매 주문을 보낼 것입니다. (한 명은 잘못된 포지션을 닫고 다른 하나는 올바른 포지션을 열습니다.) 같은 이유로, 긴 포지션의 가격이 (개시 가격 - 트리거 값) 보다 낮으면 두 개의 판매 주문을 보낼 것입니다.
DT 전략의 수학적 표현
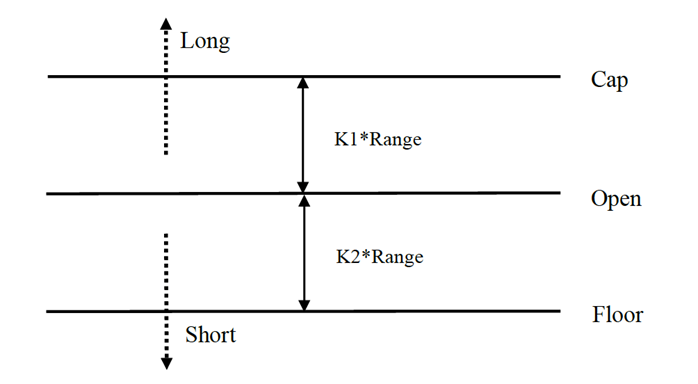
범위 = 최대 (HH-LC, HC-LL)
긴 위치 신호를 계산하는 방법은 다음과 같습니다.
캡 = 오픈 + K1 × 레인지캡 = 오픈 + K1 × 레인지
짧은 위치 신호를 계산하는 방법은 다음과 같습니다.
바닥 = 개방형
K1과 K2가 매개 변수일 때. K1이 K2보다 크면 긴 포지션 신호가 트리거되고 그 반대입니다. 시연을 위해 K1=K2=0.5를 선택합니다. 실제 거래에서 우리는 여전히 역사적 데이터를 사용하여 이러한 매개 변수를 최적화하거나 시장 추세에 따라 매개 변수를 조정할 수 있습니다. 상승세를 보이는 경우 K1은 K2보다 작아야합니다. 하락세를 보이는 경우 K1은 K2보다 크어야합니다.
이 시스템은 반전 시스템입니다. 따라서, 투자자가 가격이 상위 트랙을 넘을 때 짧은 포지션을 보유하면 긴 포지션을 열기 전에 짧은 포지션을 닫아야 합니다. 가격이 바닥 트랙을 넘을 때 투자자가 긴 포지션을 보유하면 새로운 짧은 포지션을 열기 전에 긴 포지션을 닫아야 합니다.
DT 전략의 개선:
범위 설정에서, 지난 N 일 동안의 네 가지 가격 포인트 (고위, 오픈, 저하 및 폐쇄) 는 일정 기간 동안 범위가 상대적으로 안정적으로 유지되도록 도입되며, 이는 일일 트렌드 추적에 적용 될 수 있습니다.
전략의 긴 포지션과 짧은 포지션 개설의 트리거 조건은 비대칭 범위를 고려하여 긴 포지션과 짧은 포지션의 레퍼런스 범위를 선택하여 다른 기간을 선택해야하며, 이는 또한 매개 변수 K1과 K2에 의해 결정 될 수 있습니다. K1 < K2일 때 긴 포지션 신호는 상대적으로 쉽게 트리거 될 수 있으며, K1 > K2일 때 짧은 포지션 신호는 상대적으로 쉽게 트리거 될 수 있습니다.
따라서, 이 전략을 사용 하 여, 한편으로는, 당신은 역사 데이터 역 테스트의 최고의 매개 변수를 참조 할 수 있습니다. 다른 한편으로, 당신은 미래에 대한 판단에 따라 단계적으로 K1과 K2를 조정 할 수 있습니다. 또는 다른 주요 기간 기술 지표.
이것은 신호를 기다리고 시장에 들어가고, 중재하고, 시장에서 빠져나가는 전형적인 거래 방법이지만 효과는 훌륭합니다.
FMZ 퀀트 플랫폼에 DT 전략을 배포
우리는 열립니다.FMZ.COM, 계정에 로그인하여 대시보드를 클릭하고 도커와 로봇을 배포합니다.
도커와 로봇을 어떻게 배포해야 하는지에 대한 제 이전 기사를 참조하시기 바랍니다:https://www.fmz.com/bbs-topic/9864.
독자들이 자신의 클라우드 컴퓨팅 서버를 구입하여 도커를 배포하고 싶다면 이 기사를 참조할 수 있습니다.https://www.fmz.com/digest-topic/5711.
다음으로 왼쪽 컬럼의 전략 라이브러리를 클릭하고 전략을 추가하는 것을 클릭합니다.
전략 편집 페이지의 오른쪽 상단 모서리에서 파이썬과 같은 프로그래밍 언어를 선택하십시오. 그림과 같이:
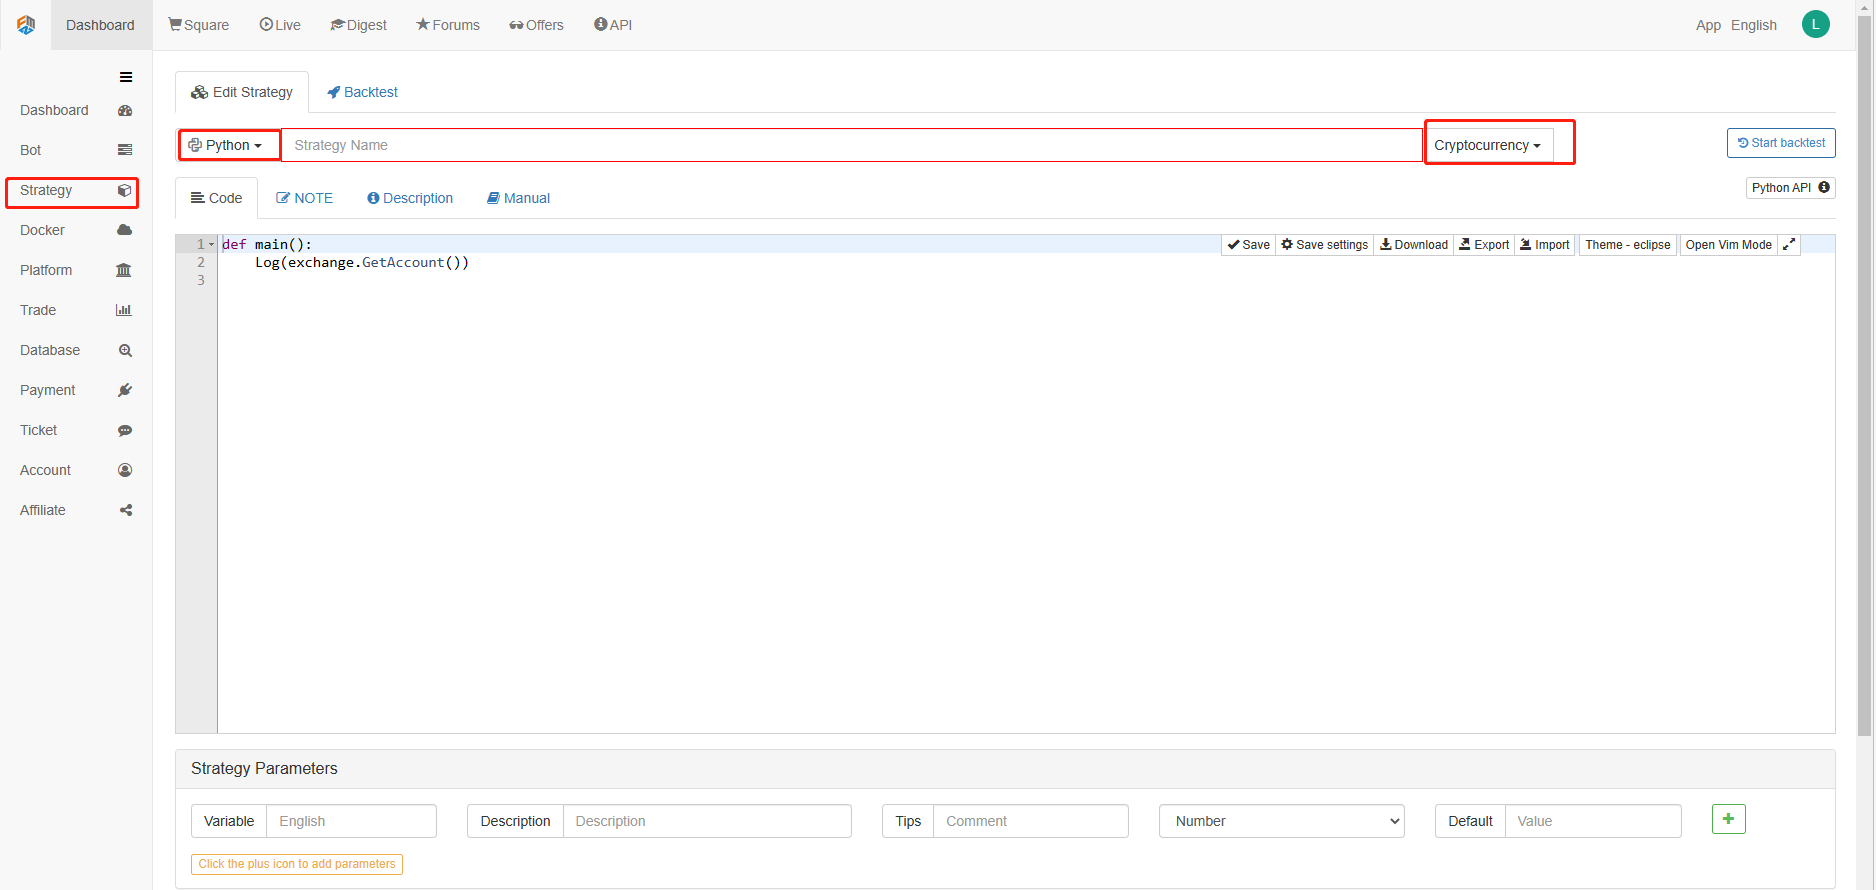
다음으로, 우리는 코드 편집 페이지에 파이썬 코드를 쓸 것입니다. 다음 코드는 매우 상세한 라인-비-라인 코멘트를 가지고 있습니다.
우리는 OKCoin 선물로 전략을 테스트할 것입니다.
import time # Here we need to introduce the time library that comes with python, which will be used later in the program.

class Error_noSupport(BaseException): # We define a global class named ChartCfg to initialize the strategy chart settings. Object has many attributes about the chart function. Chart library: HighCharts.
    def __init__(self): # log out prompt messages
        Log("Support OKCoin Futures only! #FF0000")

class Error_AtBeginHasPosition(BaseException):
    def __init__(self):
        Log("Start with a futures position! #FF0000")

ChartCfg = {
    '__isStock': True, # This attribute is used to control whether to display a single control data series (you can cancel the display of a single data series on the chart). If you specify __isStock: false, it will be displayed as a normal chart.
    'title': { # title is the main title of the chart
        'text': 'Dual Thrust upper and bottom track chart' # An attribute of the title text is the text of the title, here set to 'Dual Thrust upper and bottom track chart' the text will be displayed in the title position.
    },
    'yAxis': { # Settings related to the Y-axis of the chart coordinate.
        'plotLines': [{ # Horizontal lines on the Y-axis (perpendicular to the Y-axis), the value of this attribute is an array, i.e. the setting of multiple horizontal lines.
            'value': 0, # Coordinate value of horizontal line on Y-axis
            'color': 'red', # Color of horizontal line
            'width': 2, # Line width of horizontal line
            'label': {  # Labels on the horizontal line
                'text': 'Upper track', # Text of the label
                'align': 'center' # The display position of the label, here set to center (i.e.: 'center')
            },
        }, {       # The second horizontal line ([{...} , {...}] the second element in the array)
            'value': 0, # Coordinate value of horizontal line on Y-axis
            'color': 'green', # Color of horizontal line
            'width': 2,  # Line width of horizontal line
            'label': { # Label
                'text': 'bottom track',
                'align': 'center'
            },
        }]
    },
    'series': [{ # Data series, that is, data used to display data lines, K-lines, tags, and other contents on the chart. It is also an array whose first index is 0.
        'type': 'candlestick', # Type of data series with index 0: 'candlestick' indicates a K-line chart.
        'name': 'Current period',  # Name of the data series
        'id': 'primary', # The ID of the data series, which is used for the related settings of the next data series.
        'data': []  # An array of data series to store specific K-line data
    }, {
        'type': 'flags',  # Data series, type: 'flags', display labels on the chart, indicating going long and going short. Index is 1.
        'onSeries': 'primary',  # This attribute indicates that the label is displayed on id 'primary'.
        'data': []    # The array that holds the label data.
    }]
}

STATE_IDLE = 0  # Status constants, indicating idle
STATE_LONG = 1 # Status constants, indicating long positions
STATE_SHORT = 2 # Status constants, indicating short positions
State = STATE_IDLE # Indicates the current program status, assigned as idle initially

LastBarTime = 0  # The time stamp of the last column of the K-line (in milliseconds, 1000 milliseconds is equal to 1 second, and the timestamp is the number of milliseconds from January 1, 1970 to the present time is a large positive integer).
UpTrack = 0   # Upper track value
BottomTrack = 0 # Bottom track value
chart = None # It is used to accept the chart control object returned by the Chart API function. Use this object (chart) to call its member function to write data to the chart.
InitAccount = None # Initial account status
LastAccount = None # Latest account status
Counter = { # Counters for recording profit and loss counts
    'w': 0, # Number of wins
    'l': 0  # Number of losses
}

def GetPosition(posType):  # Define a function to store account position information
    positions = exchange.GetPosition() # exchange.GetPosition() is the FMZ Quant official API. For its usage, please refer to the official API document: https://www.fmz.com/api.
    return [{'Price': position['Price'], 'Amount': position['Amount']} for position in positions if position['Type'] == posType] # Return to various position information

def CancelPendingOrders(): # Define a function specifically for withdrawing orders
    while True: # Loop check
        orders = exchange.GetOrders() # If there is a position
        [exchange.CancelOrder(order['Id']) for order in orders if not Sleep(500)] # Withdrawal statement
        if len(orders) == 0: # Logical judgment
            break

def Trade(currentState,nextState): # Define a function to determine the order placement logic.
    global InitAccount,LastAccount,OpenPrice,ClosePrice # Define the global scope
    ticker = _C(exchange.GetTicker) # For the usage of _C, please refer to: https://www.fmz.com/api.
    slidePrice = 1 # Define the slippage value
    pfn = exchange.Buy if nextState == STATE_LONG else exchange.Sell # Buying and selling judgment logic
    if currentState != STATE_IDLE: # Loop start
        Log(_C(exchange.GetPosition)) # Log information
        exchange.SetDirection("closebuy" if currentState == STATE_LONG else "closesell") # Adjust the order direction, especially after placing the order.
        while True:
            ID = pfn( (ticker['Last'] - slidePrice) if currentState == STATE_LONG else (ticker['Last'] + slidePrice), AmountOP) # Price limit order, ID=pfn (- 1, AmountOP) is the market price order, ID=pfn (AmountOP) is the market price order.
            Sleep(Interval) # Take a break to prevent the API from being accessed too often and your account being blocked.
            Log(exchange.GetOrder(ID)) # Log information
            ClosePrice = (exchange.GetOrder(ID))['AvgPrice'] # Set the closing price
            CancelPendingOrders() # Call the withdrawal function
            if len(GetPosition(PD_LONG if currentState == STATE_LONG else PD_SHORT)) == 0: # Order withdrawal logic
                break
        account = exchange.GetAccount() # Get account information
        if account['Stocks'] > LastAccount['Stocks']: # If the current account currency value is greater than the previous account currency value.
            Counter['w'] += 1 # In the profit and loss counter, add one to the number of profits.
        else:
            Counter['l'] += 1 # Otherwise, add one to the number of losses.
        Log(account) # log information
        LogProfit((account['Stocks'] - InitAccount['Stocks']),"Return rates:", ((account['Stocks'] - InitAccount['Stocks']) * 100 / InitAccount['Stocks']),'%')
        Cal(OpenPrice,ClosePrice)
        LastAccount = account

    exchange.SetDirection("buy" if nextState == STATE_LONG else "sell") # The logic of this part is the same as above and will not be elaborated.
    Log(_C(exchange.GetAccount))
    while True:
        ID = pfn( (ticker['Last'] + slidePrice) if nextState == STATE_LONG else (ticker['Last'] - slidePrice), AmountOP)
        Sleep(Interval)
        Log(exchange.GetOrder(ID))
        CancelPendingOrders()
        pos = GetPosition(PD_LONG if nextState == STATE_LONG else PD_SHORT)
        if len(pos) != 0:
            Log("Average price of positions",pos[0]['Price'],"Amount:",pos[0]['Amount'])
            OpenPrice = (exchange.GetOrder(ID))['AvgPrice']
            Log("now account:",exchange.GetAccount())
            break

def onTick(exchange): # The main function of the program, within which the main logic of the program is processed.
    global LastBarTime,chart,State,UpTrack,DownTrack,LastAccount # Define the global scope
    records = exchange.GetRecords() # For the usage of exchange.GetRecords(), please refer to: https://www.fmz.com/api.
    if not records or len(records) <= NPeriod: # Judgment statements to prevent accidents.
        return
    Bar = records[-1] # Take the penultimate element of records K-line data, that is, the last bar.
    if LastBarTime != Bar['Time']:
        HH = TA.Highest(records, NPeriod, 'High')  # Declare the HH variable, call the TA.Highest function to calculate the maximum value of the highest price in the current K-line data NPeriod period and assign it to HH.
        HC = TA.Highest(records, NPeriod, 'Close') # Declare the HC variable to get the maximum value of the closing price in the NPeriod period.
        LL = TA.Lowest(records, NPeriod, 'Low') # Declare the LL variable to get the minimum value of the lowest price in the NPeriod period.
        LC = TA.Lowest(records, NPeriod, 'Close') # Declare LC variable to get the minimum value of the closing price in the NPeriod period. For specific TA-related applications, please refer to the official API documentation.

        Range = max(HH - LC, HC - LL)  # Calculate the range
        UpTrack = _N(Bar['Open'] + (Ks * Range))  # The upper track value is calculated based on the upper track factor Ks of the interface parameters such as the opening price of the latest K-line bar.
        DownTrack = _N(Bar['Open'] - (Kx * Range)) # Calculate the down track value
        if LastBarTime > 0: # Because the value of LastBarTime initialization is set to 0, LastBarTime>0 must be false when running here for the first time. The code in the if block will not be executed, but the code in the else block will be executed.
            PreBar = records[-2] # Declare a variable means "the previous Bar" assigns the value of the penultimate Bar of the current K-line to it.
            chart.add(0, [PreBar['Time'], PreBar['Open'], PreBar['High'], PreBar['Low'], PreBar['Close']], -1) # Call the add function of the chart icon control class to update the K-line data (use the penultimate bar of the obtained K-line data to update the last bar of the icon, because a new K-line bar is generated).
        else:  # For the specific usage of the chart.add function, see the API documentation and the articles in the forum. When the program runs for the first time, it must execute the code in the else block. The main function is to add all the K-lines obtained for the first time to the chart at one time.
            for i in range(len(records) - min(len(records), NPeriod * 3), len(records)): # Here, a for loop is executed. The number of loops uses the minimum of the K-line length and 3 times the NPeriod, which can ensure that the initial K-line will not be drawn too much and too long. Indexes vary from large to small.
                b = records[i] # Declare a temporary variable b to retrieve the K-line bar data with the index of records.length - i for each loop.
                chart.add(0,[b['Time'], b['Open'], b['High'], b['Low'], b['Close']]) # Call the chart.add function to add a K-line bar to the chart. Note that if the last parameter of the add function is passed in -1, it will update the last Bar (column) on the chart. If no parameter is passed in, it will add Bar to the last. After executing the loop of i=2 (i-- already, now it's 1), it will trigger i > 1 for false to stop the loop. It can be seen that the code here only processes the bar of records.length - 2, and the last Bar is not processed.
        chart.add(0,[Bar['Time'], Bar['Open'], Bar['High'], Bar['Low'], Bar['Close']]) # Since the two branches of the above if do not process the bar of records.length - 1, it is processed here. Add the latest Bar to the chart.
        ChartCfg['yAxis']['plotLines'][0]['value'] = UpTrack  # Assign the calculated upper track value to the chart object (different from the chart control object chart) for later display.
        ChartCfg['yAxis']['plotLines'][1]['value'] = DownTrack # Assign lower track value
        ChartCfg['subtitle'] = { # Set subtitle
            'text': 'upper tarck' + str(UpTrack) + 'down track' + str(DownTrack) # Subtitle text setting. The upper and down track values are displayed on the subtitle.
        }
        chart.update(ChartCfg) # Update charts with chart class ChartCfg.
        chart.reset(PeriodShow) # Refresh the PeriodShow variable set according to the interface parameters, and only keep the K-line bar of the number of PeriodShow values.

        LastBarTime = Bar['Time'] # The timestamp of the newly generated Bar is updated to LastBarTime to determine whether the last Bar of the K-line data acquired in the next loop is a newly generated one.
    else: # If LastBarTime is equal to Bar.Time, that is, no new K-line Bar is generated. Then execute the code in {..}.
        chart.add(0,[Bar['Time'], Bar['Open'], Bar['High'], Bar['Low'], Bar['Close']], -1) # Update the last K-line bar on the chart with the last Bar of the current K-line data (the last Bar of the K-line, i.e. the Bar of the current period, is constantly changing).
    LogStatus("Price:", Bar["Close"], "up:", UpTrack, "down:", DownTrack, "wins:", Counter['w'], "losses:", Counter['l'], "Date:", time.time()) # The LogStatus function is called to display the data of the current strategy on the status bar.
    msg = "" # Define a variable msg.
    if State == STATE_IDLE or State == STATE_SHORT: # Judge whether the current state variable State is equal to idle or whether State is equal to short position. In the idle state, it can trigger long position, and in the short position state, it can trigger a long position to be closed and sell the opening position.
        if Bar['Close'] >= UpTrack: # If the closing price of the current K-line is greater than the upper track value, execute the code in the if block.
            msg = "Go long, trigger price:" + str(Bar['Close']) + "upper track" + str(UpTrack) # Assign a value to msg and combine the values to be displayed into a string.
            Log(msg) # message
            Trade(State, STATE_LONG) # Call the Trade function above to trade.
            State = STATE_LONG # Regardless of opening long positions or selling the opening position, the program status should be updated to hold long positions at the moment.
            chart.add(1,{'x': Bar['Time'], 'color': 'red', 'shape': 'flag', 'title': 'long', 'text': msg}) # Add a marker to the corresponding position of the K-line to show the open long position.

    if State == STATE_IDLE or State == STATE_LONG: # The short direction is the same as the above, and will not be repeated. The code is exactly the same.
        if Bar['Close'] <= DownTrack:
            msg = "Go short, trigger price:" + str(Bar['Close']) + "down track" + str(DownTrack)
            Log(msg)
            Trade(State, STATE_SHORT)
            State = STATE_SHORT
            chart.add(1,{'x': Bar['Time'], 'color': 'green', 'shape': 'circlepin', 'title': 'short', 'text': msg})

OpenPrice = 0 # Initialize OpenPrice and ClosePrice
ClosePrice = 0
def Cal(OpenPrice, ClosePrice): # Define a Cal function to calculate the profit and loss of the strategy after it has been run.
    global AmountOP,State
    if State == STATE_SHORT:
        Log(AmountOP,OpenPrice,ClosePrice,"Profit and loss of the strategy:", (AmountOP * 100) / ClosePrice - (AmountOP * 100) / OpenPrice, "Currencies, service charge:", - (100 * AmountOP * 0.0003), "USD, equivalent to:", _N( - 100 * AmountOP * 0.0003/OpenPrice,8), "Currencies")
        Log(((AmountOP * 100) / ClosePrice - (AmountOP * 100) / OpenPrice) + (- 100 * AmountOP * 0.0003/OpenPrice))
    if State == STATE_LONG:
        Log(AmountOP,OpenPrice,ClosePrice,"Profit and loss of the strategy:", (AmountOP * 100) / OpenPrice - (AmountOP * 100) / ClosePrice, "Currencies, service charge:", - (100 * AmountOP * 0.0003), "USD, equivalent to:", _N( - 100 * AmountOP * 0.0003/OpenPrice,8), "Currencies")
        Log(((AmountOP * 100) / OpenPrice - (AmountOP * 100) / ClosePrice) + (- 100 * AmountOP * 0.0003/OpenPrice))

def main(): # The main function of the strategy program. (entry function)
    global LoopInterval,chart,LastAccount,InitAccount # Define the global scope
    if exchange.GetName() != 'Futures_OKCoin':  # Judge if the name of the added exchange object (obtained by the exchange.GetName function) is not equal to 'Futures_OKCoin', that is, the object added is not OKCoin futures exchange object.
        raise Error_noSupport # Throw an exception
    exchange.SetRate(1) # Set various parameters of the exchange.
    exchange.SetContractType(["this_week","next_week","quarter"][ContractTypeIdx])  # Determine which specific contract to trade.
    exchange.SetMarginLevel([10,20][MarginLevelIdx]) # Set the margin rate, also known as leverage.

    if len(exchange.GetPosition()) > 0: # Set up fault tolerance mechanism.
        raise Error_AtBeginHasPosition
    CancelPendingOrders()
    InitAccount = LastAccount = exchange.GetAccount()
    LoopInterval = min(1,LoopInterval)
    Log("Trading platforms:",exchange.GetName(), InitAccount)
    LogStatus("Ready...")

    LogProfitReset()
    chart = Chart(ChartCfg)
    chart.reset()

    LoopInterval = max(LoopInterval, 1)
    while True: # Loop the whole transaction logic and call the onTick function.
        onTick(exchange)
        Sleep(LoopInterval * 1000) # Take a break to prevent the API from being accessed too frequently and the account from being blocked.
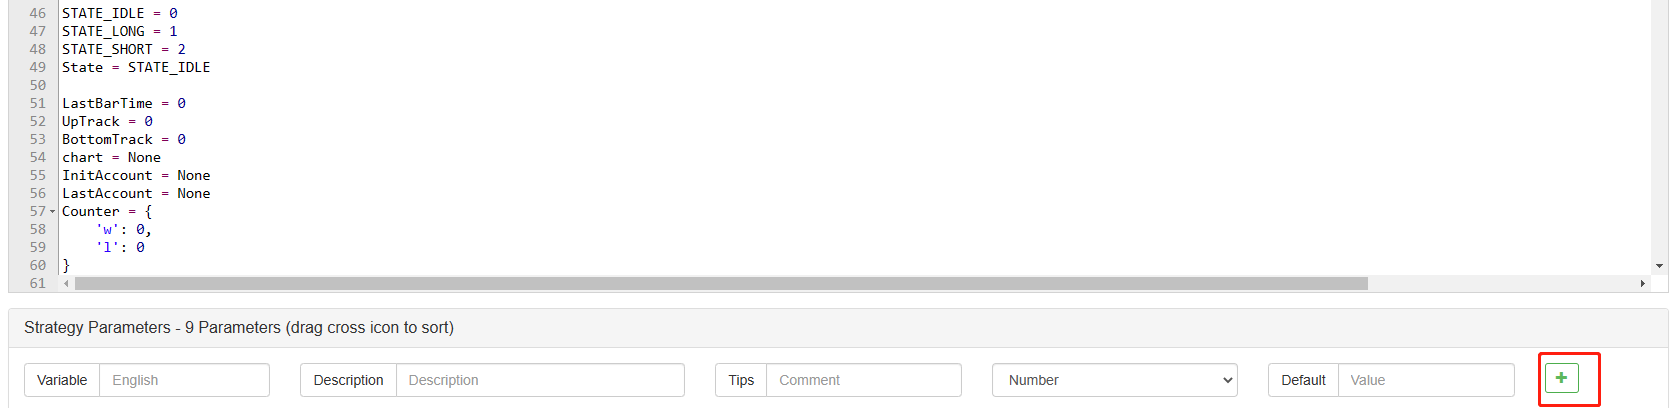
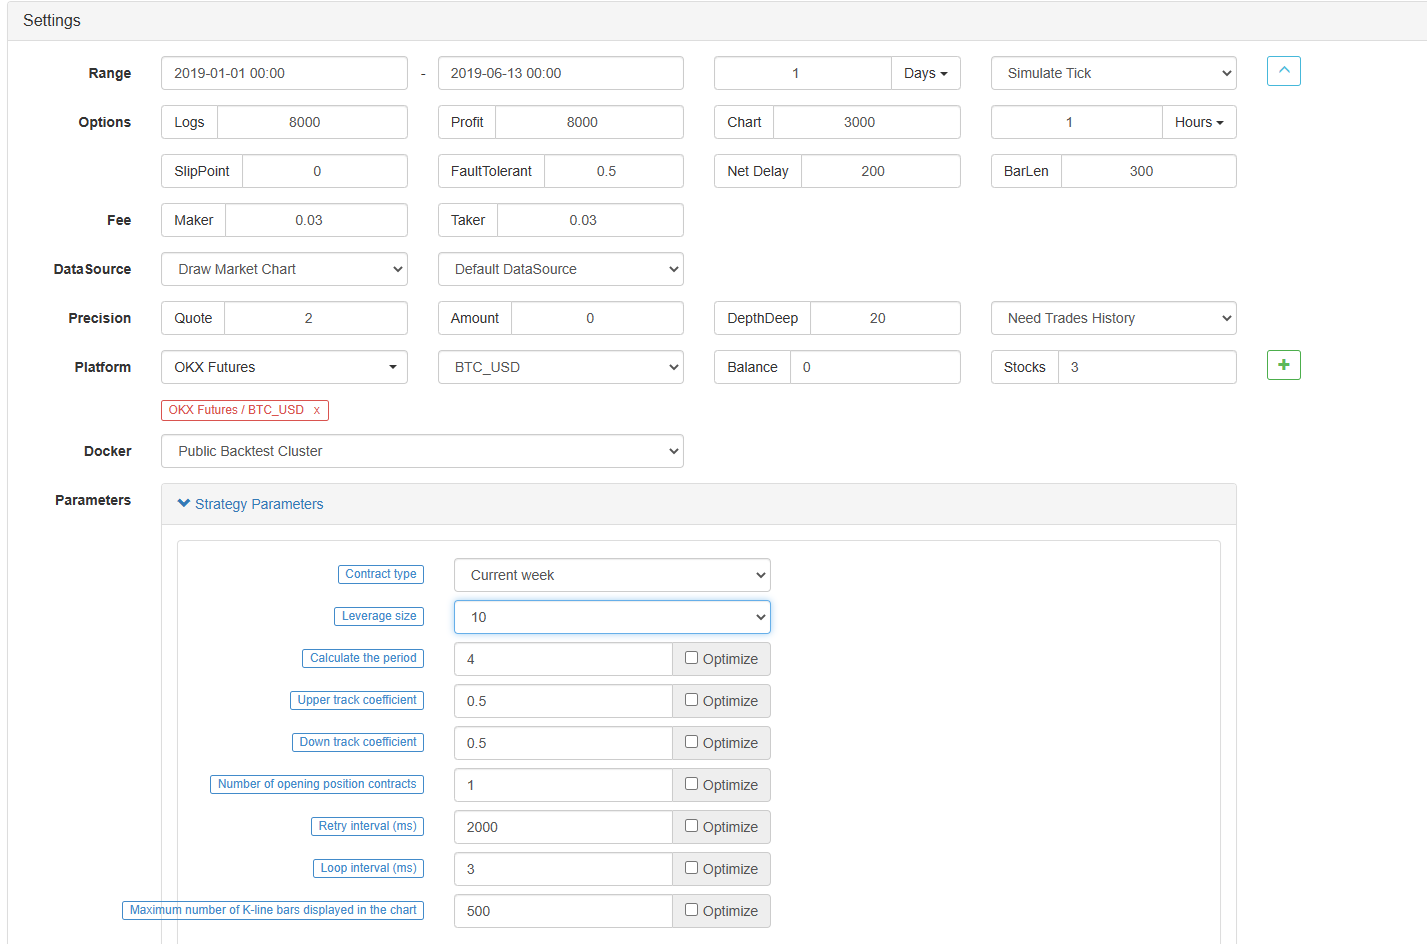
코드를 작성한 후, 우리는 전체 전략을 완료하지 않았다는 점을 유의하십시오. 다음으로, 우리는 전략 편집 페이지에 전략에서 사용되는 매개 변수를 추가해야합니다. 추가 방법은 매우 간단합니다. 전략 작성 대화 상자 하단에 있는 플러스 기호를 클릭하면 하나씩 추가 할 수 있습니다.
추가해야 하는 내용:
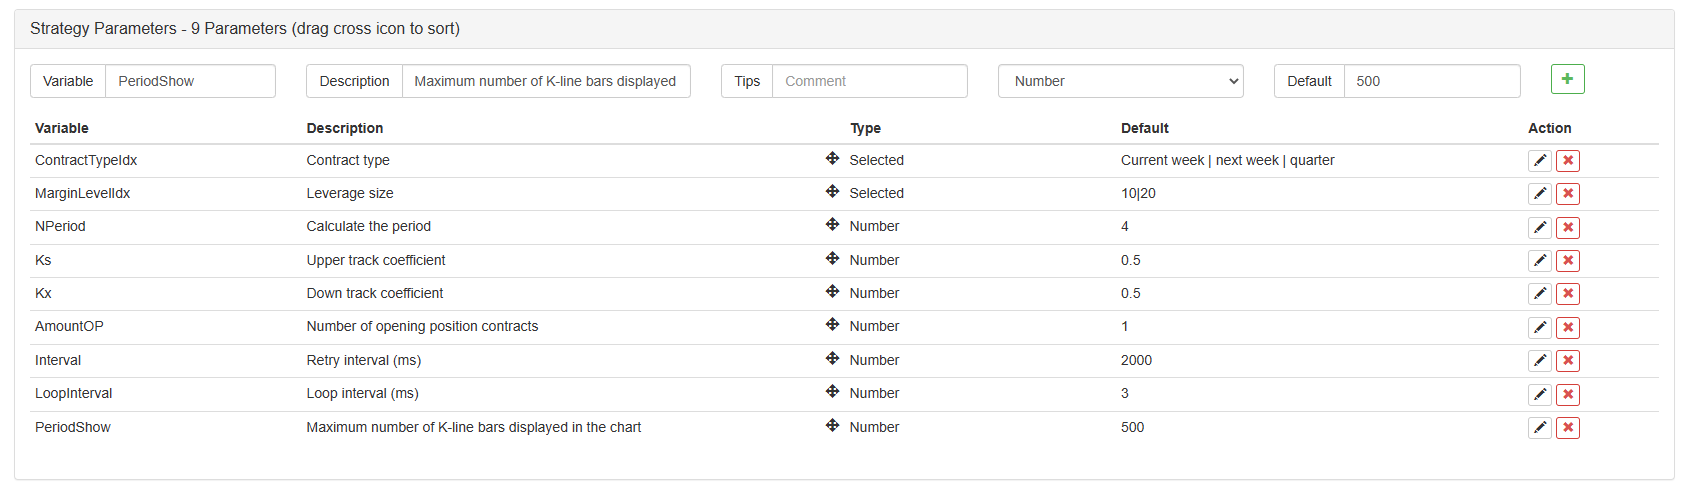
이제까지, 우리는 마침내 전략의 작성을 완료했습니다. 다음으로, 전략의 백테스트를 시작합시다.
전략 역 테스트
전략을 작성한 후, 우리가 해야 할 첫 번째 일은 역사적 데이터에서 어떻게 행동하는지 확인하기 위해 백테스트를 수행하는 것입니다. 그러나 백테스트의 결과가 미래에 대한 예측과 같지 않다는 것을 유의하십시오. 백테스트는 우리의 전략의 효과를 고려하기 위해 참조로만 사용될 수 있습니다. 시장이 변경되고 전략이 큰 손실을 받기 시작하면, 우리는 시기에 문제를 발견하고, 위에서 언급한 임계와 같은 새로운 시장 환경에 적응하기 위해 전략을 변경해야합니다. 전략이 10% 이상의 손실을 가지고 있다면, 우리는 즉시 전략의 운영을 중단하고 문제를 찾을 수 있습니다. 우리는 임계 조정으로 시작할 수 있습니다.
전략 편집 페이지에서 백테스트를 클릭하십시오. 백테스트 페이지에서, 매개 변수 조정은 다양한 필요에 따라 편리하고 빠르게 수행 할 수 있습니다. 특히 복잡한 논리와 많은 매개 변수를 가진 전략에 대해, 소스 코드로 돌아가서 하나씩 수정할 필요가 없습니다.
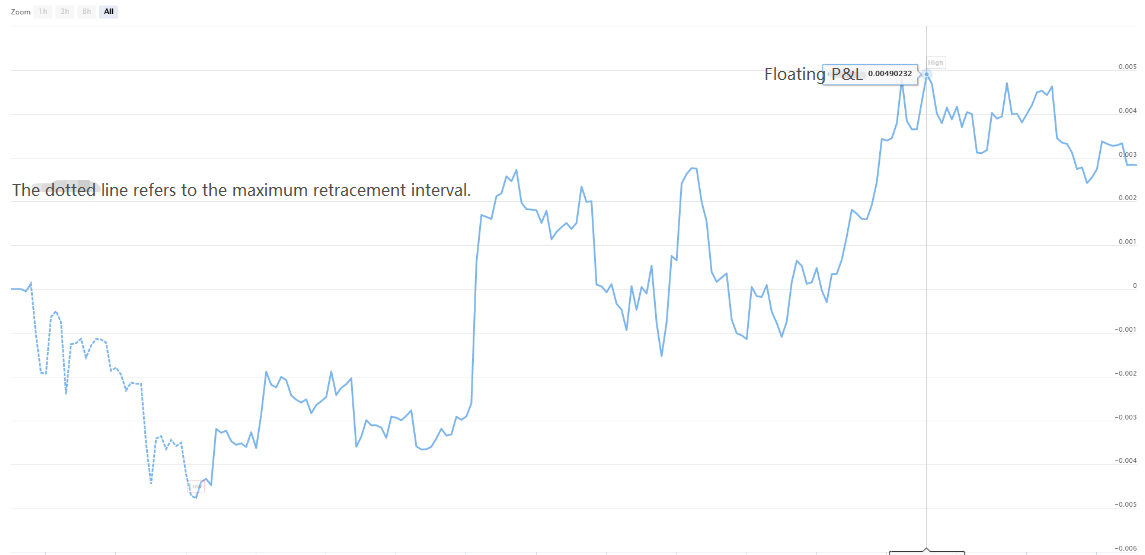
백테스트 시간은 최근 6개월입니다. OKCoin 미래에셋 거래소를 추가 클릭하고 BTC 거래 목표를 선택합니다.
지난 6개월 동안 이 전략은 BTC의 매우 좋은 일방적 트렌드 때문에 좋은 수익을 얻었다는 것을 알 수 있습니다.

궁금한 게 있으면https://www.fmz.com/bbs, 그것이 플랫폼의 전략이나 기술에 관한 것이든 FMZ Quant 플랫폼은 귀하의 질문에 대답 할 준비가 된 전문가가 있습니다.
- 암호화폐 시장의 근본 분석을 정량화: 데이터를 스스로 이야기하도록!
- 동전圈의 기초적인 양적 연구 - 더 이상 모든
선생님들을 믿지 말고, 데이터를 객관적으로 이야기하십시오! - 양적 거래의 필수 도구 - 발명자 양적 데이터 탐색 모듈
- 모든 것을 마스터 - FMZ에 대한 소개 트레이딩 터미널의 새로운 버전 (TRB 중재 소스 코드)
- FMZ의 새로운 거래 단말기 소개 (TRB 리비트 소스 추가)
- FMZ 퀀트: 암호화폐 시장에서 공통 요구 사항 설계 예제 분석 (II)
- 80 줄의 코드에서 고주파 전략으로 뇌 없는 판매봇을 이용하는 방법
- FMZ 정량화: 암호화폐 시장의 일반적인 요구 디자인 사례 분석 (II)
- 80줄의 코드의 고주파 전략으로 뇌 없는 로봇을 파는 방법
- FMZ Quant: 암호화폐 시장에서 공통 요구 사항 디자인 예의 분석 (I)
- FMZ 정량화: 암호화폐 시장의 일반적인 요구 디자인 사례 분석 (1)