
KLineChart 기능을 활용하면 전략 도면 설계가 더욱 쉬워집니다.
전략을 설계할 때 JavaScript나 Python을 사용하여 전략을 작성하면 전략 차트 표시를 디자인해야 하는 경우가 많습니다. 프로그래밍이나 FMZ 플랫폼에서 사용하는 차팅 라이브러리에 익숙하지 않은 사용자는 사용자 정의 차트에 그림을 그리는 데 필요한 코드 디자인에 어려움을 겪는 경우가 많습니다. 그러면 적은 양의 코드만 작성하여 풍부한 내용이 담긴 전략 차트를 어떻게 그릴 수 있을까요?
이 간단하면서도 강력한 그림 그리기 방법은 풍부한 그림 그리기 기능으로 유명한 소나무 언어에서 볼 수 있습니다. Pine 언어의 그리기 인터페이스를 JavaScript와 Python 언어의 전략과 연결할 수 있다면 개발자가 전략의 그리기 기능을 설계하는 것이 크게 편리해질 것입니다. 이러한 수요에 따라 FMZ 플랫폼은 맞춤형 도면 기능을 업그레이드하고 그 사용을 확대했습니다.KLineChart이 함수는 사용자 정의 차트 그리기를 수행합니다. API 문서를 참조하세요: https://www.fmz.com/api#klinechart
JavaScript를 사용하여 간단한 전환 예제를 작성해 보겠습니다.
간단한 예
javascript
/*backtest
start: 2022-03-21 09:00:00
end: 2022-06-21 15:00:00
period: 30m
basePeriod: 15m
exchanges: [{"eid":"Binance","currency":"BTC_USDT"}]
*/
function main() {
var c = KLineChart()
while (true) {
var bars = _C(exchange.GetRecords)
for (var i = 0 ; i < bars.length ; i++) {
var bar = bars[i]
c.begin(bar)
c.plot(bar.Volume, "volume")
c.close()
}
Sleep(1000)
}
}
이 예는 매우 간단합니다. 전략의 사용자 지정 그리기 영역에 캔들스틱 차트를 그린 다음 차트의 하위 차트 위치에 각 캔들스틱 BAR에 해당하는 볼륨 곡선을 그립니다.
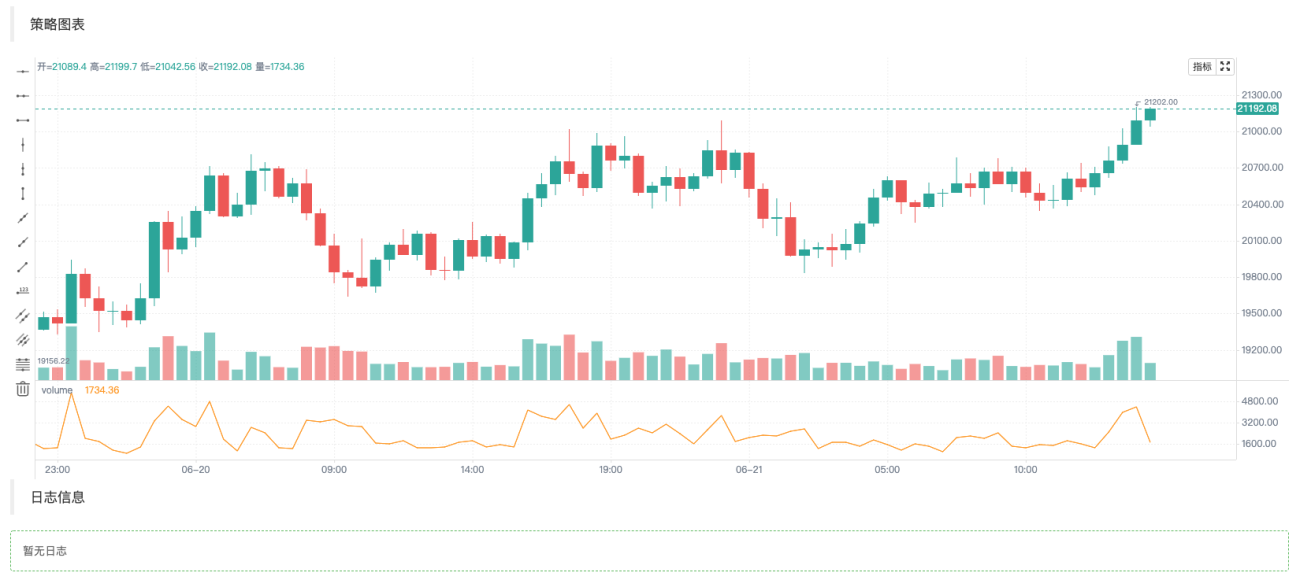
우리가 처음 사용하는 코드에서는var c = KLineChart()차트 객체를 생성한 후 해당 메서드를 호출하여 그립니다. 그런 다음 루프에서 K-라인 데이터(배열 구조)를 가져오고 K-라인 배열을 탐색합니다. 예시와 같이 간단한 for 루프를 사용하여 탐색할 수도 있고, 다른 방법을 사용하여 탐색할 수도 있습니다.
그리기 작업은 다음에서 수행해야 합니다.c.begin(bar)기능이 시작됩니다.c.close()기능이 종료됩니다.begin、close함수는 차트 객체 c의 메서드입니다. 다음으로 가장 많이 사용되는 그리기 기능을 이용해보세요plot각 BAR에 볼륨 곡선을 그립니다.
좀 더 복잡한 예
볼린저 지표를 사용하여 차트를 디자인하고 싶다고 가정해 보겠습니다. 오, 맞아요! 또한 각 BAR에 대한 볼륨 차트를 첨부하는 것이 필요한데, 이는 다음과 같이 디자인할 수 있습니다.
            javascript

            /*backtest
start: 2022-03-21 09:00:00
end: 2022-06-21 15:00:00
period: 1d
basePeriod: 1h
exchanges: [{"eid":"Binance","currency":"BTC_USDT"}]
*/

function main() {
    var c = KLineChart()

    // 策略主循环
    while(true) {
        // 轮询间隔
        Sleep(500)

        // 获取K线数据
        let bars = exchange.GetRecords()
        if (!bars || bars.length <= 20) {
            continue
        }

        // 计算布林指标
        var boll = TA.BOLL(bars)

        bars.forEach(function(bar, index) {
            c.begin(bar)
            // 画图操作
            c.plot(boll[0][index], "Boll_Up", {overlay: true})     // 画在图表主图
            c.plot(boll[1][index], "Boll_Mid", {overlay: true})    // 画在图表主图
            c.plot(boll[2][index], "Boll_Down", {overlay: true})   // 画在图表主图
            c.plot(bar.Volume, "volume")                           // 画在图表副图
            c.close()
        })

        // 策略交易逻辑
        // ...
        // ..
    }
}
FMZ 플랫폼의 백테스트 구성 정보는 코드에서 다음과 같습니다.
            /*backtest
start: 2022-03-21 09:00:00
end: 2022-06-21 15:00:00
period: 1d
basePeriod: 1h
exchanges: [{"eid":"Binance","currency":"BTC_USDT"}]
*/
이 구성은 Binance spot exchange 객체를 사용하여 백테스트되었습니다. 백테스트 결과는 그림에 나와 있습니다.
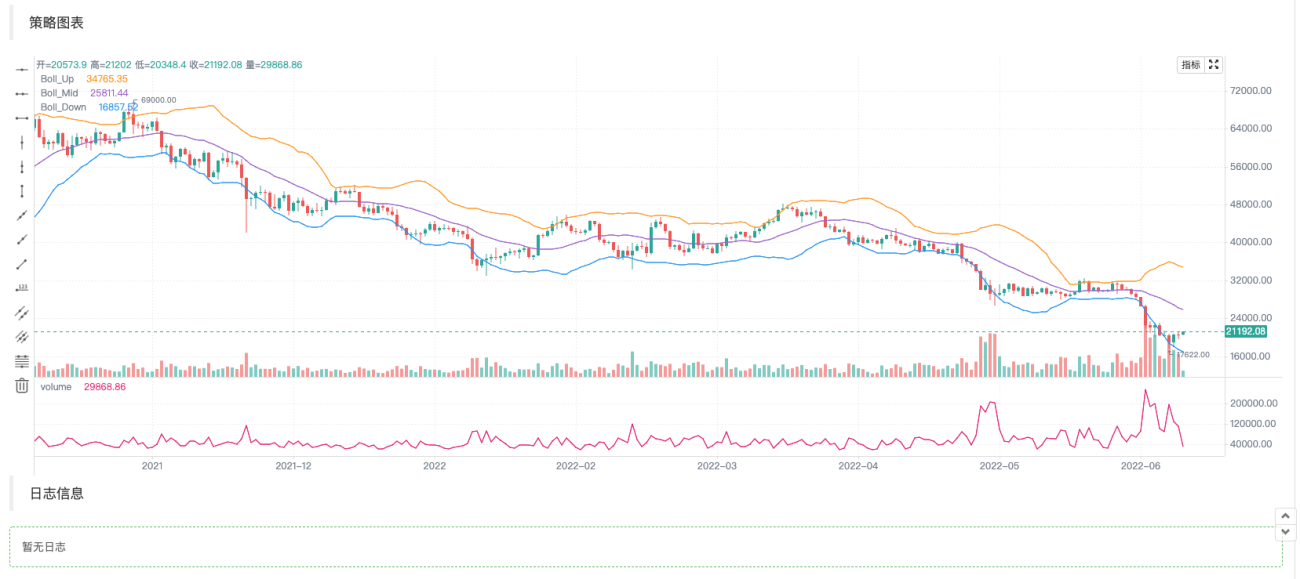
JavaScript 언어에서 그리기 코드를 크게 단순화하기 위해 Pine의 그리기 방법을 사용한 것을 볼 수 있습니다.
지표 및 기타 데이터를 작성하여 그림을 그리세요
K-라인 데이터를 수집하고 지표를 계산하는 등의 작업은 플랫폼 전략 스퀘어의 전략 사례와 API 문서에서 흔하고 매우 간단합니다.
            javascript

                    // 获取K线数据
        let bars = exchange.GetRecords()
        if (!bars || bars.length <= 20) {
            // 如果获取K线失败,即!bar为真则执行continue,忽略之后的代码,重新执行循环
            // 如果bars.length小于等于20,即K线BAR(柱)数量小于20,无法计算指标,也执行continue
            continue
        }

        // 计算布林指标
        var boll = TA.BOLL(bars)
Bollinger 지표 계산 함수 TA.BOLL, Bollinger 지표 매개변수를 지정하지 않으면 기본 매개변수가 사용됩니다.BOLL(20, 2). 볼린저 지표에는 3개의 선이 있으므로 TA.BOLL 함수가 반환하는 데이터는 2차원 배열입니다. 볼[0]、boll[1]、boll[2]는 boll 배열의 세 요소이며, 각각은 줄을 나타내고 배열입니다.
- boll[0]: 볼린저 밴드 온라인
- boll[1]: 볼린저 밴드 중간선
- boll[2]: 볼린저 밴드 하락
그러면 K-라인 데이터의 볼륨, 즉 거래량과 계산된 볼린저 지표 데이터를 차트에 그리는 방법을 살펴보겠습니다.
K-라인 데이터를 막대별로 그리므로 전체 K-라인 배열을 탐색해야 합니다. 즉, 코드에서는 막대 배열을 탐색해야 합니다. 여기서 우리는 사용합니다forEachfor 루프를 사용하여 메서드 순회를 수행할 수도 있습니다.
            javascript

                    bars.forEach(function(bar, index) {
            c.begin(bar)
            // 画图操作
            c.plot(boll[0][index], "Boll_Up", {overlay: true})     // {overlay: true}参数控制,画在图表主图
            c.plot(boll[1][index], "Boll_Mid", {overlay: true})    // 画在图表主图
            c.plot(boll[2][index], "Boll_Down", {overlay: true})   // 画在图表主图
            c.plot(bar.Volume, "volume")                           // 画在图表副图
            c.close()
        })
막대에 차트를 그리기 시작할 때마다 먼저 다음 사항을 염두에 두어야 합니다.c.begin(bar)함수 호출,begin함수는 차트 객체 c의 메서드입니다. 그리기 작업이 끝나면 호출해야 합니다.c.close(). 존재하다begin기능 및close함수 사이에는 Pine 언어의 그리기 방법과 비슷한 그리기 함수가 있습니다. 지원하다:barcolor bgcolor plot fill hline plotarrow plotshape plotchar plotcandle signal, 선과 화살표를 그리거나, 정보를 표시하는 등의 작업이 가능합니다. 이러한 함수의 매개변수는 Pine 언어의 해당 함수 매개변수와 일치하며, 그리기 함수도 일치합니다.
거래 신호 화살표, 마커, 수평선 및 기타 도면 추가
위의 볼린저 지표 그리기 예시에 일부 거래 신호 화살표, 마커, 수평선을 추가합니다.
            javascript

            /*backtest
start: 2022-03-21 09:00:00
end: 2022-06-21 15:00:00
period: 1d
basePeriod: 1h
exchanges: [{"eid":"Binance","currency":"BTC_USDT"}]
*/

function main() {
    var c = KLineChart()

    // 策略主循环
    while(true) {
        // 轮询间隔
        Sleep(500)

        // 获取K线数据
        let bars = exchange.GetRecords()
        if (!bars || bars.length <= 20) {
            continue
        }

        // 计算布林指标
        var boll = TA.BOLL(bars)

        bars.forEach(function(bar, index) {
            c.begin(bar)
            // 画图操作
            c.plot(boll[0][index], "Boll_Up", {overlay: true})     // 画在图表主图
            c.plot(boll[1][index], "Boll_Mid", {overlay: true})    // 画在图表主图
            c.plot(boll[2][index], "Boll_Down", {overlay: true})   // 画在图表主图
            c.plot(bar.Volume, "volume")                           // 画在图表副图

            c.hline(bar.Open, {overlay: true})                                         // 水平线
            c.plotarrow(bar.Close - bar.Open, {overlay: true})                         // 箭头
            c.plotshape(bar.Close - bar.Open > 0, {style: 'square', overlay: true})    // 画方块标记
            c.plotchar(bar.Close - bar.Open < 0, {char: '❄', size: "20px", overlay: true})           // 画出字符❄
            if (boll[0][index] && bar.Close > boll[0][index]) {
                c.signal("long", bar.Close, 1.5)
            } else if (boll[2][index] && bar.Close < boll[2][index]) {
                c.signal("closelong", bar.Close, 1.5)
            }

            c.close()
        })

        // 策略交易逻辑
        // ...
        // ..
    }
}
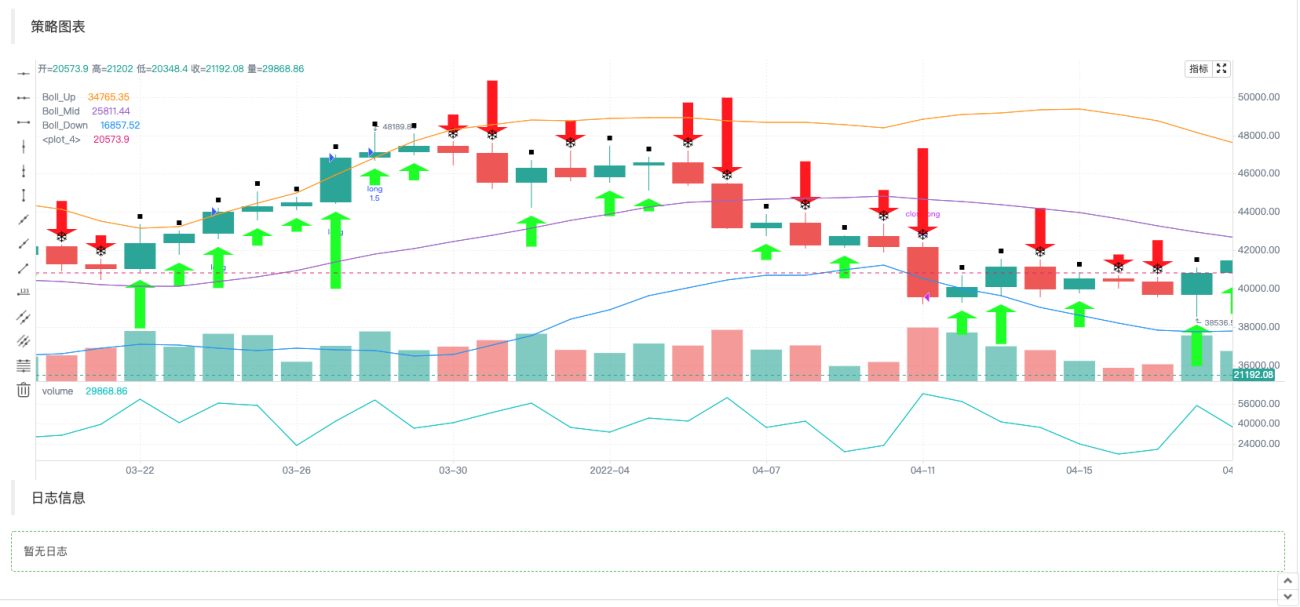
Pine 언어 전략 주문 작업은 자동으로 차트에 신호를 표시하므로KLineChart이 함수로 생성된 차트 객체는 매수 및 매도 신호 마커를 그리는 함수로 확장되었습니다.c.signal。
차트 구성 객체
차트 스타일을 구성하기 위해 구조를 선언할 수 있습니다. 예를 들어, 다음 chartCfg 변수는 그리드 라인의 구성 정보를 나타냅니다.
            javascript

                var chartCfg = {
        grid: {
            show: true,
            // 网格水平线
            horizontal: {
                show: true,
                size: 2,
                color: '#FF0000',    // 水平网格线的颜色
                // 'solid'|'dash'
                style: 'dash',       // 线的类型
                dashValue: [2, 2]
            },
   	        // 网格垂直线
            vertical: {
                show: true,
                size: 2,
                color: '#32CD32',
                // 'solid'|'dash'
                style: 'solid',
                dashValue: [2, 2]
            }
        },
    }
차트 구성 객체는 차트의 일부 속성과 모양을 설정하는 데이터 구조입니다. 예를 들어, 이 예에서는 그리드 선 스타일 구성을 사용합니다. X축 및 Y축 관련 설정, 커서 라인 설정, 프롬프트 정보 설정, 기술 지표 스타일 설정 등 구성 및 수정 가능한 옵션도 많이 있습니다. K-라인 BAR 스타일 설정 등
물론, 이것들에 익숙하지 않다면,KLineChart차트 객체를 생성할 때 함수는 차트 구성 객체를 전달할 필요가 없습니다. 생성된 차트는 기본 스타일입니다. FMZ 플랫폼의 API 기능 사용하기KLineChart차트 객체를 생성하는 기능:
            javascript

            var c = KLineChart(chartCfg)
그리드 선을 그리기 위한 테스트 코드:
            javascript

            /*backtest
start: 2022-03-21 09:00:00
end: 2022-06-21 15:00:00
period: 1d
basePeriod: 1h
exchanges: [{"eid":"Binance","currency":"BTC_USDT"}]
*/

function main() {
    var chartCfg = {
        grid: {
            show: true,
            // 网格水平线
            horizontal: {
                show: true,
                size: 2,
                color: '#FF0000',
                // 'solid'|'dash'
                style: 'dash',
                dashValue: [2, 2]
            },
   	        // 网格垂直线
            vertical: {
                show: true,
                size: 2,
                color: '#32CD32',
                // 'solid'|'dash'
                style: 'solid',
                dashValue: [2, 2]
            }
        },
    }

    var c = KLineChart(chartCfg)

    // 策略主循环
    while(true) {
        // 轮询间隔
        Sleep(500)

        // 获取K线数据
        var bars = _C(exchange.GetRecords)
        bars.forEach(function(bar, index) {
            c.begin(bar)
            c.close()
        })

        // 策略交易逻辑
        // ...
        // ..
    }
}
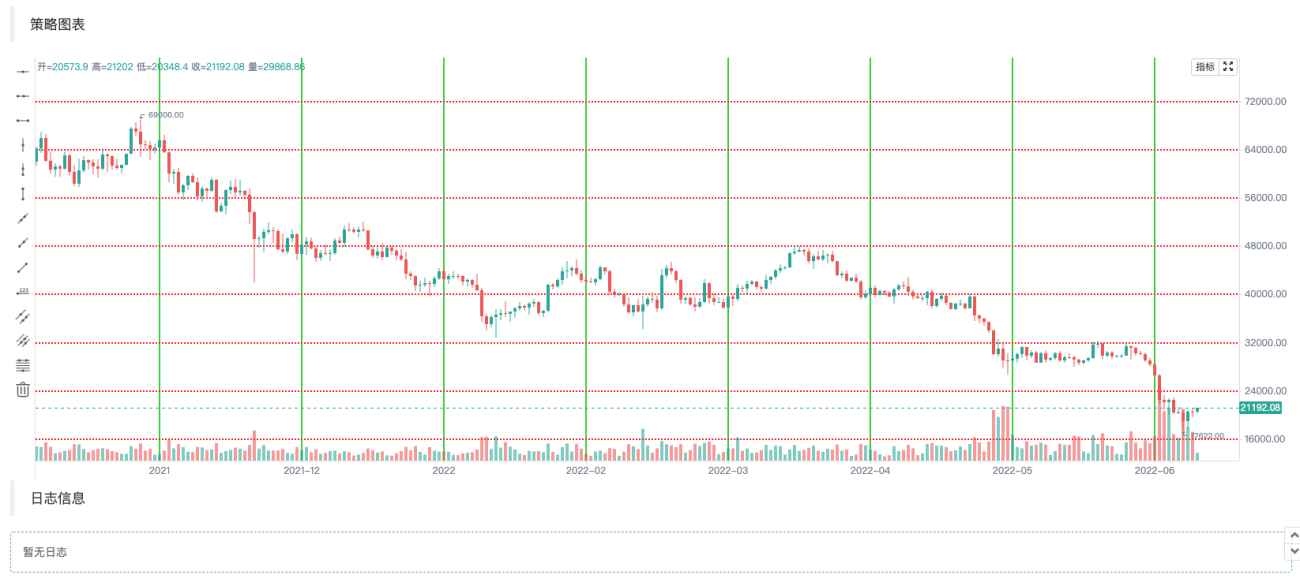
차트 구성 스타일 예
차트 구성 스타일의 설정을 참조하는 데 사용할 수 있습니다.
javascript
{
// 网格线
grid: {
show: true,
// 网格水平线
horizontal: {
show: true,
size: 1,
color: '#393939',
// 'solid'|'dash'
style: 'dash',
dashValue: [2, 2]
},
// 网格垂直线
vertical: {
show: false,
size: 1,
color: '#393939',
// 'solid'|'dash'
style: 'dash',
dashValue: [2, 2]
}
},
// 蜡烛图
candle: {
// 蜡烛图上下间距,大于1为绝对值,大于0小余1则为比例
margin: {
top: 0.2,
bottom: 0.1
},
// 蜡烛图类型 'candle_solid'|'candle_stroke'|'candle_up_stroke'|'candle_down_stroke'|'ohlc'|'area'
type: 'candle_solid',
// 蜡烛柱
bar: {
upColor: '#26A69A',
downColor: '#EF5350',
noChangeColor: '#888888'
},
// 面积图
area: {
lineSize: 2,
lineColor: '#2196F3',
value: 'close',
backgroundColor: [{
offset: 0,
color: 'rgba(33, 150, 243, 0.01)'
}, {
offset: 1,
color: 'rgba(33, 150, 243, 0.2)'
}]
},
priceMark: {
show: true,
// 最高价标记
high: {
show: true,
color: '#D9D9D9',
textMargin: 5,
textSize: 10,
textFamily: 'Helvetica Neue',
textWeight: 'normal'
},
// 最低价标记
low: {
show: true,
color: '#D9D9D9',
textMargin: 5,
textSize: 10,
textFamily: 'Helvetica Neue',
textWeight: 'normal',
},
// 最新价标记
last: {
show: true,
upColor: '#26A69A',
downColor: '#EF5350',
noChangeColor: '#888888',
line: {
show: true,
// 'solid'|'dash'
style: 'dash',
dashValue: [4, 4],
size: 1
},
text: {
show: true,
size: 12,
paddingLeft: 2,
paddingTop: 2,
paddingRight: 2,
paddingBottom: 2,
color: '#FFFFFF',
family: 'Helvetica Neue',
weight: 'normal',
borderRadius: 2
}
}
},
// 提示
tooltip: {
// 'always' | 'follow_cross' | 'none'
showRule: 'always',
// 'standard' | 'rect'
showType: 'standard',
labels: ['时间', '开', '收', '高', '低', '成交量'],
values: null,
defaultValue: 'n/a',
rect: {
paddingLeft: 0,
paddingRight: 0,
paddingTop: 0,
paddingBottom: 6,
offsetLeft: 8,
offsetTop: 8,
offsetRight: 8,
borderRadius: 4,
borderSize: 1,
borderColor: '#3f4254',
backgroundColor: 'rgba(17, 17, 17, .3)'
},
text: {
size: 12,
family: 'Helvetica Neue',
weight: 'normal',
color: '#D9D9D9',
marginLeft: 8,
marginTop: 6,
marginRight: 8,
marginBottom: 0
}
}
},
// 技术指标
technicalIndicator: {
margin: {
top: 0.2,
bottom: 0.1
},
bar: {
upColor: '#26A69A',
downColor: '#EF5350',
noChangeColor: '#888888'
},
line: {
size: 1,
colors: ['#FF9600', '#9D65C9', '#2196F3', '#E11D74', '#01C5C4']
},
circle: {
upColor: '#26A69A',
downColor: '#EF5350',
noChangeColor: '#888888'
},
// 最新值标记
lastValueMark: {
show: false,
text: {
show: false,
color: '#ffffff',
size: 12,
family: 'Helvetica Neue',
weight: 'normal',
paddingLeft: 3,
paddingTop: 2,
paddingRight: 3,
paddingBottom: 2,
borderRadius: 2
}
},
// 提示
tooltip: {
// 'always' | 'follow_cross' | 'none'
showRule: 'always',
// 'standard' | 'rect'
showType: 'standard',
showName: true,
showParams: true,
defaultValue: 'n/a',
text: {
size: 12,
family: 'Helvetica Neue',
weight: 'normal',
color: '#D9D9D9',
marginTop: 6,
marginRight: 8,
marginBottom: 0,
marginLeft: 8
}
}
},
// x轴
xAxis: {
show: true,
height: null,
// x轴线
axisLine: {
show: true,
color: '#888888',
size: 1
},
// x轴分割文字
tickText: {
show: true,
color: '#D9D9D9',
family: 'Helvetica Neue',
weight: 'normal',
size: 12,
paddingTop: 3,
paddingBottom: 6
},
// x轴分割线
tickLine: {
show: true,
size: 1,
length: 3,
color: '#888888'
}
},
// y轴
yAxis: {
show: true,
width: null,
// 'left' | 'right'
position: 'right',
// 'normal' | 'percentage' | 'log'
type: 'normal',
inside: false,
reverse: false,
// y轴线
axisLine: {
show: true,
color: '#888888',
size: 1
},
// y轴分割文字
tickText: {
show: true,
color: '#D9D9D9',
family: 'Helvetica Neue',
weight: 'normal',
size: 12,
paddingLeft: 3,
paddingRight: 6
},
// y轴分割线
tickLine: {
show: true,
size: 1,
length: 3,
color: '#888888'
}
},
// 图表之间的分割线
separator: {
size: 1,
color: '#888888',
fill: true,
activeBackgroundColor: 'rgba(230, 230, 230, .15)'
},
// 十字光标
crosshair: {
show: true,
// 十字光标水平线及文字
horizontal: {
show: true,
line: {
show: true,
// 'solid'|'dash'
style: 'dash',
dashValue: [4, 2],
size: 1,
color: '#888888'
},
text: {
show: true,
color: '#D9D9D9',
size: 12,
family: 'Helvetica Neue',
weight: 'normal',
paddingLeft: 2,
paddingRight: 2,
paddingTop: 2,
paddingBottom: 2,
borderSize: 1,
borderColor: '#505050',
borderRadius: 2,
backgroundColor: '#505050'
}
},
// 十字光标垂直线及文字
vertical: {
show: true,
line: {
show: true,
// 'solid'|'dash'
style: 'dash',
dashValue: [4, 2],
size: 1,
color: '#888888'
},
text: {
show: true,
color: '#D9D9D9',
size: 12,
family: 'Helvetica Neue',
weight: 'normal',
paddingLeft: 2,
paddingRight: 2,
paddingTop: 2,
paddingBottom: 2,
borderSize: 1,
borderColor: '#505050',
borderRadius: 2,
backgroundColor: '#505050'
}
}
},
// 图形
shape: {
point: {
backgroundColor: '#2196F3',
borderColor: '#2196F3',
borderSize: 1,
radius: 4,
activeBackgroundColor: '#2196F3',
activeBorderColor: '#2196F3',
activeBorderSize: 1,
activeRadius: 6
},
line: {
// 'solid'|'dash'
style: 'solid'
color: '#2196F3',
size: 1,
dashValue: [2, 2]
},
polygon: {
// 'stroke'|'fill'
style: 'stroke',
stroke: {
// 'solid'|'dash'
style: 'solid',
size: 1,
color: '#2196F3',
dashValue: [2, 2]
},
fill: {
color: 'rgba(33, 150, 243, 0.1)'
}
},
arc: {
// 'stroke'|'fill'
style: 'stroke',
stroke: {
// 'solid'|'dash'
style: 'solid',
size: 1,
color: '#2196F3',
dashValue: [2, 2]
},
fill: {
color: '#2196F3'
}
},
text: {
style: 'fill',
color: '#2196F3',
size: 12,
family: 'Helvetica Neue',
weight: 'normal',
offset: [0, 0]
}
},
annotation: {
// 'top' | 'bottom' | 'point'
position: 'top',
offset: [20, 0]
symbol: {
// 'diamond' | 'circle' | 'rect' | 'triangle' | 'custom' | 'none'
type: 'diamond',
size: 8,
color: '#2196F3',
activeSize: 10,
activeColor: '#FF9600'
}
},
tag: {
// 'top' | 'bottom' | 'point'
position: 'point',
offset: 0,
line: {
show: true,
style: LineStyle.DASH,
dashValue: [4, 2],
size: 1,
color: '#2196F3'
},
text: {
color: '#FFFFFF',
backgroundColor: '#2196F3',
size: 12,
family: 'Helvetica Neue',
weight: 'normal',
paddingLeft: 2,
paddingRight: 2,
paddingTop: 2,
paddingBottom: 2,
borderRadius: 2,
borderSize: 1,
borderColor: '#2196F3'
},
mark: {
offset: 0,
color: '#FFFFFF',
backgroundColor: '#2196F3',
size: 12,
family: 'Helvetica Neue',
weight: 'normal',
paddingLeft: 2,
paddingRight: 2,
paddingTop: 2,
paddingBottom: 2,
borderRadius: 2,
borderSize: 1,
borderColor: '#2196F3'
}
}
}
이렇게 하면 전략 수립과 디자인이 더 쉬워지지 않나요?

梦总,感谢分享!
我请教一个场景,不知道现阶段使用KLineChart能否实现。 具体场景说明:
1、策略是多品种交易 ;
2、加载策略的时候,默认指定的品种进行图表的绘制,包括K线、指标、交易信号等等;
3、通过筛选框,选择其他的交易品种,获取历史K线绘制图表,直到当前时间对应的K线。
目的在于通过图表直接观察各个交易品种是否是合理开平仓的,交易是否正常。

1、策略是多品种交易 ;
对于多图表,KLineChart 函数不支持,可以使用画图接口Chart函数,可以参考多图表画线类库的设计。
2、加载策略的时候,默认指定的品种进行图表的绘制,包括K线、指标、交易信号等等;
单图表可以实现。
3、通过筛选框,选择其他的交易品种,获取历史K线绘制图表,直到当前时间对应的K线。
单图表可以实现,可以具体编写代码查询历史K线数据然后填充画图.
如果是多品种策略,建议使用Chart函数画图。KLineChart 函数目前只能单图表画图。
- 1