선형 회귀 ++
저자:차오장날짜: 2022-05-24 14:17:42태그:DEV
소비자 수요에
선형 회귀 공식 경고 와 함께 해제 된 계산
여기가 풍부한 기능을 좋아하는 거래자를 위한 선형 회귀 스크립트입니다.
특징 ++ 다중 시간 프레임 -> 다른 차트에서 소스 회귀 ++ 사용자 정의 색상 -> 이것은 소나무 라인을 포함합니다 ++ 매끄럽게 -> 필터링 회귀를 허용; 참고: 1을 사용하여 원래 줄에 기본 설정. 기본 설정은 1입니다. ++ 채널/역량 넘어가면 경고
사용 ++ 브레이크오웃과 리버설에 사용하세요 ++ 이 스크립트는 독립적으로 사용할 수 없습니다
위험성 참고로 이 스크립트는 볼링거 밴드와 비슷하며 트렌드 범위로 떨어질 위험이 있습니다. 시그널은 시장이 역전되는 동안 같은 방향으로 계속 움직일 수 있습니다.
요청 만약 당신이 어떤 기능 요청이 있다면, 아래에서 댓글을 달거나 D.M.를 보내라. 내가 할 수 있을 때 대답할 것이다. 차트에 이것을 활용하고 아이디어를 공유하십시오.
자신의 차트에 이것을 사용하려는 개발자를 위해, 이 스크립트를 사용하십시오 계산의 원본 공식은 여기에 있습니다.
❤❤❤ 이거 좋아하시길 바랍니다.
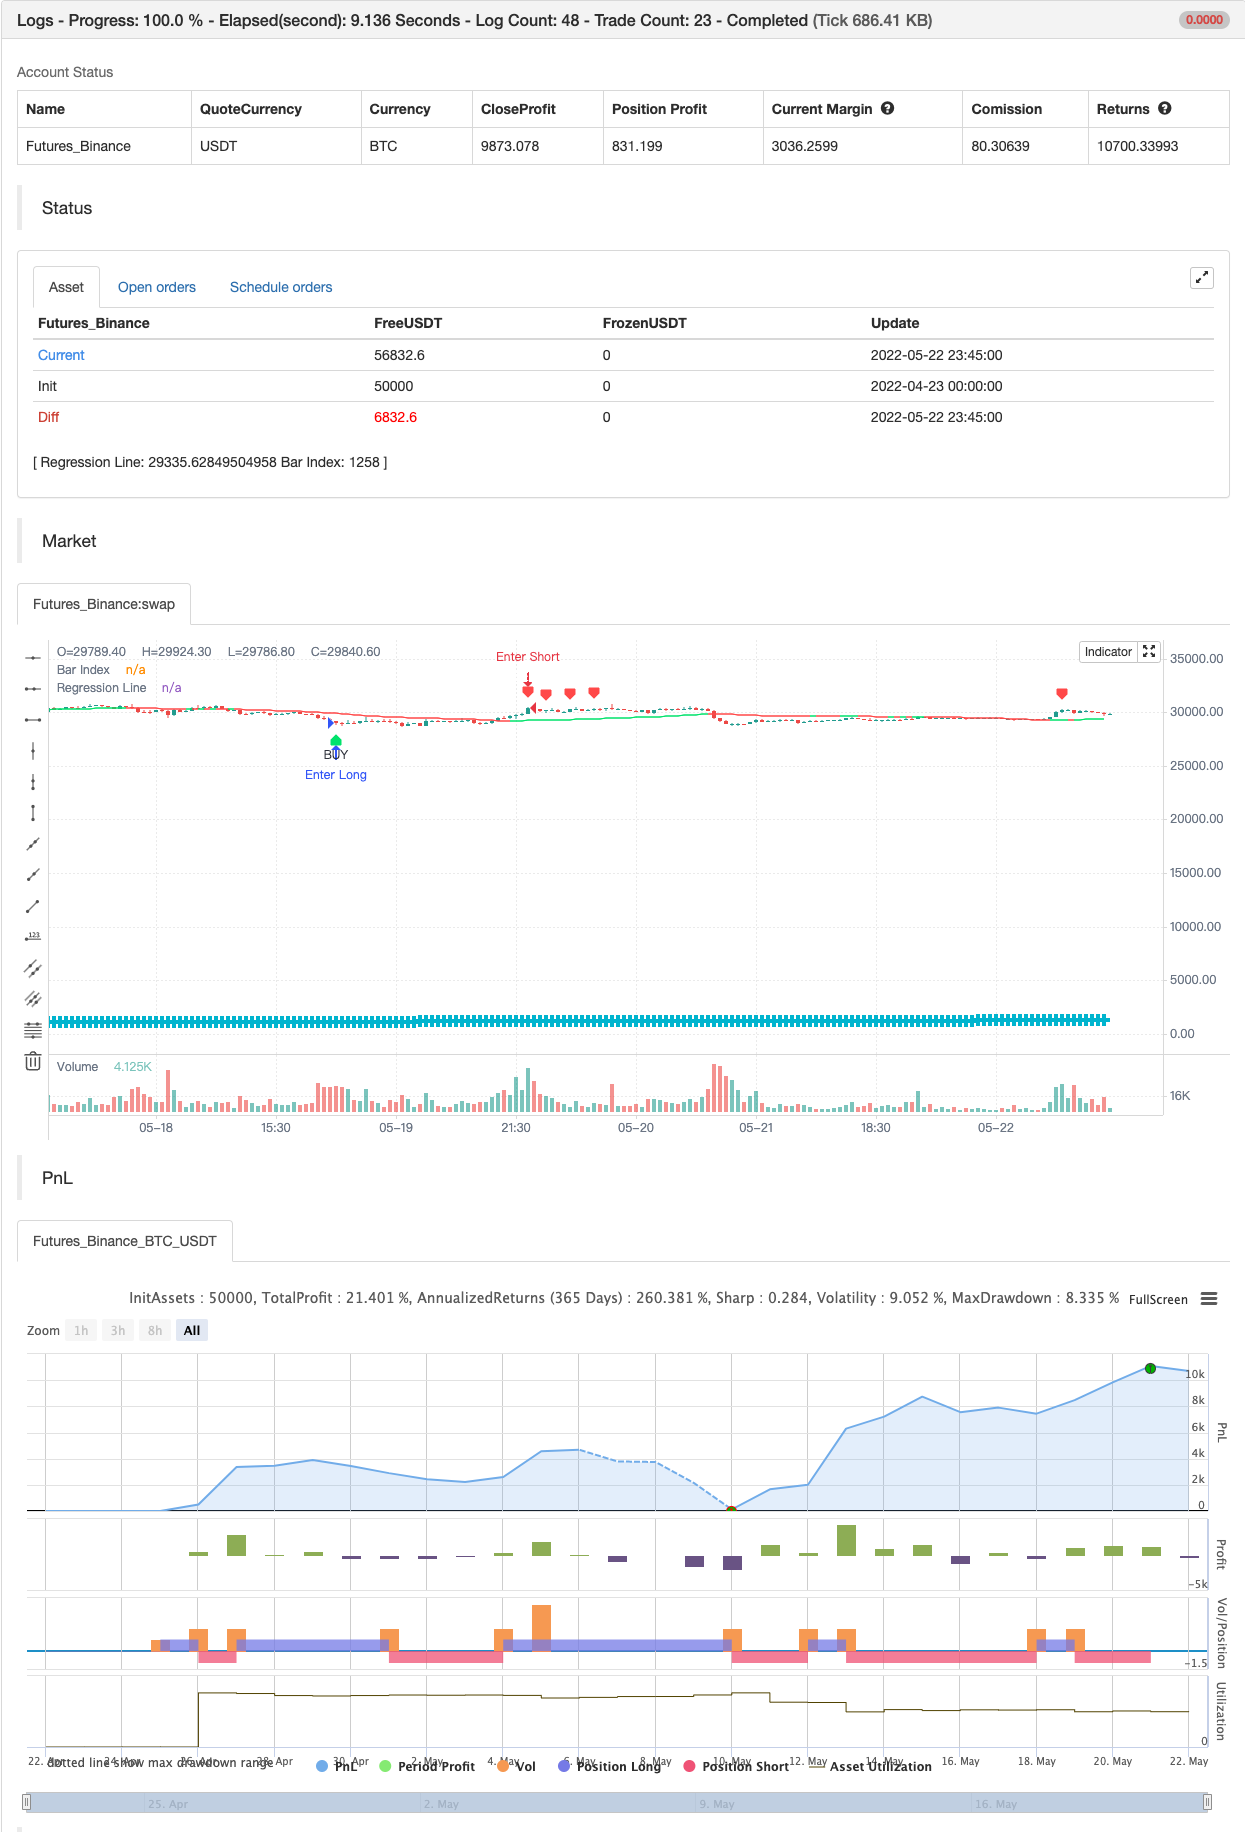
백테스트
/*backtest
start: 2022-04-23 00:00:00
end: 2022-05-22 23:59:00
period: 45m
basePeriod: 5m
exchanges: [{"eid":"Futures_Binance","currency":"BTC_USDT"}]
*/

// This source code is subject to the terms of the Mozilla Public License 2.0 at https://mozilla.org/MPL/2.0/
// © LucemAnb
// User Version

//@version=4
study("Linear Regression ++ [Lucem Anb]", "Lin Reg ++ [Lucem Anb]", overlay=true)


source      = input(close)
length      = input(100, minval=1)
offset      = input(0, minval=0)
dev         = input(2.0, "Deviation")
smoothing   = input(1, minval=1)
mtf_val     = input("", "Resolution", input.resolution)
line_thick  = input(4, "S&R Thickness", minval=1, maxval=4)
signals     = input("Recent", "Signals Display", options=["Recent", "All"])
p           = input("Lime", "Up Color", options=["Red", "Lime", "Orange", "Teal", "Yellow", "White", "Black"])
q           = input("Red", "Down Color", options=["Red", "Lime", "Orange", "Teal", "Yellow", "White", "Black"])
goto        = input(0, "End At Bar Index")

cc(x) => x=="Red"?color.red:x=="Lime"?color.lime:x=="Orange"?color.orange:x=="Teal"?
 color.teal:x=="Yellow"?color.yellow:x=="Black"?color.black:color.white
data(x) => sma(security(syminfo.tickerid, mtf_val!="" ? mtf_val : timeframe.period, x), smoothing)

linreg = data(linreg(source, length, offset))
linreg_p = data(linreg(source, length, offset+1))
plot(linreg, "Regression Line", cc(linreg>linreg[1]?p:q), editable=false)

x = bar_index
slope = linreg - linreg_p
intercept = linreg - x*slope
deviationSum = 0.0
for i=0 to length-1
    deviationSum:= deviationSum + pow(source[i]-(slope*(x-i)+intercept), 2)
deviation = sqrt(deviationSum/(length))
x1 = x-length
x2 = x
y1 = slope*(x-length)+intercept
y2 = linreg

updating = goto <= 0 or x < goto


dm_current = -deviation*dev + y2
dp_current = deviation*dev + y2
buy = crossunder(close, dm_current)
sell = crossover(close, dp_current)
alertcondition(buy, "Buy Lin Reg", "Crossing On the Lower Regression Channel")
alertcondition(sell, "Sell Lin Reg", "Crossing On the Higher Regression Channel")

plotshape(buy, "BUY", shape.labelup, location.belowbar, color.lime, text='BUY', textcolor=color.black, show_last=signals=="All"?99999999:length)
plotshape(sell, "SELL", shape.labeldown, location.abovebar, color.red, text='SELL', textcolor=color.white, show_last=signals=="All"?99999999:length)

plot(x, "Bar Index", color.aqua, line_thick, plot.style_cross, display=display.none)

if buy
    strategy.entry("Enter Long", strategy.long)
else if sell
    strategy.entry("Enter Short", strategy.short)
관련
더 많은
- 스칼핑 스윙 거래 도구 R1-4
- 가장 좋은 삼키기 + 탈출 전략
- Bollinger Awesome 알렛 R1
- 다중 거래소 통합 플러그인
- 삼각수당 (작은 통화의 거래 가격 차이)
- bybit 역계약 동적 격자 (特異格子)
- MT4 MT5 + 동적 변수 NOT-REPAINT
- 매트릭스 시리즈
- 슈퍼 스칼퍼 - 5분 15분
- 상대적 강도 지수 - 격차 - 자유
- 에너지 바와 함께 레드K 듀얼 바더
- 통합 구역 - 라이브
- 양적 질적 평가
- 이동 평균 크로스 알림, 다중 시간 프레임 (MTF)
- MACD 재충전 전략
- 슈퍼트렌드 이동 평균
- 거래 ABC
- 15MIN BTCUSDTPERP BOT
논 엔트로피 V2 - 수퍼트렌드 ATR TRAILING STOP LOSS