Estratégia ART multi-símbolo de futuros de criptomoedas (Instrução)
Autora:Ninabadass, Criado: 2022-04-07 11:09:42, Atualizado: 2022-04-07 16:15:14Estratégia ART multi-símbolo de futuros de criptomoedas (Instrução)
Recentemente, alguns usuários de nossa plataforma estão muito ansiosos para portar uma estratégia Mylanguage em uma estratégia JavaScript, para que muitas ideias de otimização possam ser adicionadas de forma flexível. Eles até desejam estender uma estratégia em uma versão de vários símbolos. Como as estratégias Mylanguage geralmente são estratégias de tendência e muitas são executadas em um modelo de preço próximo. Essas estratégias solicitam interface API da plataforma com pouca frequência, o que é mais adequado para a portagem em uma versão de estratégia multi-símbolo. No artigo, tomamos uma estratégia Mylanguage simples como exemplo e a portamos para uma versão simples da linguagem JavaScript. O objetivo principal é ensinar, backtestar e pesquisar.
Estratégia Mylangauge a ser portada
TR:=MAX(MAX((H-L),ABS(REF(C,1)-H)),ABS(REF(C,1)-L));
ATR:=EMA(TR,LENGTH2);

MIDLINE^^EMA((H + L + C)/3,LENGTH1);
UPBAND^^MIDLINE + N*ATR;
DOWNBAND^^MIDLINE - N*ATR;


BKVOL=0 AND C>=UPBAND AND REF(C,1)<REF(UPBAND,1),BPK;
SKVOL=0 AND C<=DOWNBAND AND REF(C,1)>REF(DOWNBAND,1),SPK;

BKVOL>0 AND C<=MIDLINE,SP(BKVOL);
SKVOL>0 AND C>=MIDLINE,BP(SKVOL);
// stop loss
C>=SKPRICE*(1+SLOSS*0.01),BP;
C<=BKPRICE*(1-SLOSS*0.01),SP;
AUTOFILTER;
A lógica da estratégia é muito simples. Primeiro, de acordo com os parâmetros, calcule o ATR e, em seguida, calcule os valores médios dos preços mais altos, mais baixos, fechados e abertos de todos os BARs da linha K, pelo qual o indicador EMA será calculado. Finalmente, com base no ATR e na relação N nos parâmetros, calcule upBand e downBand.
A posição aberta e a posição reversa são baseadas no preço de fechamento quebrando a upBand e a downBand. Quando o preço de fechamento atinge a linha média, posição fechada; quando o preço de fechamento atinge o preço de stop loss, posição fechada (de acordo com o SLOSS para stop loss; quando o SLOSS é 1, significa 0,01, ou seja, 1%). A estratégia é executada no modelo de preço de fechamento.
Depois de compreendermos os requisitos estratégicos e pensamentos da Mylanguage, podemos começar a deslocar.
Prototipo de estratégia portuária e de conceção
O código do protótipo de estratégia não é muito longo, apenas de 1 a 200 linhas. Para você estudar convenientemente as ideias de escrita de estratégia, escrevo diretamente as observações no código de estratégia.
// parse params, from string to object
var arrParam = JSON.parse(params)
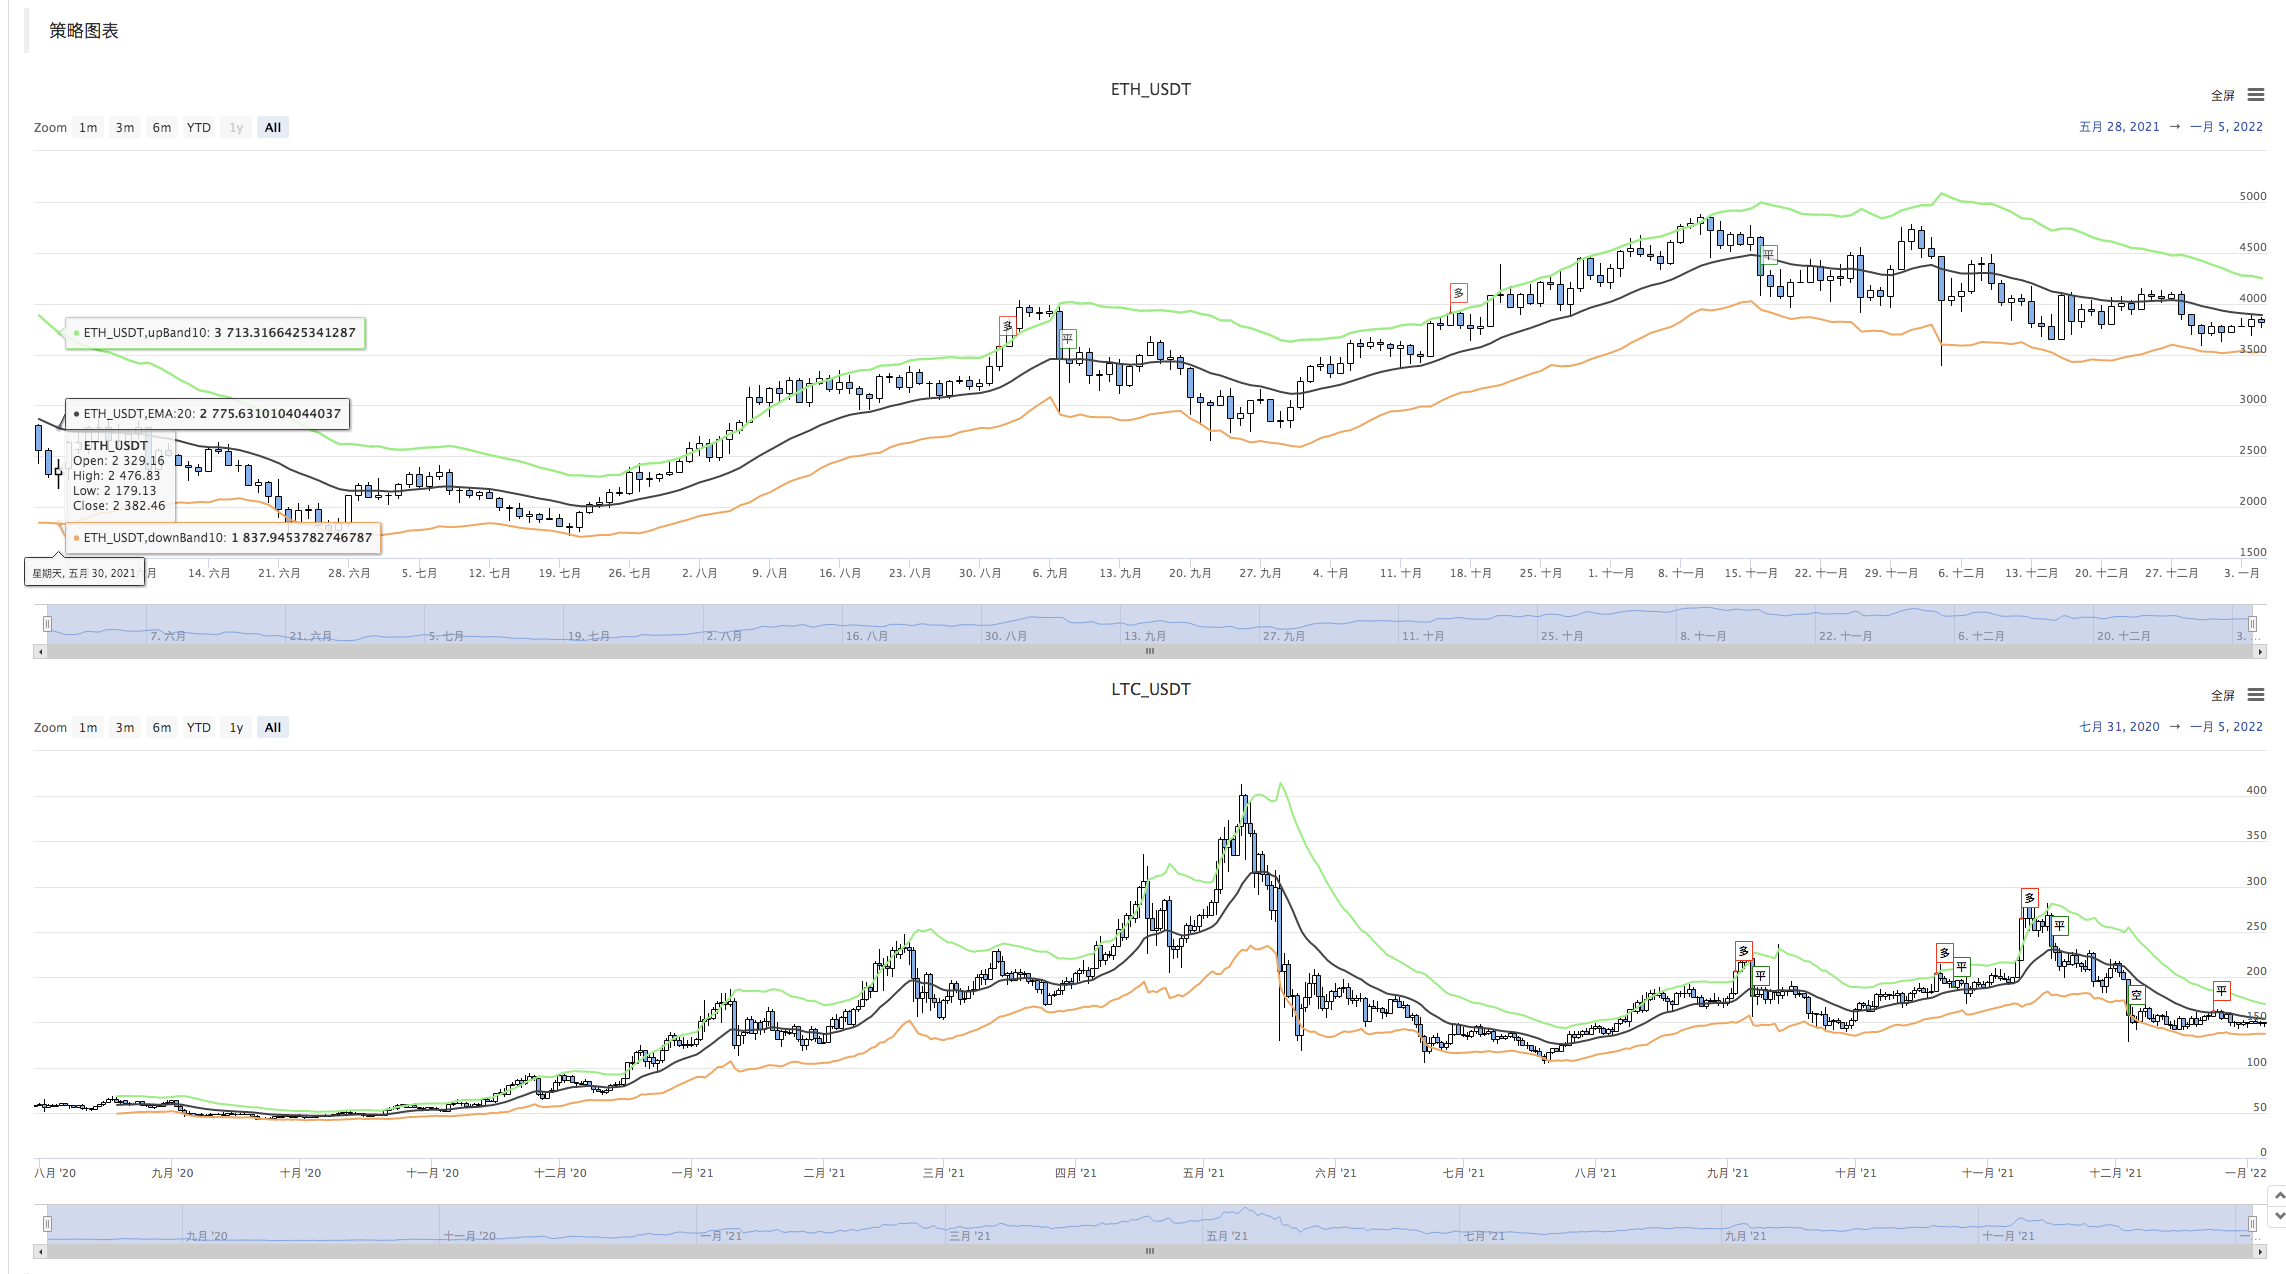
// the function creates the chart configuration
function createChartConfig(symbol, atrPeriod, emaPeriod, index) { // symbol: trading pair; atrPeriod: ATR parameter period; emaPeriod: EMA parameter period; index: index of the corresponding exchange object
var chart = {
__isStock: true,
extension: {
layout: 'single',
height: 600,
},
title : { text : symbol},
xAxis: { type: 'datetime'},
series : [
{
type: 'candlestick', // K-line data series
name: symbol,
id: symbol + "-" + index,
data: []
}, {
type: 'line', // EMA
name: symbol + ',EMA:' + emaPeriod,
data: [],
}, {
type: 'line', // upBand
name: symbol + ',upBand' + atrPeriod,
data: []
}, {
type: 'line', // downBand
name: symbol + ',downBand' + atrPeriod,
data: []
}, {
type: 'flags',
onSeries: symbol + "-" + index,
data: [],
}
]
}
return chart
}
// main logic
function process(e, kIndex, c) { // e is the exchange object, such as exchanges[0] ... ; kIndex is the data series of K-line data in the chart; c is the chart object
// obtain K-line data
var r = e.GetRecords(e.param.period)
if (!r || r.length < e.param.atrPeriod + 2 || r.length < e.param.emaPeriod + 2) {
// if K-line data length is insufficient, return
return
}
// calculate ATR indicator
var atr = TA.ATR(r, e.param.atrPeriod)
var arrAvgPrice = []
_.each(r, function(bar) {
arrAvgPrice.push((bar.High + bar.Low + bar.Close) / 3)
})
// calculate EMA indicator
var midLine = TA.EMA(arrAvgPrice, e.param.emaPeriod)
// calculate upBand and downBand
var upBand = []
var downBand = []
_.each(midLine, function(mid, index) {
if (index < e.param.emaPeriod - 1 || index < e.param.atrPeriod - 1) {
upBand.push(NaN)
downBand.push(NaN)
return
}
upBand.push(mid + e.param.trackRatio * atr[index])
downBand.push(mid - e.param.trackRatio * atr[index])
})
// plot
for (var i = 0 ; i < r.length ; i++) {
if (r[i].Time == e.state.lastBarTime) {
// update
c.add(kIndex, [r[i].Time, r[i].Open, r[i].High, r[i].Low, r[i].Close], -1)
c.add(kIndex + 1, [r[i].Time, midLine[i]], -1)
c.add(kIndex + 2, [r[i].Time, upBand[i]], -1)
c.add(kIndex + 3, [r[i].Time, downBand[i]], -1)
} else if (r[i].Time > e.state.lastBarTime) {
// add
e.state.lastBarTime = r[i].Time
c.add(kIndex, [r[i].Time, r[i].Open, r[i].High, r[i].Low, r[i].Close])
c.add(kIndex + 1, [r[i].Time, midLine[i]])
c.add(kIndex + 2, [r[i].Time, upBand[i]])
c.add(kIndex + 3, [r[i].Time, downBand[i]])
}
}
// detect position
var pos = e.GetPosition()
if (!pos) {
return
}
var holdAmount = 0
var holdPrice = 0
if (pos.length > 1) {
throw "Long and short positions are detected simultaneously!"
} else if (pos.length != 0) {
holdAmount = pos[0].Type == PD_LONG ? pos[0].Amount : -pos[0].Amount
holdPrice = pos[0].Price
}
if (e.state.preBar == -1) {
e.state.preBar = r[r.length - 1].Time
}
// detect signal
if (e.state.preBar != r[r.length - 1].Time) { // close price model
if (holdAmount <= 0 && r[r.length - 3].Close < upBand[upBand.length - 3] && r[r.length - 2].Close > upBand[upBand.length - 2]) { // close price up cross the upBand
if (holdAmount < 0) { // holding short, close position
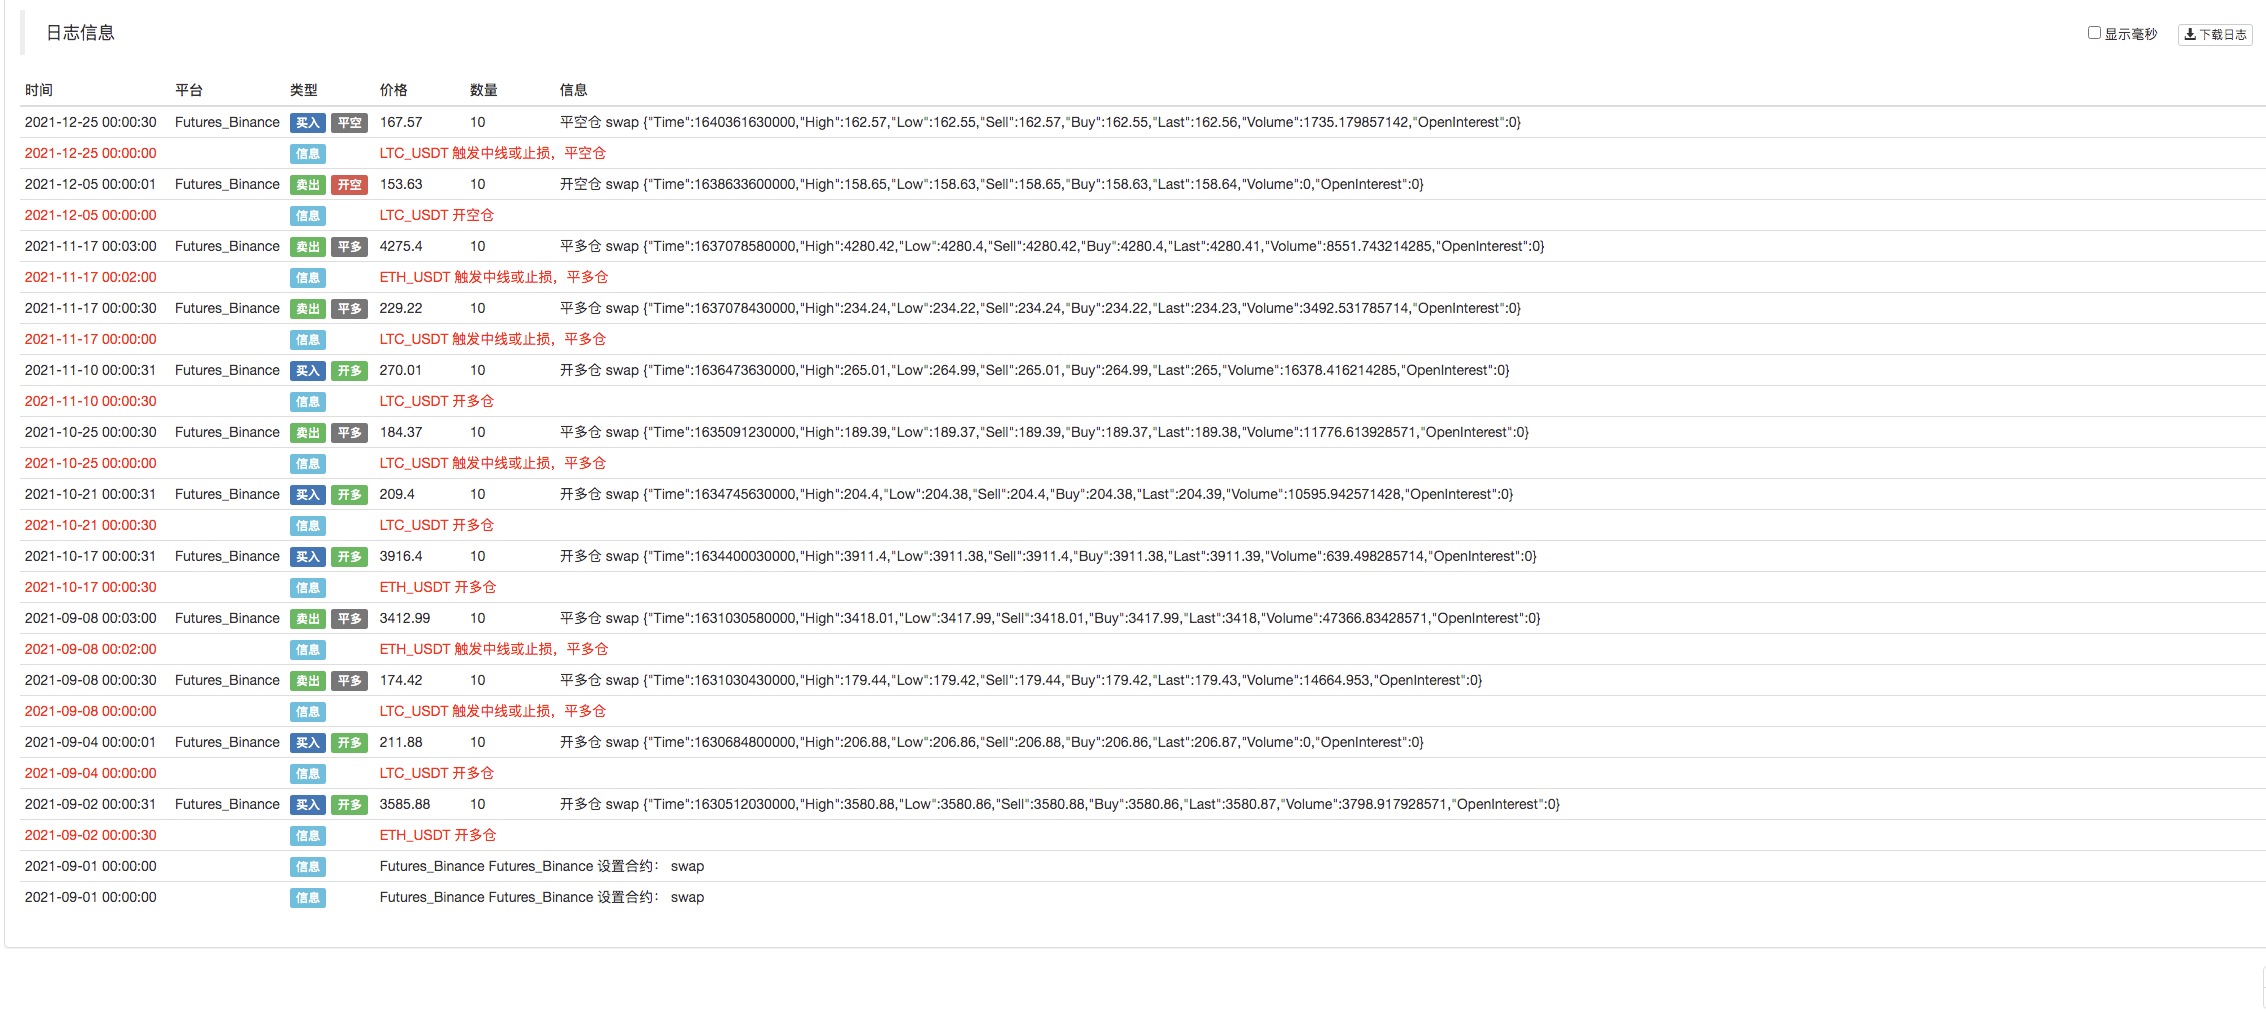
Log(e.GetCurrency(), "close short position", "#FF0000")
$.CoverShort(e, e.param.symbol, Math.abs(holdAmount))
c.add(kIndex + 4, {x: r[r.length - 2].Time, color: 'red', shape: 'flag', title: 'close', text: "close short position"})
}
// open long
Log(e.GetCurrency(), "open long position", "#FF0000")
$.OpenLong(e, e.param.symbol, 10)
c.add(kIndex + 4, {x: r[r.length - 2].Time, color: 'red', shape: 'flag', title: 'long', text: "open long position"})
} else if (holdAmount >= 0 && r[r.length - 3].Close > downBand[downBand.length - 3] && r[r.length - 2].Close < downBand[downBand.length - 2]) { // close price down cross the downBand
if (holdAmount > 0) { // holding long, close position
Log(e.GetCurrency(), "close long position", "#FF0000")
$.CoverLong(e, e.param.symbol, Math.abs(holdAmount))
c.add(kIndex + 4, {x: r[r.length - 2].Time, color: 'green', shape: 'flag', title: 'close', text: "close long position"})
}
// open short
Log(e.GetCurrency(), "open short position", "#FF0000")
$.OpenShort(e, e.param.symbol, 10)
c.add(kIndex + 4, {x: r[r.length - 2].Time, color: 'green', shape: 'flag', title: 'short', text: "open short position"})
} else {
// close position
if (holdAmount > 0 && (r[r.length - 2].Close <= holdPrice * (1 - e.param.stopLoss) || r[r.length - 2].Close <= midLine[midLine.length - 2])) { // if holding long position, close price is equal to or less than midline, stop loss according to open position price
Log(e.GetCurrency(), "if midline is triggered or stop loss, close long position", "#FF0000")
$.CoverLong(e, e.param.symbol, Math.abs(holdAmount))
c.add(kIndex + 4, {x: r[r.length - 2].Time, color: 'green', shape: 'flag', title: 'close', text: "close long position"})
} else if (holdAmount < 0 && (r[r.length - 2].Close >= holdPrice * (1 + e.param.stopLoss) || r[r.length - 2].Close >= midLine[midLine.length - 2])) { // if holding short position, close price is equal to or more than midline, stop loss according to open position price
Log(e.GetCurrency(), "if midline is triggered or stop loss, close short position", "#FF0000")
$.CoverShort(e, e.param.symbol, Math.abs(holdAmount))
c.add(kIndex + 4, {x: r[r.length - 2].Time, color: 'red', shape: 'flag', title: 'close', text: "close short position"})
}
}
e.state.preBar = r[r.length - 1].Time
}
}
function main() {
var arrChartConfig = []
if (arrParam.length != exchanges.length) {
throw "The parameter and the exchange object do not match!"
}
var arrState = _G("arrState")
_.each(exchanges, function(e, index) {
if (e.GetName() != "Futures_Binance") {
throw "The platform is not supported!"
}
e.param = arrParam[index]
e.state = {lastBarTime: 0, symbol: e.param.symbol, currency: e.GetCurrency()}
if (arrState) {
if (arrState[index].symbol == e.param.symbol && arrState[index].currency == e.GetCurrency()) {
Log("Recover:", e.state)
e.state = arrState[index]
} else {
throw "The recovered data and the current setting do not match!"
}
}
e.state.preBar = -1 // initially set -1
e.SetContractType(e.param.symbol)
Log(e.GetName(), e.GetLabel(), "Set contract:", e.param.symbol)
arrChartConfig.push(createChartConfig(e.GetCurrency(), e.param.atrPeriod, e.param.emaPeriod, index))
})
var chart = Chart(arrChartConfig)
chart.reset()
while (true) {
_.each(exchanges, function(e, index) {
process(e, index + index * 4, chart)
Sleep(500)
})
}
}
function onexit() {
// record e.state
var arrState = []
_.each(exchanges, function(e) {
arrState.push(e.state)
})
Log("Record:", arrState)
_G("arrState", arrState)
}
Parâmetros da estratégia:
var params = '[{
        "symbol" : "swap",    // contract code
        "period" : 86400,     // K-line period; 86400 seconds indicates 1 day
        "stopLoss" : 0.07,    // ratio of stoploss; 0.07 means 7%
        "atrPeriod" : 10,     // ATR indicator parameter
        "emaPeriod" : 10,     // EMA indicator parameter
        "trackRatio" : 1,     // ratio of upBand or downBand
        "openRatio" : 0.1     // ratio of reserved open position (temporarily not supported)
    }, {
        "symbol" : "swap",
        "period" : 86400,
        "stopLoss" : 0.07,
        "atrPeriod" : 10,
        "emaPeriod" : 10,
        "trackRatio" : 1,
        "openRatio" : 0.1
    }]'
Teste de retrocesso
Estratégia Código Fonte:https://www.fmz.com/strategy/339344
A estratégia só é usada para comunicação e estudo; para o uso prático, você precisa modificá-la, ajustá-la e otimizá-la por si mesmo.
- A questão do valor facial
- DYdX Exemplo de Design de Estratégia
- Exploração inicial da aplicação do Python Crawler no FMZ
Crawling Binance Anúncio de conteúdo - Pesquisa de conceção de estratégias de cobertura e exemplo de ordens pendentes de spot e futuros
- Situação recente e funcionamento recomendado da estratégia de taxa de financiamento
- Estratégia de ponto de ruptura de média móvel dupla de futuros de criptomoedas (Teaching)
- Estratégia de média móvel dupla de símbolos múltiplos de criptomoeda (Teaching)
- Realização de Fisher Indicator em JavaScript & Plotting em FMZ
- Custódia
- 2021 Revisão do TAQ da criptomoeda e estratégia simples perdida de aumento de 10 vezes
- Atualização!
- A função Getrecords não consegue obter K-string em segundos
- Projeto de sistema de gestão síncrona baseado em ordens FMZ (2)
- Os dados de volume que o Getticker devolveu não estão corretos.
- Projeto do sistema de gestão síncrona baseado em ordens FMZ (1)
- Projetar uma biblioteca de gráficos múltiplos
- Ambientes de disquete
- Código de 60 linhas realizando um pensamento - Pesca de fundo de contrato
- Anúncio de actualização e ajustamento do sistema de faturamento da FMZ
- Aviso para Estratégias de Ghostwriting no FMZ