SAR parabólico
Autora:ChaoZhang, Data: 31 de maio de 2022 19:01Tags:SAR
Este é um redesenho do indicador parabólico SAR incorporado. Eu adicionei um sistema de entrada adequado, uma opção para destacar pontos iniciais para ambas as linhas e uma opção para escolher largura de pontos.
O SAR parabólico foi originalmente desenvolvido por J. Welles Wilder e descrito em seu livro
Para saber quais as configurações para PSAR são os mais rentáveis em seu instrumento e prazo você pode usar esta ferramenta
backtest
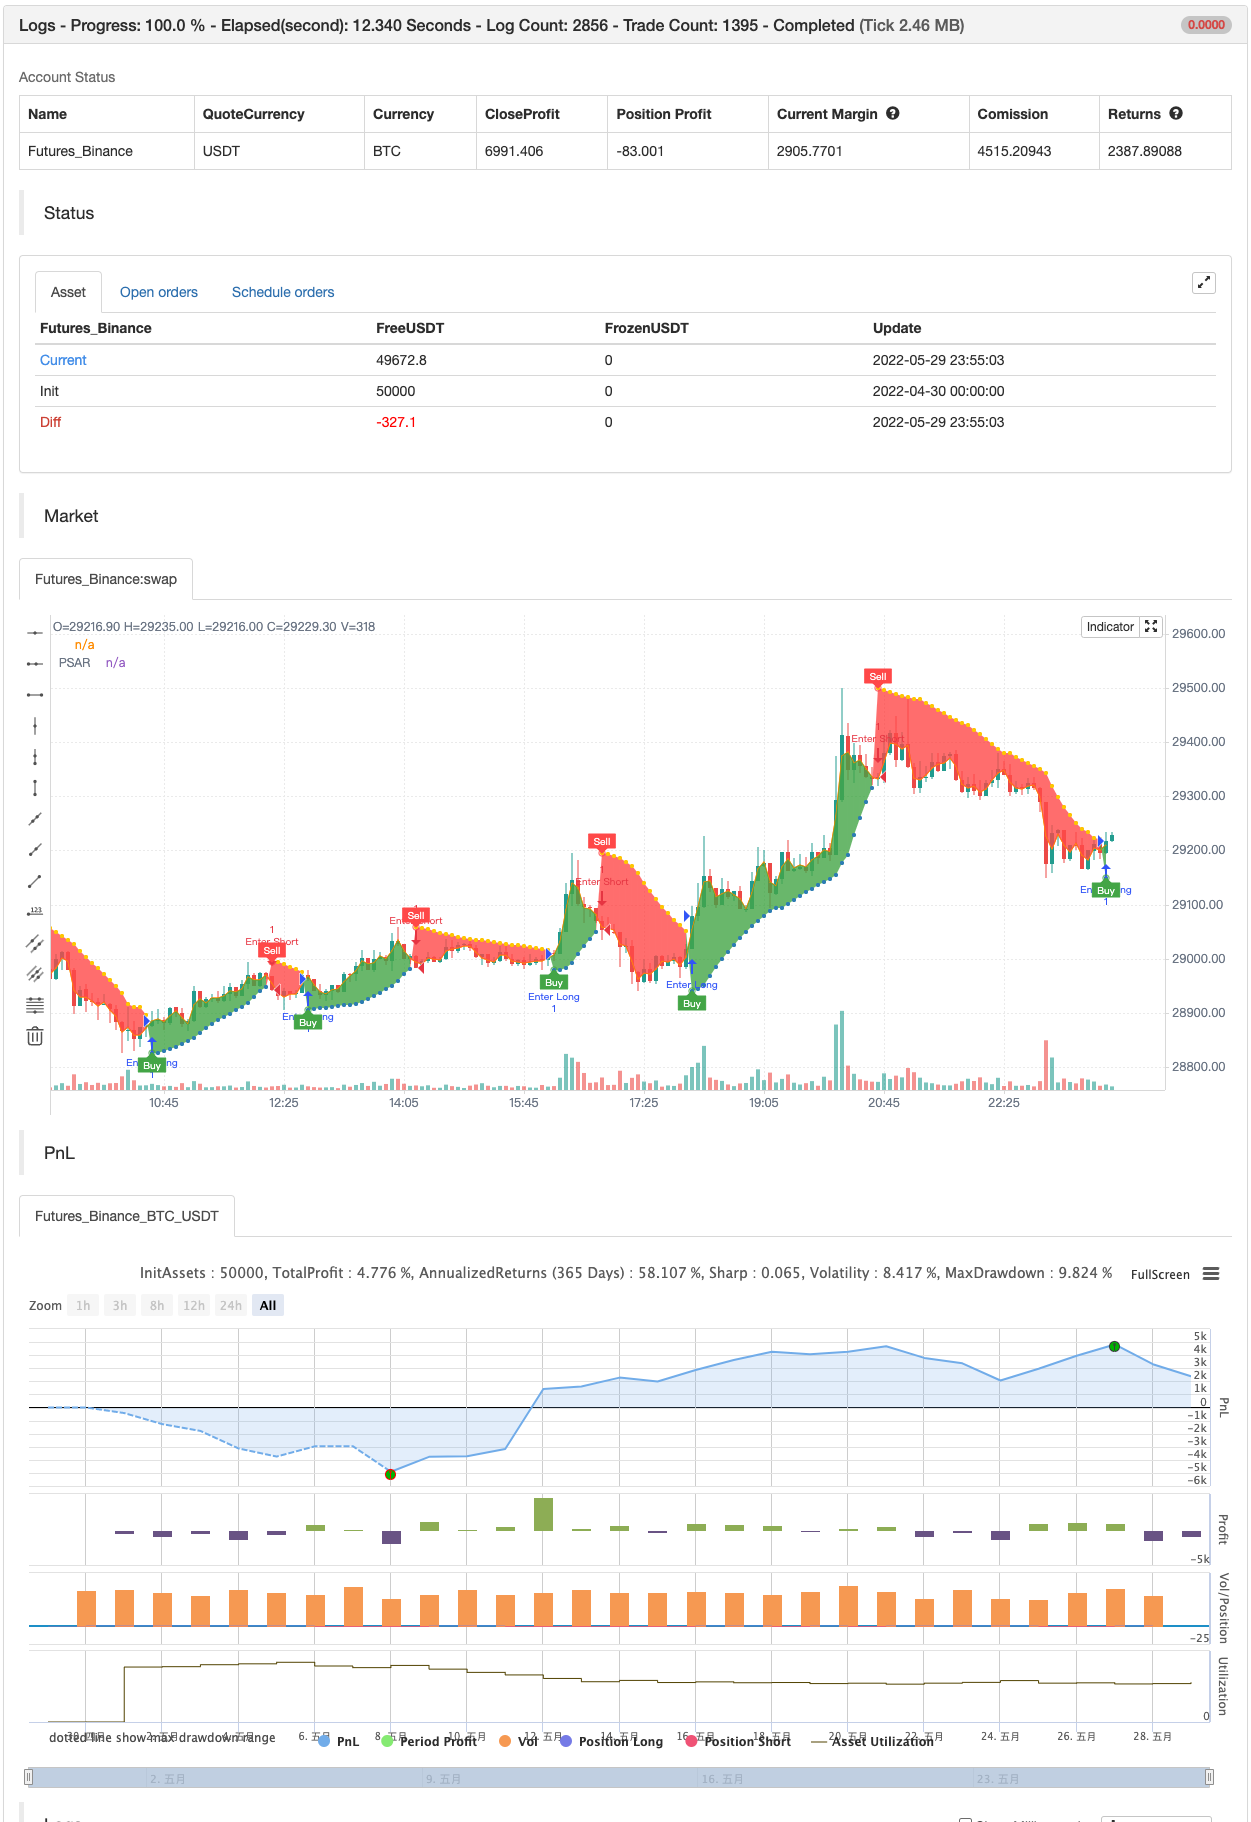
/*backtest
start: 2022-04-30 00:00:00
end: 2022-05-29 23:59:00
period: 5m
basePeriod: 1m
exchanges: [{"eid":"Futures_Binance","currency":"BTC_USDT"}]
*/

//@version=4
// Copyright (c) 2019-present, Alex Orekhov (everget)
// Parabolic SAR script may be freely distributed under the terms of the GPL-3.0 license.
study("Parabolic SAR", shorttitle="PSAR", overlay=true)

start = input(title="Start", type=input.float, step=0.001, defval=0.02)
increment = input(title="Increment", type=input.float, step=0.001, defval=0.02)
maximum = input(title="Maximum", type=input.float, step=0.01, defval=0.2)
width = input(title="Point Width", type=input.integer, minval=1, defval=2)
highlightStartPoints = input(title="Highlight Start Points ?", type=input.bool, defval=true)
showLabels = input(title="Show Buy/Sell Labels ?", type=input.bool, defval=true)
highlightState = input(title="Highlight State ?", type=input.bool, defval=true)

psar = sar(start, increment, maximum)
dir = psar < close ? 1 : -1

psarColor = dir == 1 ? #3388bb : #fdcc02
psarPlot = plot(psar, title="PSAR", style=plot.style_circles, linewidth=width, color=psarColor, transp=0)

var color longColor = color.green
var color shortColor = color.red

buySignal = dir == 1 and dir[1] == -1
plotshape(buySignal and highlightStartPoints ? psar : na, title="Long Start", location=location.absolute, style=shape.circle, size=size.tiny, color=longColor, transp=0)
plotshape(buySignal and showLabels ? psar : na, title="Buy Label", text="Buy", location=location.absolute, style=shape.labelup, size=size.tiny, color=longColor, textcolor=color.white, transp=0)

sellSignal = dir == -1 and dir[1] == 1
plotshape(sellSignal and highlightStartPoints ? psar : na, title="Short Start", location=location.absolute, style=shape.circle, size=size.tiny, color=shortColor, transp=0)
plotshape(sellSignal and showLabels ? psar : na, title="Sell Label", text="Sell", location=location.absolute, style=shape.labeldown, size=size.tiny, color=shortColor, textcolor=color.white, transp=0)

midPricePlot = plot(ohlc4, title="", display=display.none)

fillColor = highlightState ? (dir == 1 ? longColor : shortColor) : na
fill(midPricePlot, psarPlot, title="Trade State Filling", color=fillColor)

changeCond = dir != dir[1]
alertcondition(changeCond, title="Alert: PSAR Direction Change", message="PSAR has changed direction!")
alertcondition(buySignal, title="Alert: PSAR Long", message="PSAR Long")
alertcondition(sellSignal, title="Alert: PSAR Short", message="PSAR Sell")


if buySignal
    strategy.entry("Enter Long", strategy.long)
else if sellSignal
    strategy.entry("Enter Short", strategy.short)
Relacionados
- Teoria da onda de Elliott 4-9 Detecção automática de onda de impulso Estratégia de negociação
- SAR - alto e baixo
- SAR alto SAR baixo
- Parabólica SAR Compra e Venda
- 15 MIN BTCUSDTPERP BOT
Mais.
- TUE ADX/MACD Confluência V1.0
- Filtro de gama dupla
- SAR - alto e baixo
- Sistema de negociação de balanço preciso
- Tendência linear
- Padrão de tempo de Fibonacci
- Caixa Darvas Compra Venda
- Indicador de configuração de demarcação
- Indicador de variação de preços
- Indicador MACD BB V 1.00
- Indicador de divergência do RSI
- Indicador OBV MACD
- Tendência pivô
- Estratégia de divergência de preços v1.0
- Desvio de suporte-resistência
- Média móvel adaptativa de inclinação
- Estratégia do oscilador Delta-RSI
- Estratégia de criptografia Low Scanner
- Estratégia de Etiquetas de Reversão L2.
- SuperB