Фьючерсы на криптовалюты с множественным символом ART-стратегии (обучение)
Автор:Нинабадасс., Создано: 2022-04-07 11:09:42, Обновлено: 2022-04-07 16:15:14Фьючерсы на криптовалюты с множественным символом ART-стратегии (обучение)
В последнее время некоторые пользователи нашей платформы с нетерпением ожидают переноса стратегии Mylanguage в стратегию JavaScript, чтобы можно было гибко добавлять многие идеи оптимизации. Они даже хотят расширить стратегию в многосимвольную версию. Поскольку стратегии Mylanguage обычно являются стратегиями тренда, и многие из них выполняются в модели близкой цены. Эти стратегии не очень часто запрашивают интерфейс API платформы, который более подходит для переноса в многосимвольную версию стратегии. В статье мы берем простую стратегию Mylanguage в качестве примера и переносим ее в простую версию языка JavaScript. Основная цель - обучение, бэкстест и исследование. Если вы хотите запустить стратегию, вам может понадобиться добавить некоторые детали (такие как сумма заказа, точность, размер заказа, контроль за состоянием заказа по активам, соотношение информации и т.д.), а также нужно запустить реальный тест бота.
Стратегия Mylangauge должна быть перенесена
TR:=MAX(MAX((H-L),ABS(REF(C,1)-H)),ABS(REF(C,1)-L));
ATR:=EMA(TR,LENGTH2);

MIDLINE^^EMA((H + L + C)/3,LENGTH1);
UPBAND^^MIDLINE + N*ATR;
DOWNBAND^^MIDLINE - N*ATR;


BKVOL=0 AND C>=UPBAND AND REF(C,1)<REF(UPBAND,1),BPK;
SKVOL=0 AND C<=DOWNBAND AND REF(C,1)>REF(DOWNBAND,1),SPK;

BKVOL>0 AND C<=MIDLINE,SP(BKVOL);
SKVOL>0 AND C>=MIDLINE,BP(SKVOL);
// stop loss
C>=SKPRICE*(1+SLOSS*0.01),BP;
C<=BKPRICE*(1-SLOSS*0.01),SP;
AUTOFILTER;
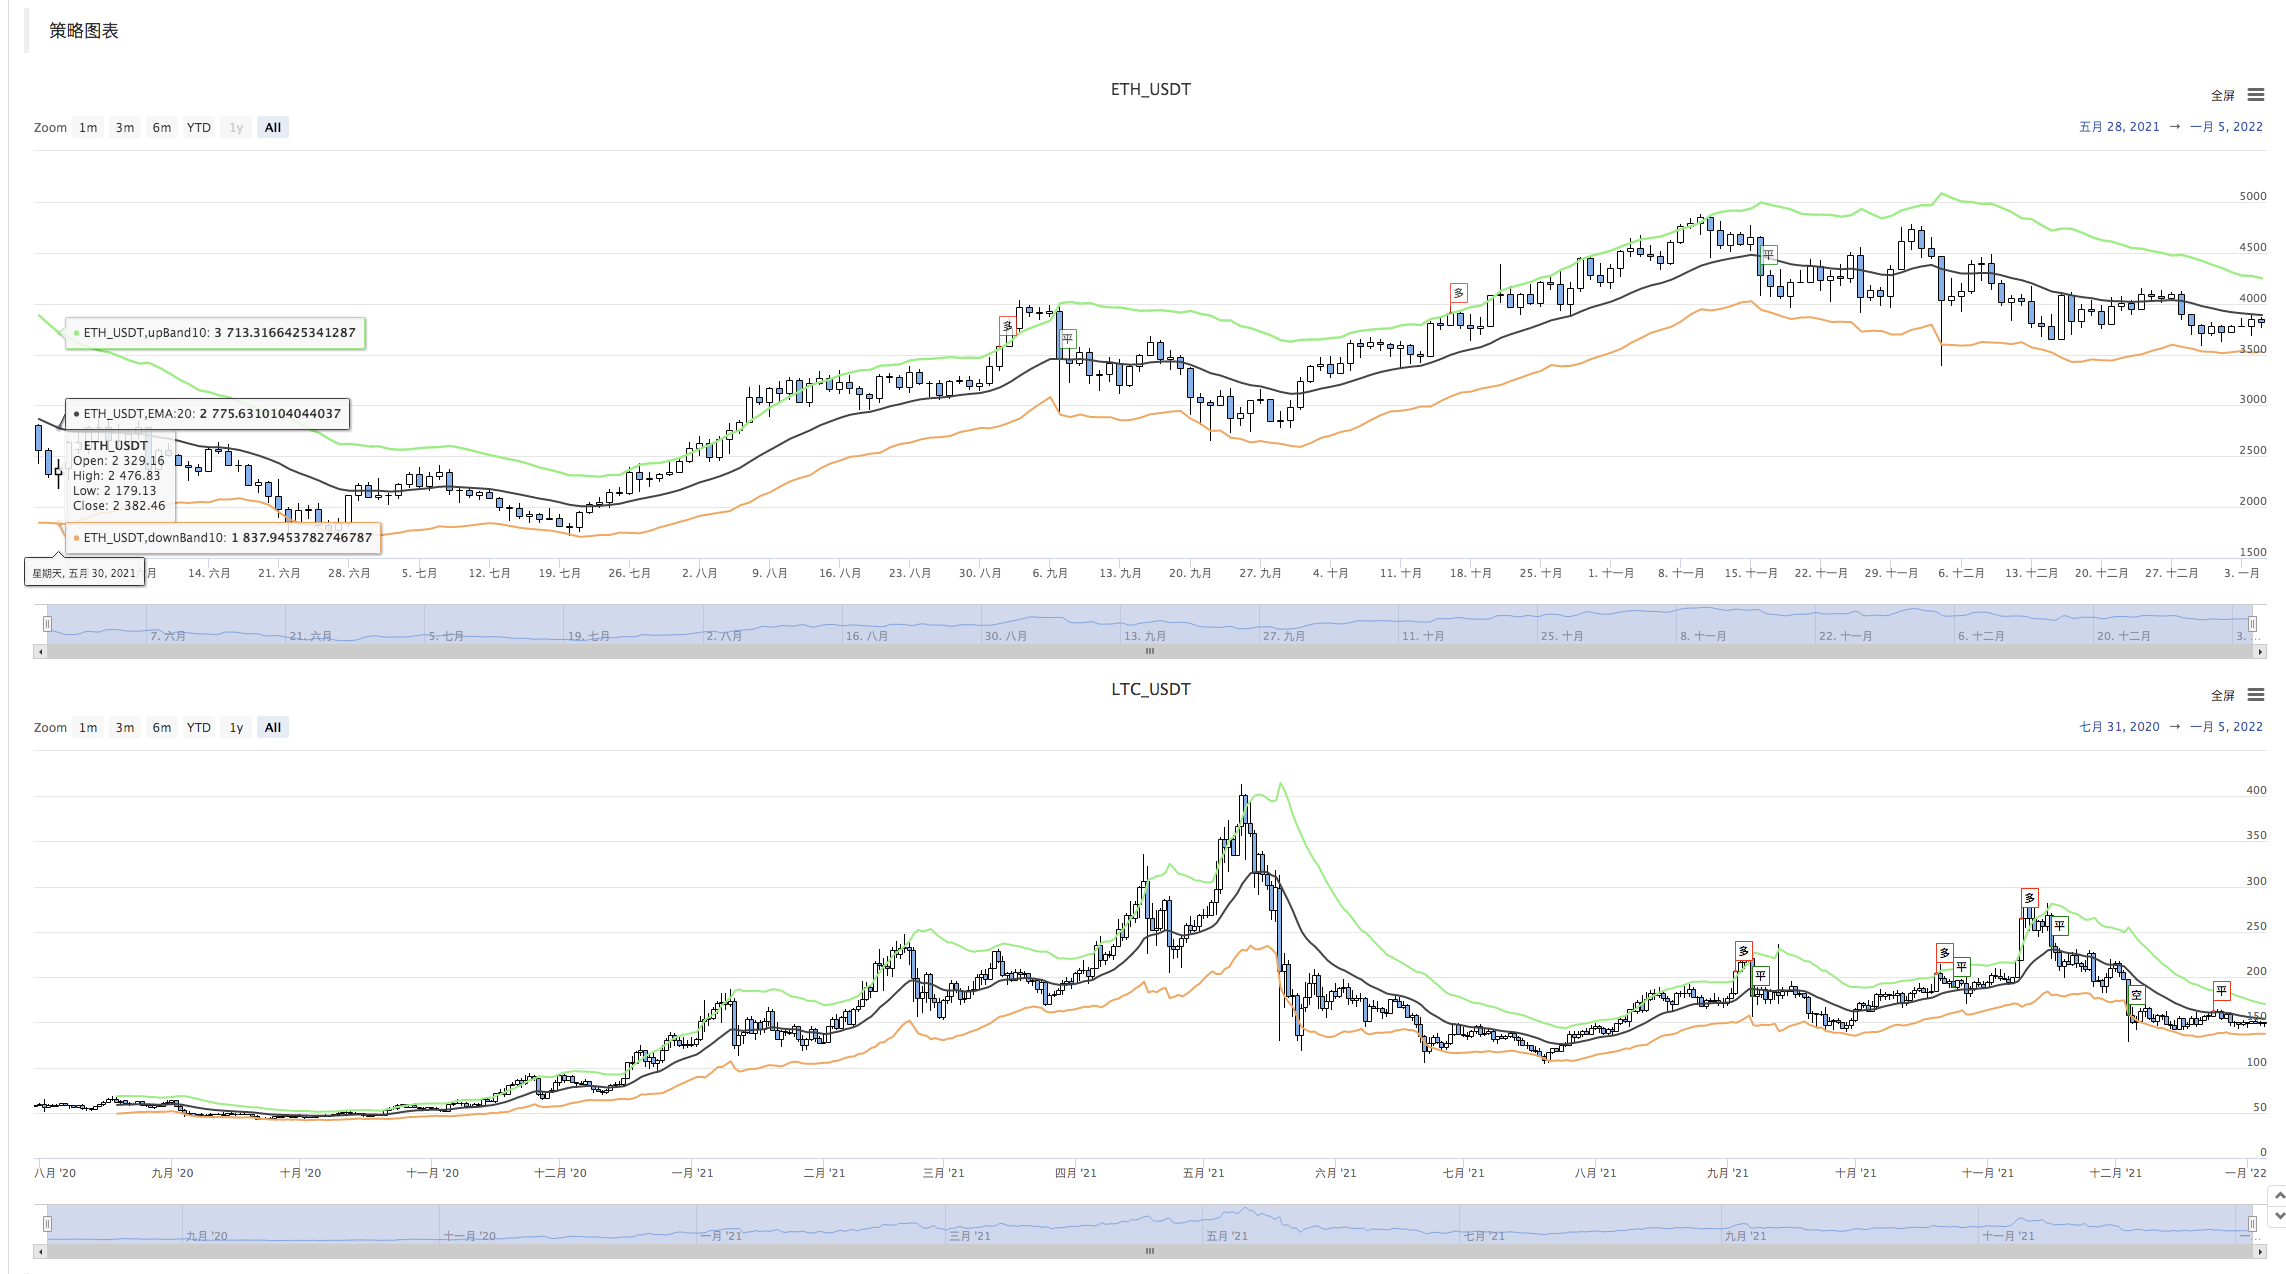
Логика стратегии очень проста. Сначала, согласно параметрам, вычислить ATR, а затем вычислить средние значения наивысшей, самой низкой, закрытой и открытой цены всех K-линейных BAR, по которым будет рассчитан индикатор EMA. Наконец, на основе ATR и соотношения N в параметрах, вычислить upBand и downBand.
Открытая позиция и обратная позиция основаны на цене закрытия, проходящей через upBand и downBand. Когда цена закрытия достигает середины, закрывается позиция; когда цена закрытия достигает цены остановки потери, закрывается позиция (согласно SLOSS для остановки потери; когда SLOSS равен 1, это означает 0,01, а именно 1%). Стратегия выполняется в модели ценового закрытия.
После понимания стратегических требований и мыслей Mylanguage, мы можем начать перевод.
Прототип портовой и проектной стратегии
Код прототипа стратегии не слишком длинный, всего от 1 до 200 строк. Чтобы вы удобно изучали идеи написания стратегии, я прямо записываю замечания в код стратегии.
// parse params, from string to object
var arrParam = JSON.parse(params)
// the function creates the chart configuration
function createChartConfig(symbol, atrPeriod, emaPeriod, index) { // symbol: trading pair; atrPeriod: ATR parameter period; emaPeriod: EMA parameter period; index: index of the corresponding exchange object
var chart = {
__isStock: true,
extension: {
layout: 'single',
height: 600,
},
title : { text : symbol},
xAxis: { type: 'datetime'},
series : [
{
type: 'candlestick', // K-line data series
name: symbol,
id: symbol + "-" + index,
data: []
}, {
type: 'line', // EMA
name: symbol + ',EMA:' + emaPeriod,
data: [],
}, {
type: 'line', // upBand
name: symbol + ',upBand' + atrPeriod,
data: []
}, {
type: 'line', // downBand
name: symbol + ',downBand' + atrPeriod,
data: []
}, {
type: 'flags',
onSeries: symbol + "-" + index,
data: [],
}
]
}
return chart
}
// main logic
function process(e, kIndex, c) { // e is the exchange object, such as exchanges[0] ... ; kIndex is the data series of K-line data in the chart; c is the chart object
// obtain K-line data
var r = e.GetRecords(e.param.period)
if (!r || r.length < e.param.atrPeriod + 2 || r.length < e.param.emaPeriod + 2) {
// if K-line data length is insufficient, return
return
}
// calculate ATR indicator
var atr = TA.ATR(r, e.param.atrPeriod)
var arrAvgPrice = []
_.each(r, function(bar) {
arrAvgPrice.push((bar.High + bar.Low + bar.Close) / 3)
})
// calculate EMA indicator
var midLine = TA.EMA(arrAvgPrice, e.param.emaPeriod)
// calculate upBand and downBand
var upBand = []
var downBand = []
_.each(midLine, function(mid, index) {
if (index < e.param.emaPeriod - 1 || index < e.param.atrPeriod - 1) {
upBand.push(NaN)
downBand.push(NaN)
return
}
upBand.push(mid + e.param.trackRatio * atr[index])
downBand.push(mid - e.param.trackRatio * atr[index])
})
// plot
for (var i = 0 ; i < r.length ; i++) {
if (r[i].Time == e.state.lastBarTime) {
// update
c.add(kIndex, [r[i].Time, r[i].Open, r[i].High, r[i].Low, r[i].Close], -1)
c.add(kIndex + 1, [r[i].Time, midLine[i]], -1)
c.add(kIndex + 2, [r[i].Time, upBand[i]], -1)
c.add(kIndex + 3, [r[i].Time, downBand[i]], -1)
} else if (r[i].Time > e.state.lastBarTime) {
// add
e.state.lastBarTime = r[i].Time
c.add(kIndex, [r[i].Time, r[i].Open, r[i].High, r[i].Low, r[i].Close])
c.add(kIndex + 1, [r[i].Time, midLine[i]])
c.add(kIndex + 2, [r[i].Time, upBand[i]])
c.add(kIndex + 3, [r[i].Time, downBand[i]])
}
}
// detect position
var pos = e.GetPosition()
if (!pos) {
return
}
var holdAmount = 0
var holdPrice = 0
if (pos.length > 1) {
throw "Long and short positions are detected simultaneously!"
} else if (pos.length != 0) {
holdAmount = pos[0].Type == PD_LONG ? pos[0].Amount : -pos[0].Amount
holdPrice = pos[0].Price
}
if (e.state.preBar == -1) {
e.state.preBar = r[r.length - 1].Time
}
// detect signal
if (e.state.preBar != r[r.length - 1].Time) { // close price model
if (holdAmount <= 0 && r[r.length - 3].Close < upBand[upBand.length - 3] && r[r.length - 2].Close > upBand[upBand.length - 2]) { // close price up cross the upBand
if (holdAmount < 0) { // holding short, close position
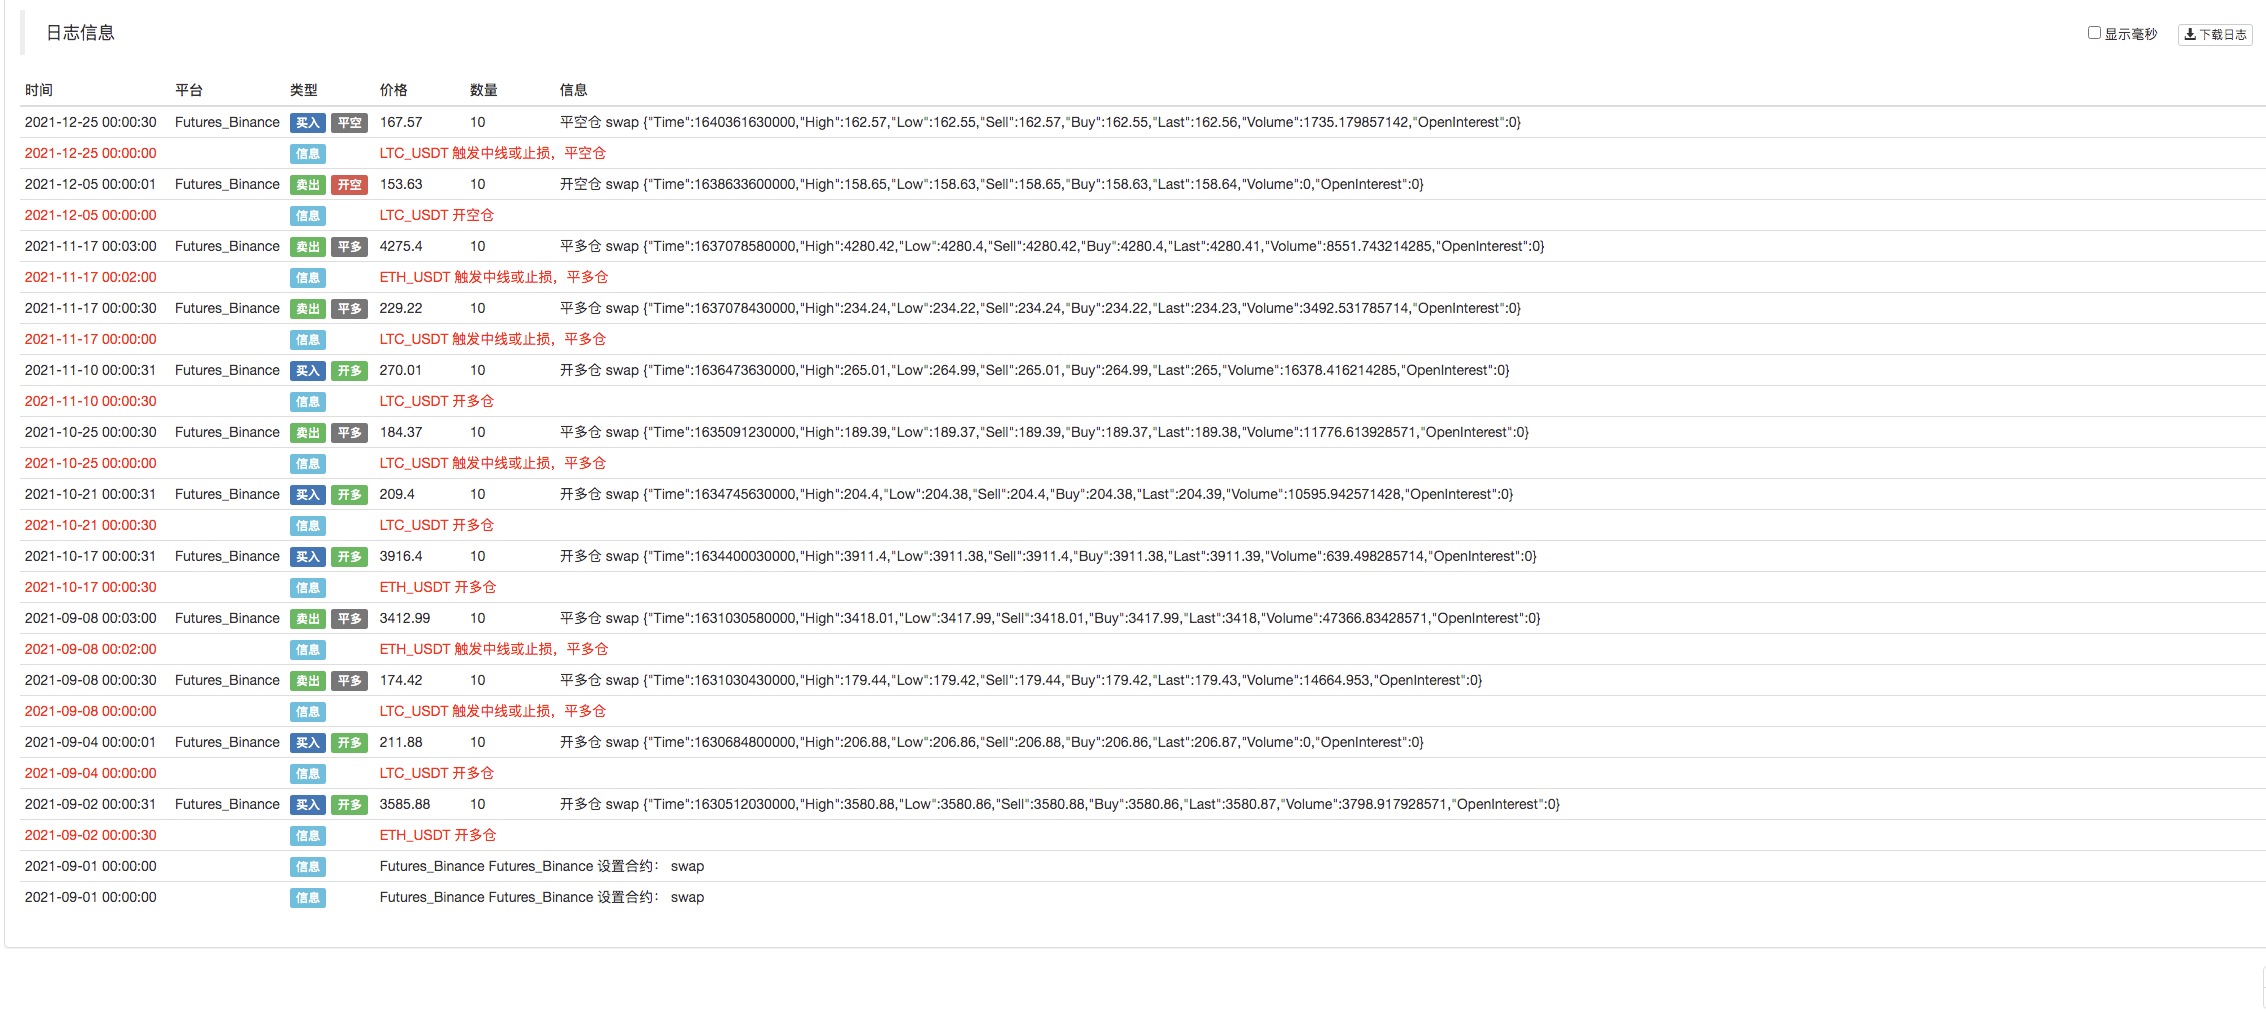
Log(e.GetCurrency(), "close short position", "#FF0000")
$.CoverShort(e, e.param.symbol, Math.abs(holdAmount))
c.add(kIndex + 4, {x: r[r.length - 2].Time, color: 'red', shape: 'flag', title: 'close', text: "close short position"})
}
// open long
Log(e.GetCurrency(), "open long position", "#FF0000")
$.OpenLong(e, e.param.symbol, 10)
c.add(kIndex + 4, {x: r[r.length - 2].Time, color: 'red', shape: 'flag', title: 'long', text: "open long position"})
} else if (holdAmount >= 0 && r[r.length - 3].Close > downBand[downBand.length - 3] && r[r.length - 2].Close < downBand[downBand.length - 2]) { // close price down cross the downBand
if (holdAmount > 0) { // holding long, close position
Log(e.GetCurrency(), "close long position", "#FF0000")
$.CoverLong(e, e.param.symbol, Math.abs(holdAmount))
c.add(kIndex + 4, {x: r[r.length - 2].Time, color: 'green', shape: 'flag', title: 'close', text: "close long position"})
}
// open short
Log(e.GetCurrency(), "open short position", "#FF0000")
$.OpenShort(e, e.param.symbol, 10)
c.add(kIndex + 4, {x: r[r.length - 2].Time, color: 'green', shape: 'flag', title: 'short', text: "open short position"})
} else {
// close position
if (holdAmount > 0 && (r[r.length - 2].Close <= holdPrice * (1 - e.param.stopLoss) || r[r.length - 2].Close <= midLine[midLine.length - 2])) { // if holding long position, close price is equal to or less than midline, stop loss according to open position price
Log(e.GetCurrency(), "if midline is triggered or stop loss, close long position", "#FF0000")
$.CoverLong(e, e.param.symbol, Math.abs(holdAmount))
c.add(kIndex + 4, {x: r[r.length - 2].Time, color: 'green', shape: 'flag', title: 'close', text: "close long position"})
} else if (holdAmount < 0 && (r[r.length - 2].Close >= holdPrice * (1 + e.param.stopLoss) || r[r.length - 2].Close >= midLine[midLine.length - 2])) { // if holding short position, close price is equal to or more than midline, stop loss according to open position price
Log(e.GetCurrency(), "if midline is triggered or stop loss, close short position", "#FF0000")
$.CoverShort(e, e.param.symbol, Math.abs(holdAmount))
c.add(kIndex + 4, {x: r[r.length - 2].Time, color: 'red', shape: 'flag', title: 'close', text: "close short position"})
}
}
e.state.preBar = r[r.length - 1].Time
}
}
function main() {
var arrChartConfig = []
if (arrParam.length != exchanges.length) {
throw "The parameter and the exchange object do not match!"
}
var arrState = _G("arrState")
_.each(exchanges, function(e, index) {
if (e.GetName() != "Futures_Binance") {
throw "The platform is not supported!"
}
e.param = arrParam[index]
e.state = {lastBarTime: 0, symbol: e.param.symbol, currency: e.GetCurrency()}
if (arrState) {
if (arrState[index].symbol == e.param.symbol && arrState[index].currency == e.GetCurrency()) {
Log("Recover:", e.state)
e.state = arrState[index]
} else {
throw "The recovered data and the current setting do not match!"
}
}
e.state.preBar = -1 // initially set -1
e.SetContractType(e.param.symbol)
Log(e.GetName(), e.GetLabel(), "Set contract:", e.param.symbol)
arrChartConfig.push(createChartConfig(e.GetCurrency(), e.param.atrPeriod, e.param.emaPeriod, index))
})
var chart = Chart(arrChartConfig)
chart.reset()
while (true) {
_.each(exchanges, function(e, index) {
process(e, index + index * 4, chart)
Sleep(500)
})
}
}
function onexit() {
// record e.state
var arrState = []
_.each(exchanges, function(e) {
arrState.push(e.state)
})
Log("Record:", arrState)
_G("arrState", arrState)
}
Параметры стратегии:
var params = '[{
        "symbol" : "swap",    // contract code
        "period" : 86400,     // K-line period; 86400 seconds indicates 1 day
        "stopLoss" : 0.07,    // ratio of stoploss; 0.07 means 7%
        "atrPeriod" : 10,     // ATR indicator parameter
        "emaPeriod" : 10,     // EMA indicator parameter
        "trackRatio" : 1,     // ratio of upBand or downBand
        "openRatio" : 0.1     // ratio of reserved open position (temporarily not supported)
    }, {
        "symbol" : "swap",
        "period" : 86400,
        "stopLoss" : 0.07,
        "atrPeriod" : 10,
        "emaPeriod" : 10,
        "trackRatio" : 1,
        "openRatio" : 0.1
    }]'
Обратный тест
Источник стратегии:https://www.fmz.com/strategy/339344
Стратегия используется только для общения и изучения; для практического использования вам нужно модифицировать, корректировать и оптимизировать ее самостоятельно.
- Вопрос о номинале
- Пример проектирования стратегии dYdX
- Первоначальное изучение применения Python Crawler на FMZ
Crawling Binance Содержание объявления - Исследования по разработке стратегии хеджирования и примеры ожидаемых спотовых и фьючерсных ордеров
- Современная ситуация и рекомендуемая стратегия использования ставки финансирования
- Стратегия двойной перемещающейся средней точки прерывания криптовалютных фьючерсов (обучение)
- Стратегия двойной скользящей средней криптовалютной валюты со множественным символом (Teaching)
- Реализация индикатора Фишера в JavaScript и планирование на FMZ
- Хранитель
- 2021 Криптовалютный обзор TAQ и самая простая пропущенная стратегия 10-кратного увеличения
- Фьючерсы на криптовалюты Мартингейл стратегия
- Функция Getrecords не может получить строку K в секундах
- Проектирование системы синхронного управления на основе FMZ (2)
- Данные по объему, возвращенные Getticker, неверны.
- Проектирование системы синхронного управления на основе FMZ (1)
- Проектировать библиотеку с несколькими диаграммами
- Дисковая среда
- Код из 60 строк, реализующий одну мысль - контрактная рыбалка
- Объявление об обновлении и корректировке системы счета FMZ
- Уведомление о стратегии написания на FMZ