پیتھون میں ڈبل تھرو ڈیجیٹل کرنسی کی کوانٹیٹیٹیو ٹریڈنگ کی حکمت عملی کو نافذ کریں
مصنف:لیدیہ, تخلیق: 2023-01-10 17:07:49, تازہ کاری: 2023-09-20 10:53:48
پیتھون میں ڈبل تھرو ڈیجیٹل کرنسی کی کوانٹیٹیٹیو ٹریڈنگ کی حکمت عملی کو نافذ کریں
ڈبل تھروسٹ ٹریڈنگ الگورتھم کا تعارف
ڈبل تھروسٹ ٹریڈنگ الگورتھم مائیکل چیلک کے ذریعہ تیار کردہ ایک مشہور مقداری تجارتی حکمت عملی ہے۔ یہ عام طور پر فیوچر ، غیر ملکی کرنسی اور اسٹاک مارکیٹوں میں استعمال ہوتا ہے۔ ڈبل تھروسٹ کا تصور ایک عام پیش رفت ٹریڈنگ سسٹم ہے۔ یہ تاریخی قیمتوں کی بنیاد پر ایک اپ ڈیٹ شدہ بیک ٹریکنگ مدت بنانے کے لئے
اس مضمون میں ، ہم اس حکمت عملی کی تفصیلی منطقی تفصیلات دیتے ہیں اور یہ ظاہر کرتے ہیں کہ اس الگورتھم کو ایف ایم زیڈ کوانٹ پلیٹ فارم پر کیسے نافذ کیا جائے۔ سب سے پہلے ، ہمیں تجارت کرنے والے موضوع کی تاریخی قیمت کا انتخاب کرنے کی ضرورت ہے۔ یہ حد بند ہونے والی قیمت ، آخری N دنوں کی سب سے زیادہ قیمت اور کم قیمت کی بنیاد پر شمار کی جاتی ہے۔ جب مارکیٹ افتتاحی قیمت سے ایک خاص حد تک چلتی ہے تو ، پوزیشن کھولیں۔
ہم نے اس حکمت عملی کا تجربہ ایک ہی تجارتی جوڑی کے ساتھ دو مشترکہ مارکیٹ کے حالات ، یعنی رجحان مارکیٹ اور جھٹکا مارکیٹ کے تحت کیا۔ نتائج سے پتہ چلتا ہے کہ رجحان مارکیٹ میں رفتار تجارتی نظام بہتر کام کرتا ہے اور یہ اتار چڑھاؤ والے مارکیٹ میں کچھ غلط تجارتی سگنل کو متحرک کرے گا۔ وقفہ مارکیٹ میں ، ہم بہتر منافع حاصل کرنے کے لئے پیرامیٹرز کو ایڈجسٹ کرسکتے ہیں۔ انفرادی ریفرنس ٹریڈنگ اہداف کے مقابلے کے طور پر ، ہم نے گھریلو خام مال فیوچر مارکیٹ کا بھی تجربہ کیا۔ نتیجہ یہ ظاہر ہوا کہ حکمت عملی اوسط کارکردگی سے بہتر ہے۔
ڈی ٹی حکمت عملی کا اصول
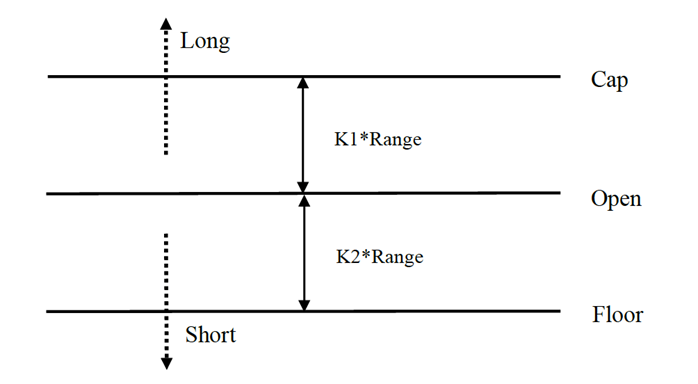
اس کا منطقی پروٹو ٹائپ ایک عام انٹرا ڈے ٹریڈنگ حکمت عملی ہے۔ اوپننگ رینج کی پیشرفت کی حکمت عملی آج کی اوپننگ قیمت کے علاوہ یا منفی کل کی حد کے ایک خاص فیصد پر مبنی ہے تاکہ اوپری اور نچلی پٹریوں کا تعین کیا جاسکے۔ جب قیمت اوپری پٹری کو عبور کرتی ہے تو ، یہ خریدنے کے لئے اپنی پوزیشن کھولے گی ، اور جب یہ نچلی پٹری کو توڑتی ہے تو ، یہ مختصر ہونے کے لئے اپنی پوزیشن کھولے گی۔
حکمت عملی کا اصول
-
بندش کے بعد ، دو اقدار کا حساب لگایا جاتا ہے: سب سے زیادہ قیمت - بندش کی قیمت ، اور بندش کی قیمت - سب سے کم قیمت۔ پھر دونوں اقدار میں سے بڑی قیمت لیں اور قدر کو 0.7 سے ضرب دیں۔ آئیے اسے قدر K کہتے ہیں ، جسے ہم ٹرگر ویلیو کہتے ہیں۔
-
اگلے دن مارکیٹ کھلنے کے بعد، افتتاحی قیمت ریکارڈ کریں، اور قیمت سے زیادہ ہونے پر فوری طور پر خریدیں (افتتاحی قیمت + ٹرگر ویلیو) ، یا جب قیمت (افتتاحی قیمت - ٹرگر ویلیو) سے کم ہو تو مختصر پوزیشنیں فروخت کریں۔
-
اس حکمت عملی میں کوئی واضح اسٹاپ نقصان نہیں ہے۔ یہ نظام ایک الٹا نظام ہے ، یعنی ، اگر قیمت سے زیادہ (افتتاحی قیمت + ٹرگر ویلیو) ہونے پر شارٹ پوزیشن آرڈر ہے تو ، یہ دو خرید آرڈر بھیجے گا (ایک غلط پوزیشن بند کرتا ہے ، دوسرا صحیح پوزیشن کھولتا ہے۔ اسی وجہ سے ، اگر لانگ پوزیشن کی قیمت (افتتاحی قیمت - ٹرگر ویلیو) سے کم ہے تو ، یہ دو فروخت آرڈر بھیجے گا۔
ڈی ٹی حکمت عملی کا ریاضیاتی اظہار
رینج = زیادہ سے زیادہ (HH-LC، HC-LL)
طویل پوزیشن سگنل کا حساب لگانے کا طریقہ یہ ہے:
cap = کھلا + K1 × Rangecap = کھلا + K1 × Range
مختصر پوزیشن سگنل کا حساب لگانے کا طریقہ یہ ہے:
فرش = کھلا
جہاں K1 اور K2 پیرامیٹرز ہیں۔ جب K1 K2 سے بڑا ہوتا ہے تو ، لانگ پوزیشن سگنل ٹرگر ہوتا ہے ، اور اس کے برعکس۔ مظاہرے کے لئے ، ہم K1 = K2 = 0.5 کا انتخاب کرتے ہیں۔ اصل لین دین میں ، ہم ابھی بھی ان پیرامیٹرز کو بہتر بنانے یا مارکیٹ کے رجحانات کے مطابق پیرامیٹرز کو ایڈجسٹ کرنے کے لئے تاریخی اعداد و شمار کا استعمال کرسکتے ہیں۔ اگر آپ تیزی سے ہیں تو ، K1 K2 سے کم ہونا چاہئے۔ اگر آپ bearish ہیں تو ، K1 K2 سے بڑا ہونا چاہئے۔ اگر آپ کو ایک بار پھر ایک بار پھر ایک بار پھر ایک بار پھر ایک بار پھر ایک بار پھر ایک بار پھر ایک بار پھر ایک بار پھر ایک بار پھر ایک بار پھر ایک بار پھر ایک بار پھر ایک بار پھر ایک بار پھر ایک بار پھر ایک بار پھر ایک بار پھر ایک بار پھر ایک بار پھر ایک بار پھر ایک بار پھر ایک بار پھر ایک بار پھر ایک بار پھر ایک بار پھر ایک بار پھر ایک بار پھر ایک بار پھر ایک بار پھر ایک بار پھر ایک بار پھر ایک بار پھر ایک بار پھر ایک بار پھر ایک بار پھر ایک بار پھر ایک بار پھر ایک بار پھر ایک بار پھر
یہ نظام ایک الٹ پلٹ کا نظام ہے۔ لہذا ، اگر سرمایہ کاروں کے پاس مختصر پوزیشنیں ہیں جب قیمت اوپری ٹریک کو عبور کرتی ہے تو ، انہیں لمبی پوزیشن کھولنے سے پہلے مختصر پوزیشنیں بند کرنی چاہئیں۔ اگر کسی سرمایہ کار کے پاس لمبی پوزیشن ہے جب قیمت نیچے ٹریک کو توڑتی ہے تو ، انہیں نئی مختصر پوزیشن کھولنے سے پہلے لمبی پوزیشن بند کرنی چاہئے۔
ڈی ٹی کی حکمت عملی کو بہتر بنانا:
رینج کی ترتیب میں ، پچھلے N دنوں کے چار قیمت پوائنٹس (اعلی ، کھلی ، کم اور بند) کو متعارف کرایا جاتا ہے تاکہ ایک خاص مدت میں رینج نسبتا stable مستحکم ہوجائے ، جسے روزانہ کے رجحان کی پیروی کے لئے لاگو کیا جاسکتا ہے۔
حکمت عملی کی لمبی اور مختصر پوزیشن کھولنے کے ٹرگر شرائط ، اسامریٹری رینج کو مدنظر رکھتے ہوئے ، لمبی اور مختصر لین دین کی ریفرنس رینج کو مختلف تعداد میں ادوار کا انتخاب کرنا چاہئے ، جو پیرامیٹرز K1 اور K2 کے ذریعہ بھی طے کیا جاسکتا ہے۔ جب K1 < K2 ، لمبی پوزیشن کا سگنل نسبتا easy آسان ہے ، جبکہ جب K1 > K2 ، مختصر پوزیشن کا سگنل نسبتا easy آسان ہے۔
لہذا ، اس حکمت عملی کا استعمال کرتے وقت ، ایک طرف ، آپ تاریخی ڈیٹا بیک ٹیسٹنگ کے بہترین پیرامیٹرز کا حوالہ دے سکتے ہیں۔ دوسری طرف ، آپ مستقبل یا دیگر اہم مدت کے تکنیکی اشارے کے اپنے فیصلے کے مطابق مراحل میں K1 اور K2 کو ایڈجسٹ کرسکتے ہیں۔
یہ ایک عام تجارتی طریقہ ہے جس میں سگنلز کا انتظار کرنا، مارکیٹ میں داخل ہونا، ثالثی کرنا، اور پھر مارکیٹ چھوڑنا ہوتا ہے، لیکن اثر بہترین ہوتا ہے۔
ایف ایم زیڈ کوانٹ پلیٹ فارم پر ڈی ٹی حکمت عملی کو تعینات کریں
ہم کھولتے ہیںFMZ.COM، اکاؤنٹ میں لاگ ان کریں، ڈیش بورڈ پر کلک کریں، اور ڈوکر اور روبوٹ تعینات کریں.
براہ کرم میرے پچھلے مضمون کا حوالہ دیں کہ ڈوکر اور روبوٹ کو کیسے تعینات کیا جائے:https://www.fmz.com/bbs-topic/9864.
قارئین جو اپنے ڈاکرز کو تعینات کرنے کے لئے اپنا کلاؤڈ کمپیوٹنگ سرور خریدنا چاہتے ہیں وہ اس مضمون کا حوالہ دے سکتے ہیں:https://www.fmz.com/digest-topic/5711.
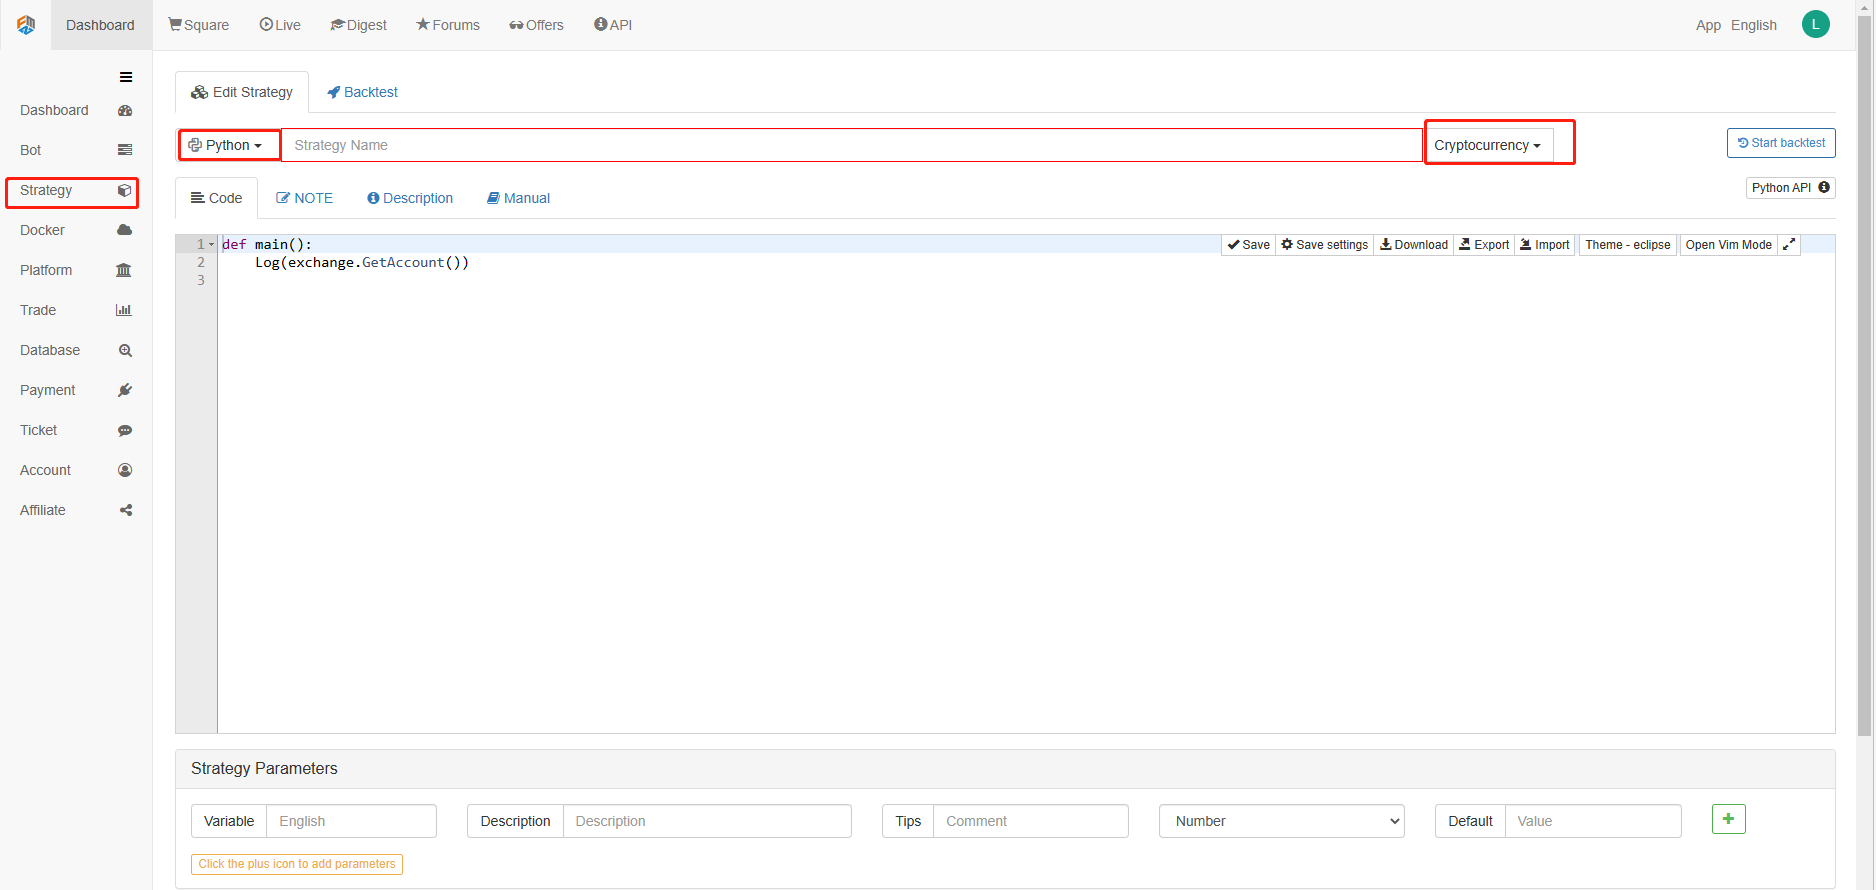
اگلا، ہم بائیں کالم میں حکمت عملی لائبریری پر کلک کریں اور حکمت عملی شامل کریں پر کلک کریں.
حکمت عملی ترمیم کے صفحے کے اوپری دائیں کونے میں پروگرامنگ زبان کے طور پر پائیٹون کو منتخب کرنے کے لئے یاد رکھیں، جیسا کہ شکل میں دکھایا گیا ہے:
اگلا، ہم کوڈ میں ترمیم کے صفحے میں پائیتھون کوڈ لکھیں گے. مندرجہ ذیل کوڈ میں بہت تفصیلی لائن لائن تبصرے ہیں، آپ کو سمجھنے کے لئے اپنا وقت لے سکتے ہیں.
ہم حکمت عملی کی جانچ کرنے کے لئے OKCoin مستقبل کا استعمال کریں گے:
import time # Here we need to introduce the time library that comes with python, which will be used later in the program.

class Error_noSupport(BaseException): # We define a global class named ChartCfg to initialize the strategy chart settings. Object has many attributes about the chart function. Chart library: HighCharts.
    def __init__(self): # log out prompt messages
        Log("Support OKCoin Futures only! #FF0000")

class Error_AtBeginHasPosition(BaseException):
    def __init__(self):
        Log("Start with a futures position! #FF0000")

ChartCfg = {
    '__isStock': True, # This attribute is used to control whether to display a single control data series (you can cancel the display of a single data series on the chart). If you specify __isStock: false, it will be displayed as a normal chart.
    'title': { # title is the main title of the chart
        'text': 'Dual Thrust upper and bottom track chart' # An attribute of the title text is the text of the title, here set to 'Dual Thrust upper and bottom track chart' the text will be displayed in the title position.
    },
    'yAxis': { # Settings related to the Y-axis of the chart coordinate.
        'plotLines': [{ # Horizontal lines on the Y-axis (perpendicular to the Y-axis), the value of this attribute is an array, i.e. the setting of multiple horizontal lines.
            'value': 0, # Coordinate value of horizontal line on Y-axis
            'color': 'red', # Color of horizontal line
            'width': 2, # Line width of horizontal line
            'label': {  # Labels on the horizontal line
                'text': 'Upper track', # Text of the label
                'align': 'center' # The display position of the label, here set to center (i.e.: 'center')
            },
        }, {       # The second horizontal line ([{...} , {...}] the second element in the array)
            'value': 0, # Coordinate value of horizontal line on Y-axis
            'color': 'green', # Color of horizontal line
            'width': 2,  # Line width of horizontal line
            'label': { # Label
                'text': 'bottom track',
                'align': 'center'
            },
        }]
    },
    'series': [{ # Data series, that is, data used to display data lines, K-lines, tags, and other contents on the chart. It is also an array whose first index is 0.
        'type': 'candlestick', # Type of data series with index 0: 'candlestick' indicates a K-line chart.
        'name': 'Current period',  # Name of the data series
        'id': 'primary', # The ID of the data series, which is used for the related settings of the next data series.
        'data': []  # An array of data series to store specific K-line data
    }, {
        'type': 'flags',  # Data series, type: 'flags', display labels on the chart, indicating going long and going short. Index is 1.
        'onSeries': 'primary',  # This attribute indicates that the label is displayed on id 'primary'.
        'data': []    # The array that holds the label data.
    }]
}

STATE_IDLE = 0  # Status constants, indicating idle
STATE_LONG = 1 # Status constants, indicating long positions
STATE_SHORT = 2 # Status constants, indicating short positions
State = STATE_IDLE # Indicates the current program status, assigned as idle initially

LastBarTime = 0  # The time stamp of the last column of the K-line (in milliseconds, 1000 milliseconds is equal to 1 second, and the timestamp is the number of milliseconds from January 1, 1970 to the present time is a large positive integer).
UpTrack = 0   # Upper track value
BottomTrack = 0 # Bottom track value
chart = None # It is used to accept the chart control object returned by the Chart API function. Use this object (chart) to call its member function to write data to the chart.
InitAccount = None # Initial account status
LastAccount = None # Latest account status
Counter = { # Counters for recording profit and loss counts
    'w': 0, # Number of wins
    'l': 0  # Number of losses
}

def GetPosition(posType):  # Define a function to store account position information
    positions = exchange.GetPosition() # exchange.GetPosition() is the FMZ Quant official API. For its usage, please refer to the official API document: https://www.fmz.com/api.
    return [{'Price': position['Price'], 'Amount': position['Amount']} for position in positions if position['Type'] == posType] # Return to various position information

def CancelPendingOrders(): # Define a function specifically for withdrawing orders
    while True: # Loop check
        orders = exchange.GetOrders() # If there is a position
        [exchange.CancelOrder(order['Id']) for order in orders if not Sleep(500)] # Withdrawal statement
        if len(orders) == 0: # Logical judgment
            break

def Trade(currentState,nextState): # Define a function to determine the order placement logic.
    global InitAccount,LastAccount,OpenPrice,ClosePrice # Define the global scope
    ticker = _C(exchange.GetTicker) # For the usage of _C, please refer to: https://www.fmz.com/api.
    slidePrice = 1 # Define the slippage value
    pfn = exchange.Buy if nextState == STATE_LONG else exchange.Sell # Buying and selling judgment logic
    if currentState != STATE_IDLE: # Loop start
        Log(_C(exchange.GetPosition)) # Log information
        exchange.SetDirection("closebuy" if currentState == STATE_LONG else "closesell") # Adjust the order direction, especially after placing the order.
        while True:
            ID = pfn( (ticker['Last'] - slidePrice) if currentState == STATE_LONG else (ticker['Last'] + slidePrice), AmountOP) # Price limit order, ID=pfn (- 1, AmountOP) is the market price order, ID=pfn (AmountOP) is the market price order.
            Sleep(Interval) # Take a break to prevent the API from being accessed too often and your account being blocked.
            Log(exchange.GetOrder(ID)) # Log information
            ClosePrice = (exchange.GetOrder(ID))['AvgPrice'] # Set the closing price
            CancelPendingOrders() # Call the withdrawal function
            if len(GetPosition(PD_LONG if currentState == STATE_LONG else PD_SHORT)) == 0: # Order withdrawal logic
                break
        account = exchange.GetAccount() # Get account information
        if account['Stocks'] > LastAccount['Stocks']: # If the current account currency value is greater than the previous account currency value.
            Counter['w'] += 1 # In the profit and loss counter, add one to the number of profits.
        else:
            Counter['l'] += 1 # Otherwise, add one to the number of losses.
        Log(account) # log information
        LogProfit((account['Stocks'] - InitAccount['Stocks']),"Return rates:", ((account['Stocks'] - InitAccount['Stocks']) * 100 / InitAccount['Stocks']),'%')
        Cal(OpenPrice,ClosePrice)
        LastAccount = account

    exchange.SetDirection("buy" if nextState == STATE_LONG else "sell") # The logic of this part is the same as above and will not be elaborated.
    Log(_C(exchange.GetAccount))
    while True:
        ID = pfn( (ticker['Last'] + slidePrice) if nextState == STATE_LONG else (ticker['Last'] - slidePrice), AmountOP)
        Sleep(Interval)
        Log(exchange.GetOrder(ID))
        CancelPendingOrders()
        pos = GetPosition(PD_LONG if nextState == STATE_LONG else PD_SHORT)
        if len(pos) != 0:
            Log("Average price of positions",pos[0]['Price'],"Amount:",pos[0]['Amount'])
            OpenPrice = (exchange.GetOrder(ID))['AvgPrice']
            Log("now account:",exchange.GetAccount())
            break

def onTick(exchange): # The main function of the program, within which the main logic of the program is processed.
    global LastBarTime,chart,State,UpTrack,DownTrack,LastAccount # Define the global scope
    records = exchange.GetRecords() # For the usage of exchange.GetRecords(), please refer to: https://www.fmz.com/api.
    if not records or len(records) <= NPeriod: # Judgment statements to prevent accidents.
        return
    Bar = records[-1] # Take the penultimate element of records K-line data, that is, the last bar.
    if LastBarTime != Bar['Time']:
        HH = TA.Highest(records, NPeriod, 'High')  # Declare the HH variable, call the TA.Highest function to calculate the maximum value of the highest price in the current K-line data NPeriod period and assign it to HH.
        HC = TA.Highest(records, NPeriod, 'Close') # Declare the HC variable to get the maximum value of the closing price in the NPeriod period.
        LL = TA.Lowest(records, NPeriod, 'Low') # Declare the LL variable to get the minimum value of the lowest price in the NPeriod period.
        LC = TA.Lowest(records, NPeriod, 'Close') # Declare LC variable to get the minimum value of the closing price in the NPeriod period. For specific TA-related applications, please refer to the official API documentation.

        Range = max(HH - LC, HC - LL)  # Calculate the range
        UpTrack = _N(Bar['Open'] + (Ks * Range))  # The upper track value is calculated based on the upper track factor Ks of the interface parameters such as the opening price of the latest K-line bar.
        DownTrack = _N(Bar['Open'] - (Kx * Range)) # Calculate the down track value
        if LastBarTime > 0: # Because the value of LastBarTime initialization is set to 0, LastBarTime>0 must be false when running here for the first time. The code in the if block will not be executed, but the code in the else block will be executed.
            PreBar = records[-2] # Declare a variable means "the previous Bar" assigns the value of the penultimate Bar of the current K-line to it.
            chart.add(0, [PreBar['Time'], PreBar['Open'], PreBar['High'], PreBar['Low'], PreBar['Close']], -1) # Call the add function of the chart icon control class to update the K-line data (use the penultimate bar of the obtained K-line data to update the last bar of the icon, because a new K-line bar is generated).
        else:  # For the specific usage of the chart.add function, see the API documentation and the articles in the forum. When the program runs for the first time, it must execute the code in the else block. The main function is to add all the K-lines obtained for the first time to the chart at one time.
            for i in range(len(records) - min(len(records), NPeriod * 3), len(records)): # Here, a for loop is executed. The number of loops uses the minimum of the K-line length and 3 times the NPeriod, which can ensure that the initial K-line will not be drawn too much and too long. Indexes vary from large to small.
                b = records[i] # Declare a temporary variable b to retrieve the K-line bar data with the index of records.length - i for each loop.
                chart.add(0,[b['Time'], b['Open'], b['High'], b['Low'], b['Close']]) # Call the chart.add function to add a K-line bar to the chart. Note that if the last parameter of the add function is passed in -1, it will update the last Bar (column) on the chart. If no parameter is passed in, it will add Bar to the last. After executing the loop of i=2 (i-- already, now it's 1), it will trigger i > 1 for false to stop the loop. It can be seen that the code here only processes the bar of records.length - 2, and the last Bar is not processed.
        chart.add(0,[Bar['Time'], Bar['Open'], Bar['High'], Bar['Low'], Bar['Close']]) # Since the two branches of the above if do not process the bar of records.length - 1, it is processed here. Add the latest Bar to the chart.
        ChartCfg['yAxis']['plotLines'][0]['value'] = UpTrack  # Assign the calculated upper track value to the chart object (different from the chart control object chart) for later display.
        ChartCfg['yAxis']['plotLines'][1]['value'] = DownTrack # Assign lower track value
        ChartCfg['subtitle'] = { # Set subtitle
            'text': 'upper tarck' + str(UpTrack) + 'down track' + str(DownTrack) # Subtitle text setting. The upper and down track values are displayed on the subtitle.
        }
        chart.update(ChartCfg) # Update charts with chart class ChartCfg.
        chart.reset(PeriodShow) # Refresh the PeriodShow variable set according to the interface parameters, and only keep the K-line bar of the number of PeriodShow values.

        LastBarTime = Bar['Time'] # The timestamp of the newly generated Bar is updated to LastBarTime to determine whether the last Bar of the K-line data acquired in the next loop is a newly generated one.
    else: # If LastBarTime is equal to Bar.Time, that is, no new K-line Bar is generated. Then execute the code in {..}.
        chart.add(0,[Bar['Time'], Bar['Open'], Bar['High'], Bar['Low'], Bar['Close']], -1) # Update the last K-line bar on the chart with the last Bar of the current K-line data (the last Bar of the K-line, i.e. the Bar of the current period, is constantly changing).
    LogStatus("Price:", Bar["Close"], "up:", UpTrack, "down:", DownTrack, "wins:", Counter['w'], "losses:", Counter['l'], "Date:", time.time()) # The LogStatus function is called to display the data of the current strategy on the status bar.
    msg = "" # Define a variable msg.
    if State == STATE_IDLE or State == STATE_SHORT: # Judge whether the current state variable State is equal to idle or whether State is equal to short position. In the idle state, it can trigger long position, and in the short position state, it can trigger a long position to be closed and sell the opening position.
        if Bar['Close'] >= UpTrack: # If the closing price of the current K-line is greater than the upper track value, execute the code in the if block.
            msg = "Go long, trigger price:" + str(Bar['Close']) + "upper track" + str(UpTrack) # Assign a value to msg and combine the values to be displayed into a string.
            Log(msg) # message
            Trade(State, STATE_LONG) # Call the Trade function above to trade.
            State = STATE_LONG # Regardless of opening long positions or selling the opening position, the program status should be updated to hold long positions at the moment.
            chart.add(1,{'x': Bar['Time'], 'color': 'red', 'shape': 'flag', 'title': 'long', 'text': msg}) # Add a marker to the corresponding position of the K-line to show the open long position.

    if State == STATE_IDLE or State == STATE_LONG: # The short direction is the same as the above, and will not be repeated. The code is exactly the same.
        if Bar['Close'] <= DownTrack:
            msg = "Go short, trigger price:" + str(Bar['Close']) + "down track" + str(DownTrack)
            Log(msg)
            Trade(State, STATE_SHORT)
            State = STATE_SHORT
            chart.add(1,{'x': Bar['Time'], 'color': 'green', 'shape': 'circlepin', 'title': 'short', 'text': msg})

OpenPrice = 0 # Initialize OpenPrice and ClosePrice
ClosePrice = 0
def Cal(OpenPrice, ClosePrice): # Define a Cal function to calculate the profit and loss of the strategy after it has been run.
    global AmountOP,State
    if State == STATE_SHORT:
        Log(AmountOP,OpenPrice,ClosePrice,"Profit and loss of the strategy:", (AmountOP * 100) / ClosePrice - (AmountOP * 100) / OpenPrice, "Currencies, service charge:", - (100 * AmountOP * 0.0003), "USD, equivalent to:", _N( - 100 * AmountOP * 0.0003/OpenPrice,8), "Currencies")
        Log(((AmountOP * 100) / ClosePrice - (AmountOP * 100) / OpenPrice) + (- 100 * AmountOP * 0.0003/OpenPrice))
    if State == STATE_LONG:
        Log(AmountOP,OpenPrice,ClosePrice,"Profit and loss of the strategy:", (AmountOP * 100) / OpenPrice - (AmountOP * 100) / ClosePrice, "Currencies, service charge:", - (100 * AmountOP * 0.0003), "USD, equivalent to:", _N( - 100 * AmountOP * 0.0003/OpenPrice,8), "Currencies")
        Log(((AmountOP * 100) / OpenPrice - (AmountOP * 100) / ClosePrice) + (- 100 * AmountOP * 0.0003/OpenPrice))

def main(): # The main function of the strategy program. (entry function)
    global LoopInterval,chart,LastAccount,InitAccount # Define the global scope
    if exchange.GetName() != 'Futures_OKCoin':  # Judge if the name of the added exchange object (obtained by the exchange.GetName function) is not equal to 'Futures_OKCoin', that is, the object added is not OKCoin futures exchange object.
        raise Error_noSupport # Throw an exception
    exchange.SetRate(1) # Set various parameters of the exchange.
    exchange.SetContractType(["this_week","next_week","quarter"][ContractTypeIdx])  # Determine which specific contract to trade.
    exchange.SetMarginLevel([10,20][MarginLevelIdx]) # Set the margin rate, also known as leverage.

    if len(exchange.GetPosition()) > 0: # Set up fault tolerance mechanism.
        raise Error_AtBeginHasPosition
    CancelPendingOrders()
    InitAccount = LastAccount = exchange.GetAccount()
    LoopInterval = min(1,LoopInterval)
    Log("Trading platforms:",exchange.GetName(), InitAccount)
    LogStatus("Ready...")

    LogProfitReset()
    chart = Chart(ChartCfg)
    chart.reset()

    LoopInterval = max(LoopInterval, 1)
    while True: # Loop the whole transaction logic and call the onTick function.
        onTick(exchange)
        Sleep(LoopInterval * 1000) # Take a break to prevent the API from being accessed too frequently and the account from being blocked.
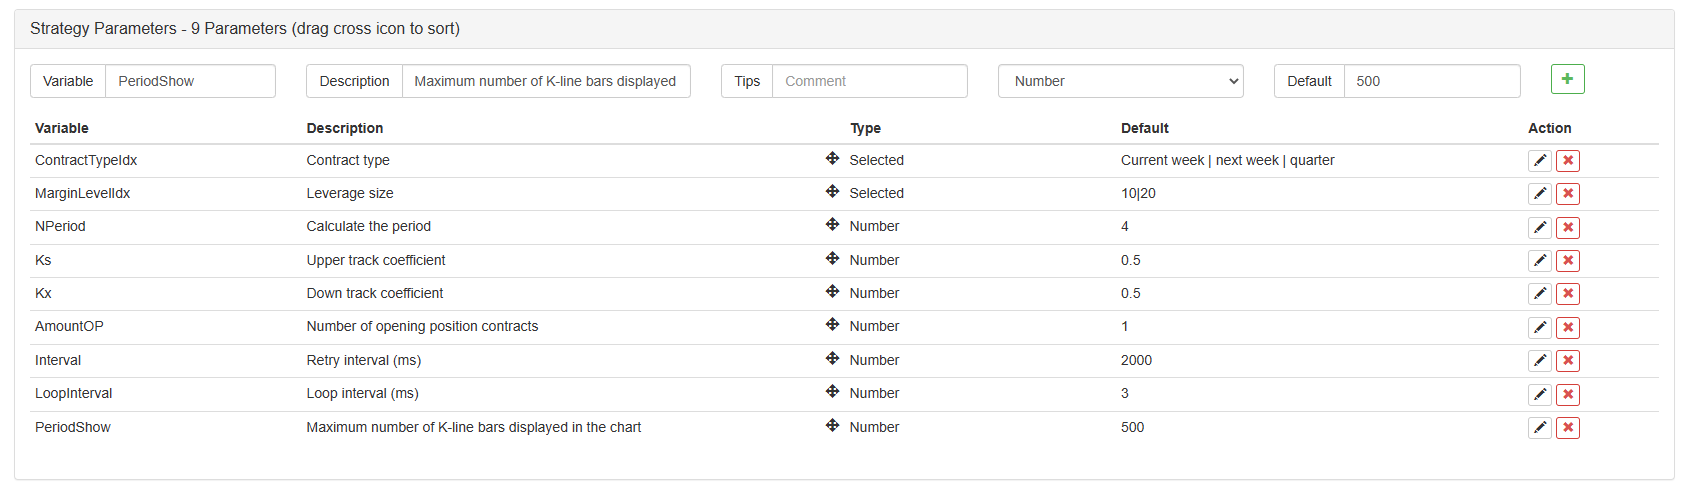
کوڈ لکھنے کے بعد ، براہ کرم نوٹ کریں کہ ہم نے پوری حکمت عملی مکمل نہیں کی ہے۔ اگلا ، ہمیں حکمت عملی میں استعمال ہونے والے پیرامیٹرز کو حکمت عملی میں ترمیم کرنے والے صفحے پر شامل کرنے کی ضرورت ہے۔ شامل کرنے کا طریقہ بہت آسان ہے۔ صرف ایک ایک کرکے شامل کرنے کے لئے حکمت عملی لکھنے کے ڈائیلاگ باکس کے نیچے پلس علامت پر کلک کریں۔
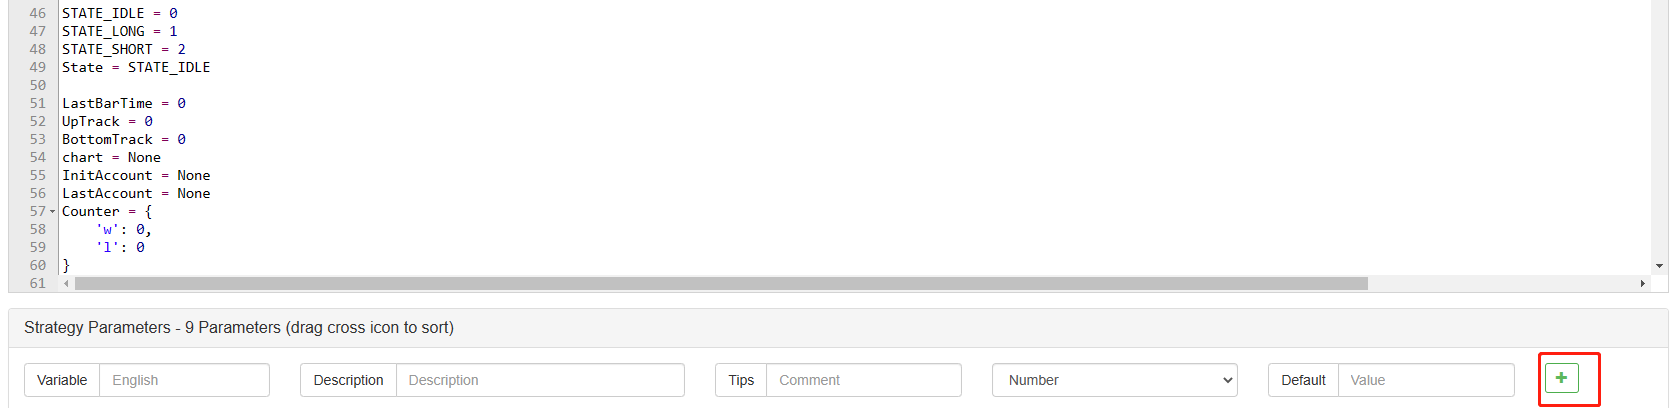
شامل کرنے کے لئے مواد:
اب تک ، ہم نے آخر کار حکمت عملی کی تحریر مکمل کرلی ہے۔ اگلا ، آئیے اس حکمت عملی کا بیک ٹیسٹ شروع کریں۔
حکمت عملی بیک ٹسٹنگ
حکمت عملی لکھنے کے بعد ، سب سے پہلے ہمیں یہ دیکھنے کے لئے بیک ٹیسٹ کرنے کی ضرورت ہے کہ یہ تاریخی اعداد و شمار میں کس طرح برتاؤ کرتا ہے۔ لیکن براہ کرم نوٹ کریں کہ بیک ٹیسٹ کا نتیجہ مستقبل کی پیش گوئی کے برابر نہیں ہے۔ بیک ٹیسٹ صرف ہماری حکمت عملی کی تاثیر پر غور کرنے کے لئے ایک حوالہ کے طور پر استعمال کیا جاسکتا ہے۔ ایک بار جب مارکیٹ بدل جاتی ہے اور حکمت عملی میں بڑے نقصانات آنا شروع ہوجاتے ہیں تو ، ہمیں وقت پر مسئلہ تلاش کرنا چاہئے ، اور پھر حکمت عملی کو نئے مارکیٹ ماحول ، جیسے کہ اوپر بیان کردہ حد تک اپنانے کے ل change تبدیل کرنا چاہئے۔ اگر حکمت عملی میں 10٪ سے زیادہ نقصان ہوتا ہے تو ، ہمیں فوری طور پر حکمت عملی کے آپریشن کو روکنا چاہئے ، اور پھر مسئلہ تلاش کرنا چاہئے۔ ہم حد کو ایڈجسٹ کرنے سے شروع کرسکتے ہیں۔
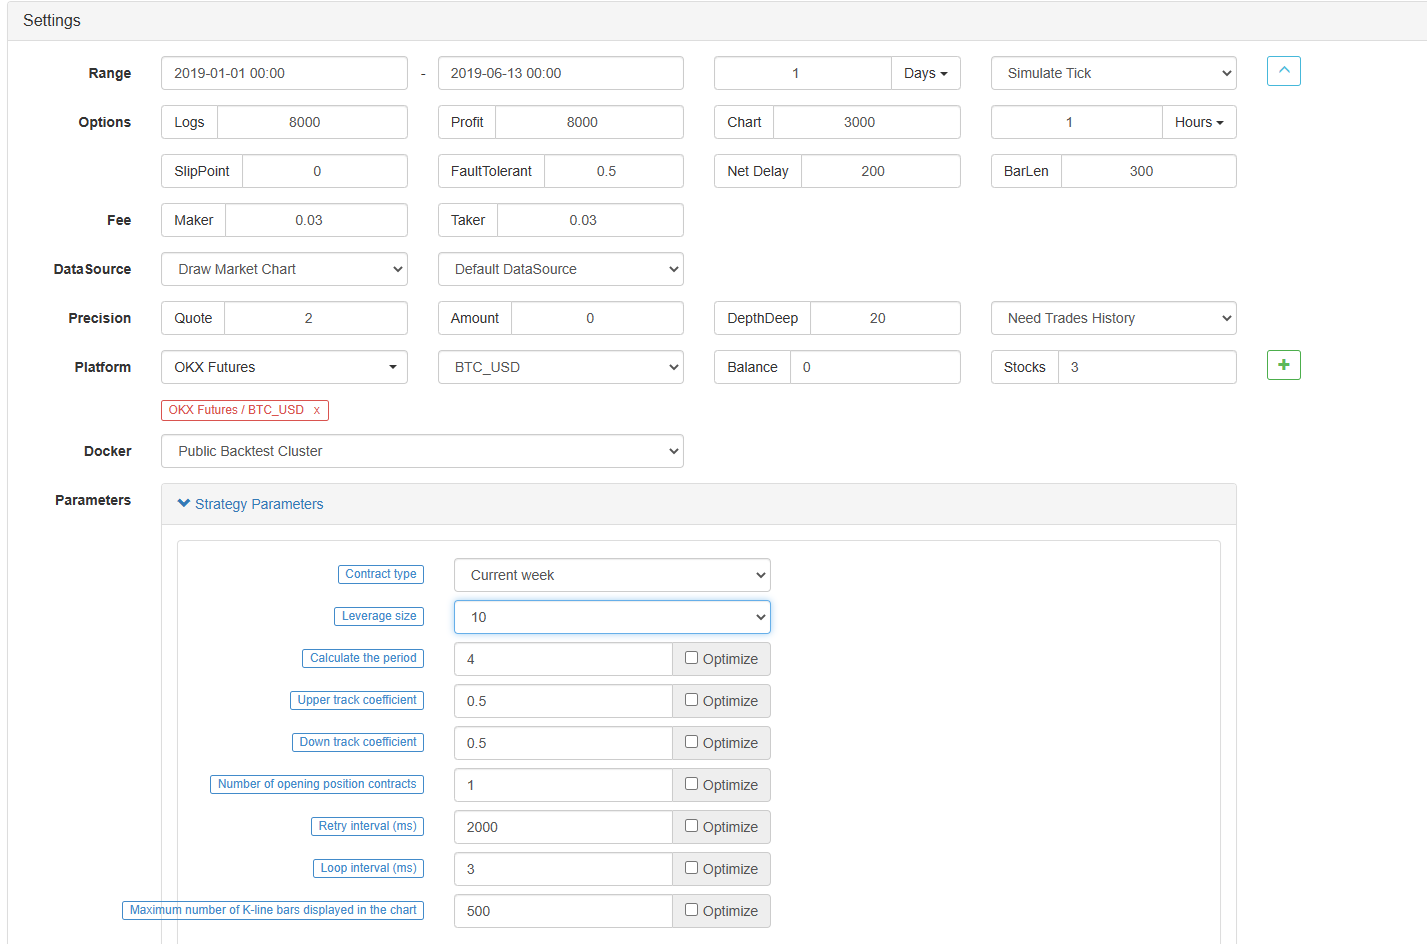
حکمت عملی میں ترمیم کے صفحے پر بیک ٹیسٹ پر کلک کریں۔ بیک ٹیسٹ کے صفحے پر ، پیرامیٹرز کی ایڈجسٹمنٹ کو مختلف ضروریات کے مطابق آسانی سے اور جلدی سے کیا جاسکتا ہے۔ خاص طور پر پیچیدہ منطق اور بہت سارے پیرامیٹرز والی حکمت عملی کے لئے ، سورس کوڈ میں واپس جانے اور اسے ایک ایک کرکے تبدیل کرنے کی ضرورت نہیں ہے۔
بیک ٹیسٹ کا وقت آخری چھ ماہ ہے۔ OKCoin فیوچر ایکسچینج شامل کریں پر کلک کریں اور بی ٹی سی ٹریڈنگ ہدف کو منتخب کریں۔
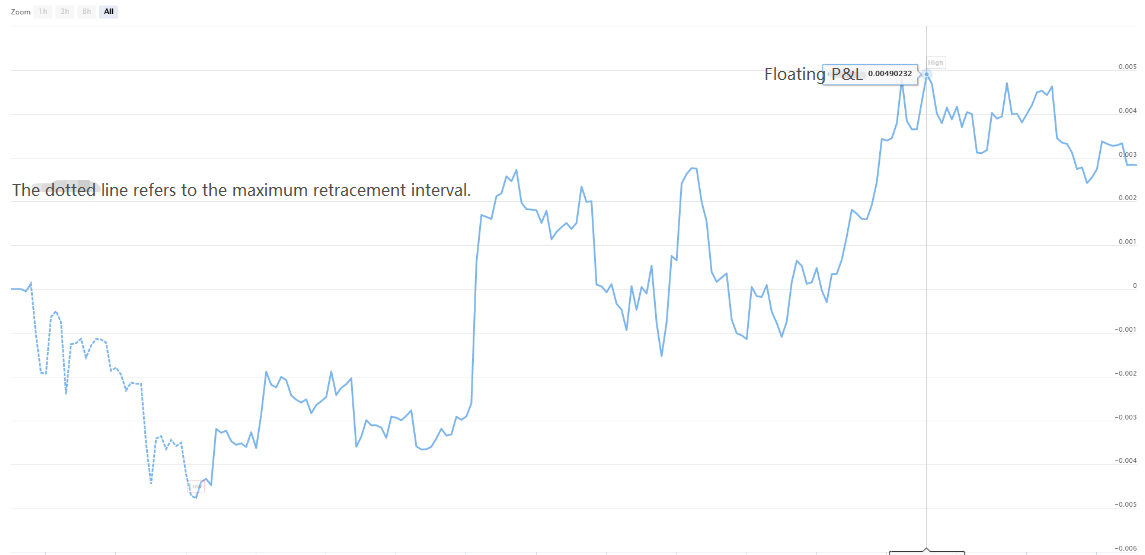
یہ دیکھا جاسکتا ہے کہ بی ٹی سی کے بہت اچھے یکطرفہ رجحان کی وجہ سے اس حکمت عملی نے پچھلے چھ ماہ میں اچھی واپسی حاصل کی ہے۔

اگر آپ کے پاس کوئی سوالات ہیں تو، آپ کو ایک پیغام چھوڑ سکتے ہیںhttps://www.fmz.com/bbs، چاہے یہ پلیٹ فارم کی حکمت عملی یا ٹیکنالوجی کے بارے میں ہو، ایف ایم زیڈ کوانٹ پلیٹ فارم میں آپ کے سوالات کے جوابات دینے کے لئے تیار پیشہ ور افراد موجود ہیں۔
- کریپٹوکرنسی مارکیٹ میں بنیادی تجزیہ کی مقدار: اعداد و شمار کو اپنے لئے بولنے دیں!
- ایک بار پھر ، ہم نے ایک بار پھر اس بات کا یقین کرلیا ہے کہ یہ ایک بہت بڑا مسئلہ ہے ، لیکن ہم اس کے بارے میں مزید نہیں جانتے ہیں۔
- کوانٹائزڈ ٹرانزیکشنز کے لیے ایک لازمی ٹول۔
- ہر چیز پر قابو پانا - ایف ایم زیڈ ٹریڈنگ ٹرمینل کا نیا ورژن (ٹی آر بی آربیٹریج سورس کوڈ کے ساتھ) کا تعارف
- FMZ کے نئے ورژن کے ٹرانزیکشن ٹرمینل کے بارے میں سب کچھ جاننے کے لئے یہاں کلک کریں
- ایف ایم زیڈ کوانٹ: کریپٹوکرنسی مارکیٹ میں مشترکہ تقاضوں کے ڈیزائن مثالوں کا تجزیہ (II)
- 80 لائنوں کے کوڈ میں ہائی فریکوئینسی حکمت عملی کے ساتھ دماغ کے بغیر سیلز بوٹس کا استحصال کیسے کریں
- ایف ایم زیڈ کیوٹیفیکیشن: کریپٹوکرنسی مارکیٹ میں عام ضروریات کے ڈیزائن کی مثالوں کا تجزیہ (ب)
- 80 لائنوں کے کوڈ کے ساتھ ہائی فریکوئینسی کی حکمت عملی کے ساتھ فروخت کے لیے بے دماغ روبوٹ کا استحصال کیسے کیا گیا؟
- ایف ایم زیڈ کوانٹ: کریپٹوکرنسی مارکیٹ میں مشترکہ تقاضوں کے ڈیزائن مثالوں کا تجزیہ (I)
- ایف ایم زیڈ کیوٹیفیکیشن: کریپٹوکرنسی مارکیٹ میں عام ضروریات کے ڈیزائن کی مثالوں کا تجزیہ (1)