لکیری رجسٹریشن ++
مصنف:چاؤ ژانگ، تاریخ: 2022-05-24 14:17:42ٹیگز:ڈی ای وی
عوامی طلب
لکیری رجعت کا فارمولا انتباہات کے ساتھ سکریپڈ حساب کتاب
یہاں ٹریڈرز کے لئے لکیری رجسٹریشن اسکرپٹ ہے جو امیر خصوصیات سے محبت کرتے ہیں
خصوصیات ++ ملٹی ٹائم فریم -> ایک مختلف چارٹ سے ماخذ رجسٹریشن ++ اپنی مرضی کے مطابق رنگ -> یہ پین لائنز بھی شامل ہے ++ ہموار -> فلٹر شدہ رجسٹریشن کی اجازت دیں؛ نوٹ: 1 کا استعمال کرتے ہوئے اصل لائن پر ڈیفالٹس۔ ڈیفالٹ 1 ہے ++ چینل / رینج کراسنگ پر انتباہات
استعمال ++ بریک آؤٹ اور ریورسز کے لئے اس کا استعمال کریں ++ اس اسکرپٹ کو آزادانہ طور پر استعمال نہیں کیا جانا چاہئے
خطرات براہ کرم نوٹ کریں، یہ اسکرپٹ بولنگر بینڈ کی طرح ہے اور رجحان کی حد میں گرنے کا خطرہ ہے۔ سگنل اسی سمت میں چلتے رہ سکتے ہیں جبکہ مارکیٹ الٹ رہی ہے۔
درخواستیں اگر آپ کے پاس کوئی خصوصیت کی درخواست ہے تو، ذیل میں تبصرہ کریں یا مجھے ڈی ایم کریں. اپنے چارٹ پر اس کا استعمال کرنے اور اپنے خیالات کا اشتراک کرنے کے لئے آزاد محسوس کرتے ہیں
ڈویلپرز جو ان کے چارٹ پر اس کا استعمال کرنا چاہتے ہیں کے لئے، اس اسکرپٹ کا استعمال کریں حساب کے لئے اصل فارمولا وہاں پوسٹ کیا جاتا ہے
❤❤❤ امید ہے کہ آپ کو یہ پسند آئے گا۔ میرے دل سے! ❤❤❤
بیک ٹسٹ
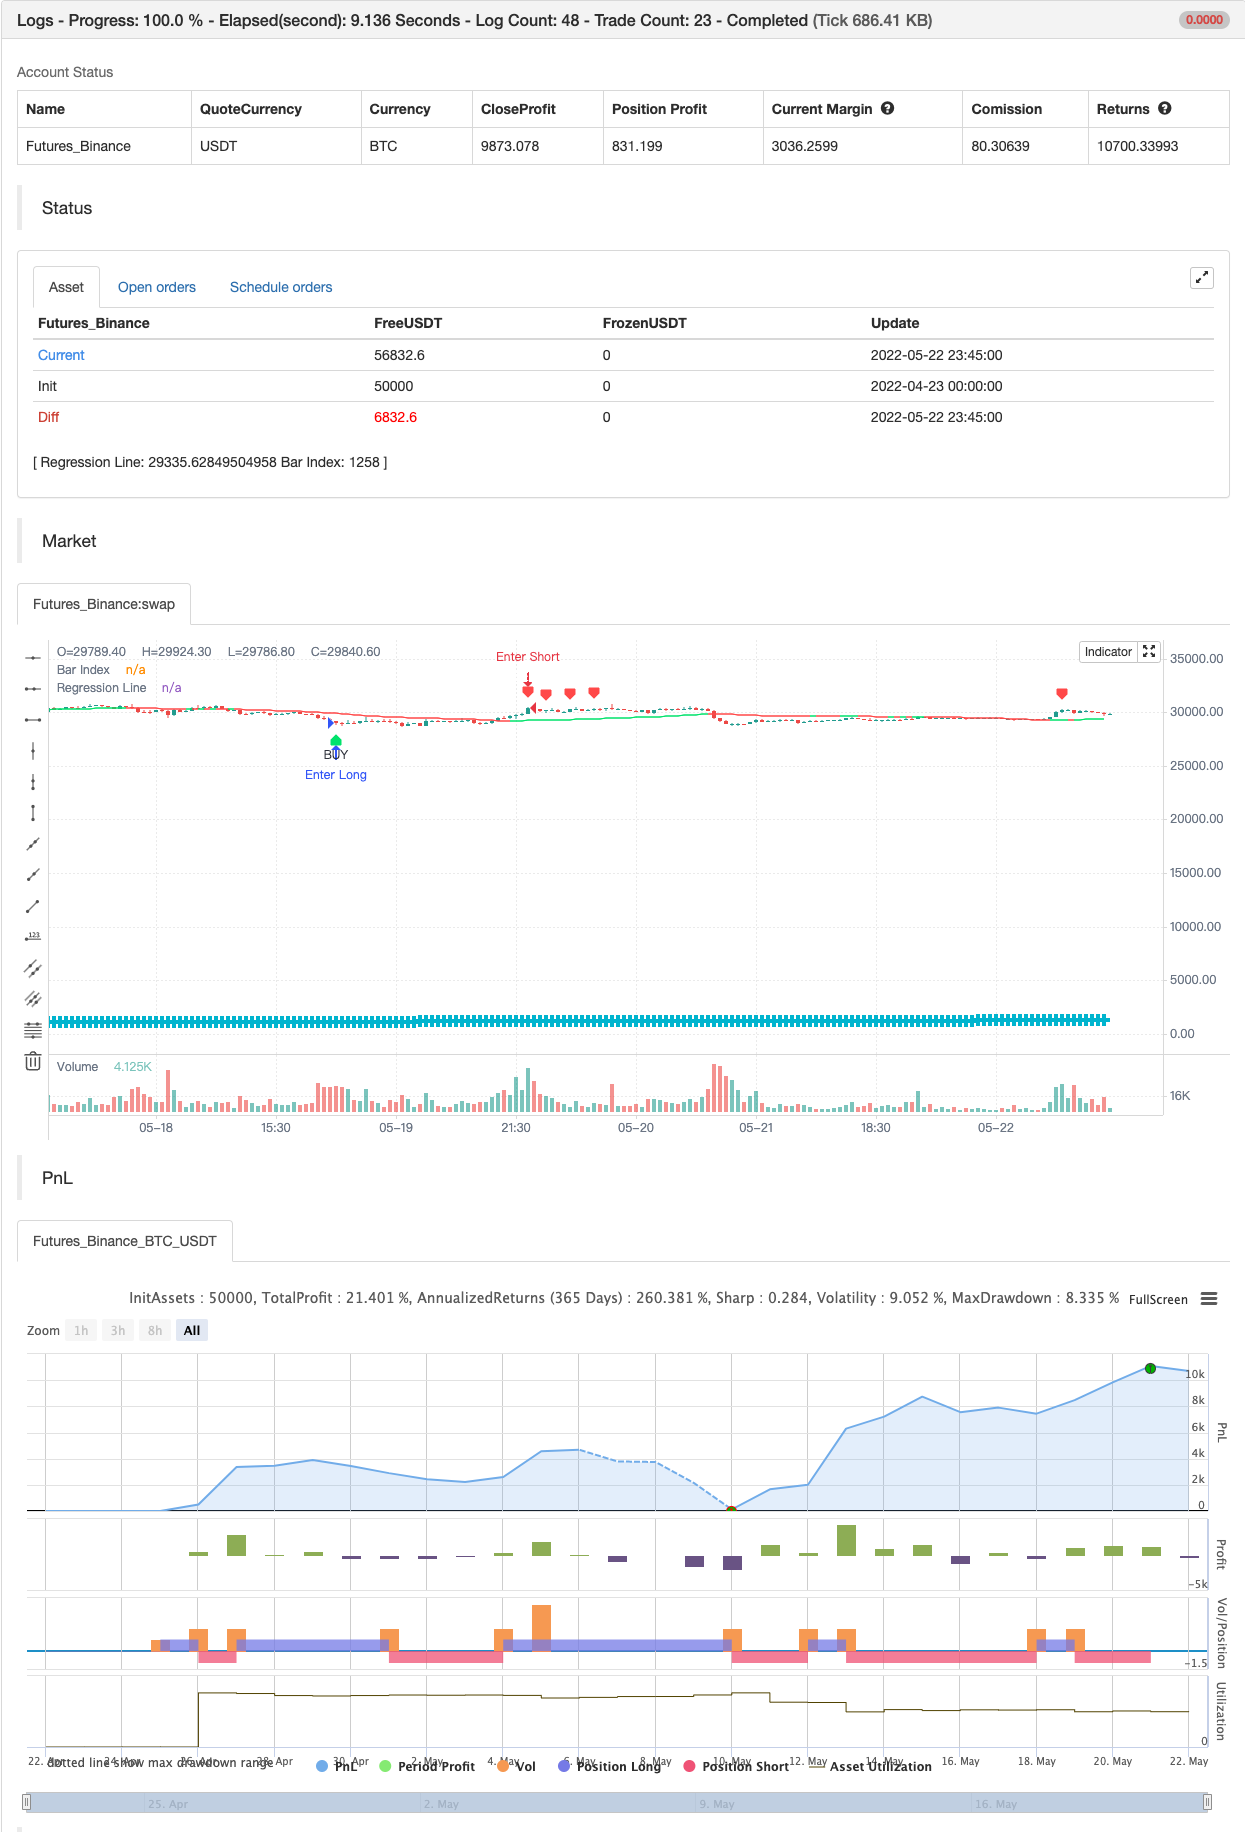
/*backtest
start: 2022-04-23 00:00:00
end: 2022-05-22 23:59:00
period: 45m
basePeriod: 5m
exchanges: [{"eid":"Futures_Binance","currency":"BTC_USDT"}]
*/

// This source code is subject to the terms of the Mozilla Public License 2.0 at https://mozilla.org/MPL/2.0/
// © LucemAnb
// User Version

//@version=4
study("Linear Regression ++ [Lucem Anb]", "Lin Reg ++ [Lucem Anb]", overlay=true)


source      = input(close)
length      = input(100, minval=1)
offset      = input(0, minval=0)
dev         = input(2.0, "Deviation")
smoothing   = input(1, minval=1)
mtf_val     = input("", "Resolution", input.resolution)
line_thick  = input(4, "S&R Thickness", minval=1, maxval=4)
signals     = input("Recent", "Signals Display", options=["Recent", "All"])
p           = input("Lime", "Up Color", options=["Red", "Lime", "Orange", "Teal", "Yellow", "White", "Black"])
q           = input("Red", "Down Color", options=["Red", "Lime", "Orange", "Teal", "Yellow", "White", "Black"])
goto        = input(0, "End At Bar Index")

cc(x) => x=="Red"?color.red:x=="Lime"?color.lime:x=="Orange"?color.orange:x=="Teal"?
 color.teal:x=="Yellow"?color.yellow:x=="Black"?color.black:color.white
data(x) => sma(security(syminfo.tickerid, mtf_val!="" ? mtf_val : timeframe.period, x), smoothing)

linreg = data(linreg(source, length, offset))
linreg_p = data(linreg(source, length, offset+1))
plot(linreg, "Regression Line", cc(linreg>linreg[1]?p:q), editable=false)

x = bar_index
slope = linreg - linreg_p
intercept = linreg - x*slope
deviationSum = 0.0
for i=0 to length-1
    deviationSum:= deviationSum + pow(source[i]-(slope*(x-i)+intercept), 2)
deviation = sqrt(deviationSum/(length))
x1 = x-length
x2 = x
y1 = slope*(x-length)+intercept
y2 = linreg

updating = goto <= 0 or x < goto


dm_current = -deviation*dev + y2
dp_current = deviation*dev + y2
buy = crossunder(close, dm_current)
sell = crossover(close, dp_current)
alertcondition(buy, "Buy Lin Reg", "Crossing On the Lower Regression Channel")
alertcondition(sell, "Sell Lin Reg", "Crossing On the Higher Regression Channel")

plotshape(buy, "BUY", shape.labelup, location.belowbar, color.lime, text='BUY', textcolor=color.black, show_last=signals=="All"?99999999:length)
plotshape(sell, "SELL", shape.labeldown, location.abovebar, color.red, text='SELL', textcolor=color.white, show_last=signals=="All"?99999999:length)

plot(x, "Bar Index", color.aqua, line_thick, plot.style_cross, display=display.none)

if buy
    strategy.entry("Enter Long", strategy.long)
else if sell
    strategy.entry("Enter Short", strategy.short)
- اسکیلپنگ سوئنگ ٹریڈنگ ٹول R1-4
- بہترین نگلنگ + بریک آؤٹ حکمت عملی
- بولنگر زبردست الرٹ R1
- ملٹی ایکسچینج بیک وقت پلگ ان
- ٹرائیگون سود (چھوٹی کرنسیوں کی قیمتوں میں فرق حاصل کرنا)
- بائی بٹ ریورس کنٹریکٹ متحرک گرڈ (خصوصی گرڈ)
- MT4 MT5 + متحرک متغیرات کے لئے ٹریڈنگ ویو انتباہات
- میٹرکس سیریز
- سپر اسکیلپر - 5 منٹ 15 منٹ
- رشتہ دار طاقت کا انڈیکس - اختلافات - لبرٹوس
- توانائی کی سلاخوں کے ساتھ ریڈ کے ڈبل ویڈر
- کنسولیڈیشن زونز - لائیو
- مقداری معیار کا اندازہ
- چلتی اوسط کراس الرٹ، ملٹی ٹائم فریم (MTF)
- ایم اے سی ڈی ری لوڈ شدہ حکمت عملی
- سپر ٹرینڈڈ چلتی اوسط
- ٹریڈنگ اے بی سی
- 15MIN BTCUSDTPERP BOT
- شینن اینٹروپی V2
- SUPERTREND ATR کے ساتھ ٹریلنگ سٹاپ نقصان