پارابولک SAR
مصنف:چاؤ ژانگ، تاریخ: 2022-05-31 19:01:00ٹیگز:SAR
یہ بلٹ ان Parabolic SAR اشارے کا ایک نیا ڈیزائن ہے۔ میں نے ایک مناسب ان پٹ سسٹم شامل کیا ، دونوں لائنوں کے لئے ابتدائی پوائنٹس کو اجاگر کرنے کا آپشن اور پوائنٹس کی چوڑائی کا انتخاب کرنے کا آپشن۔ لہذا ، اسے اپنی مرضی کے مطابق بنائیں۔
پیرابولک SAR کو اصل میں جے ویلس وائلڈر نے تیار کیا تھا اور اس کی کتاب میں بیان کیا گیا تھا
PSAR کے لئے کون سی ترتیبات آپ کے آلے اور وقت کے فریم پر سب سے زیادہ منافع بخش ہیں جاننے کے لئے آپ کو اس آلے کا استعمال کر سکتے ہیں
بیک ٹسٹ
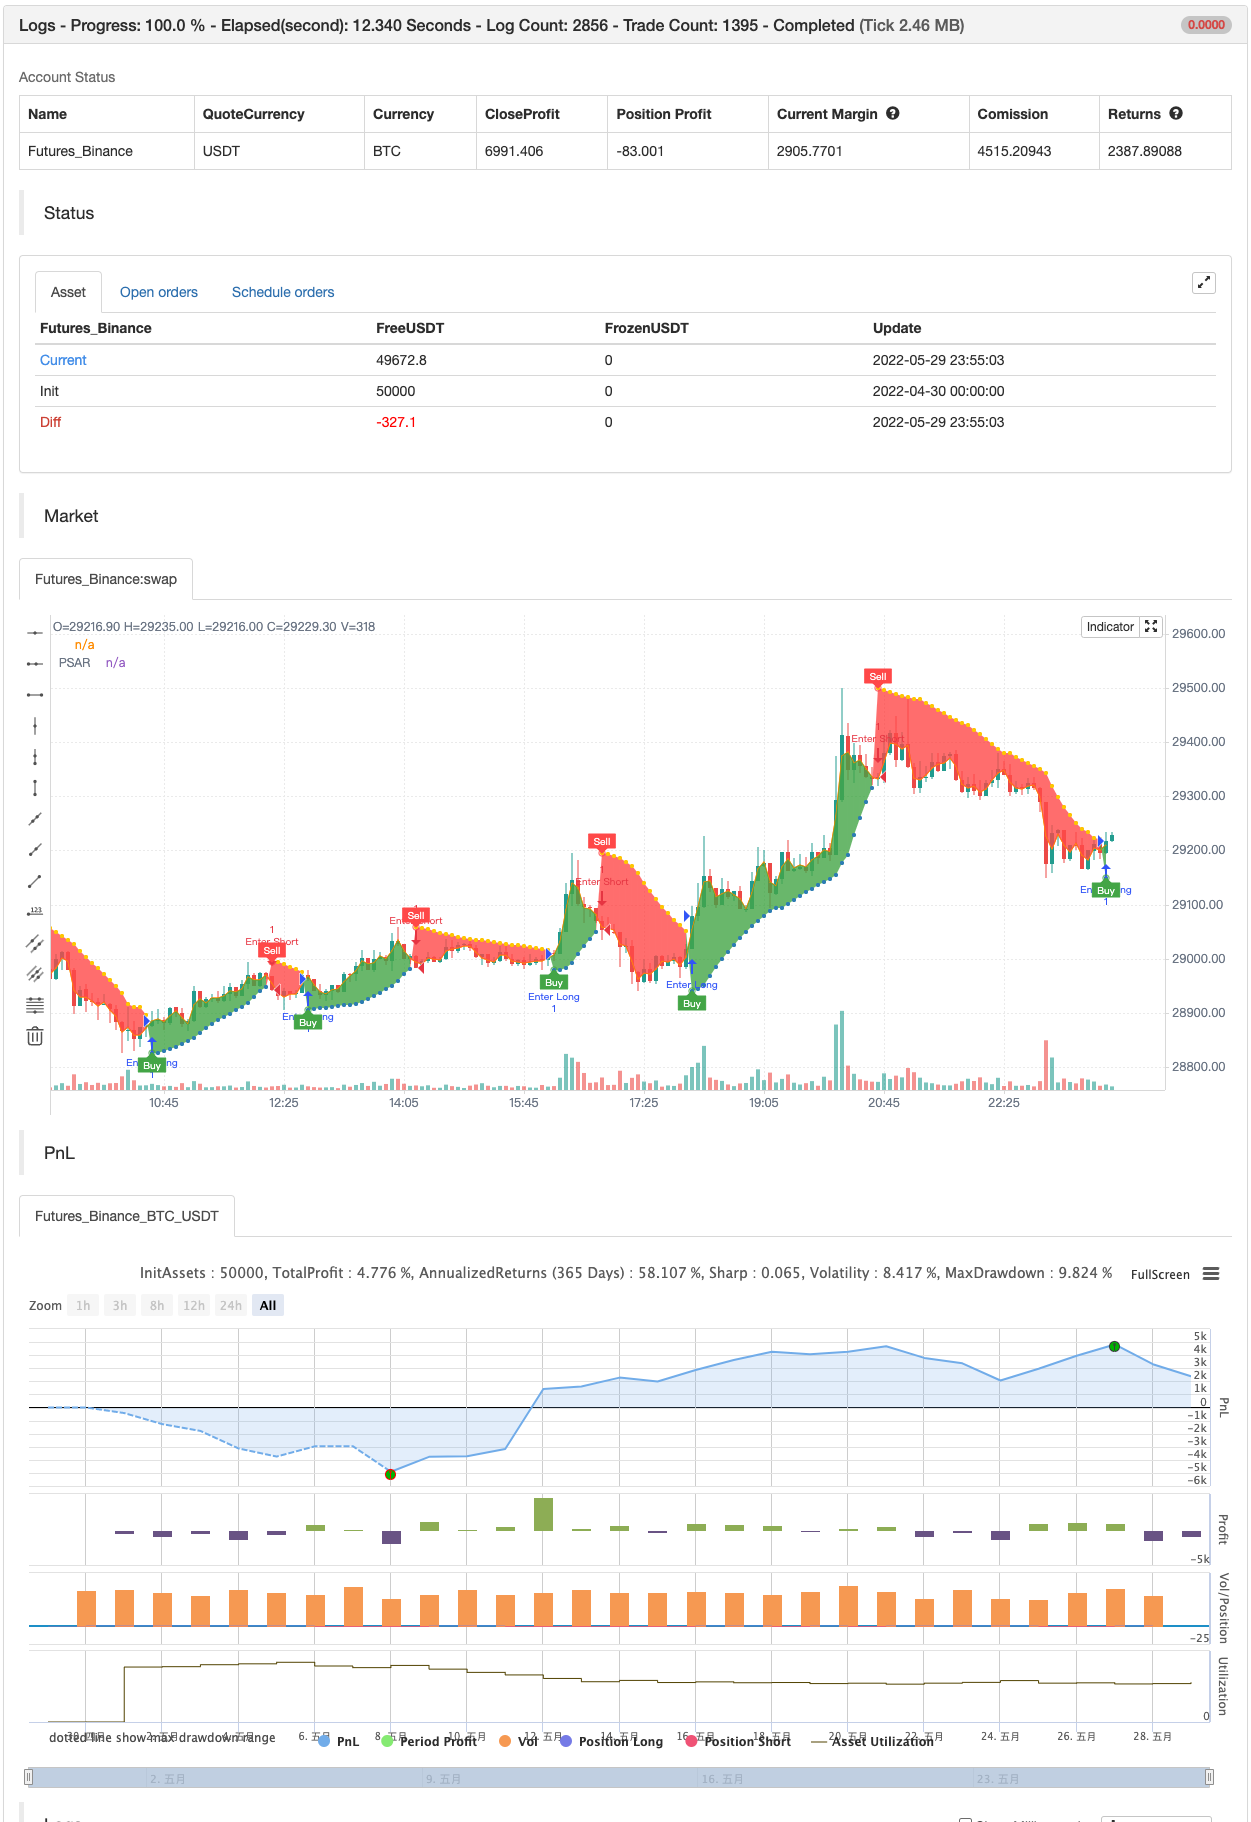
/*backtest
start: 2022-04-30 00:00:00
end: 2022-05-29 23:59:00
period: 5m
basePeriod: 1m
exchanges: [{"eid":"Futures_Binance","currency":"BTC_USDT"}]
*/

//@version=4
// Copyright (c) 2019-present, Alex Orekhov (everget)
// Parabolic SAR script may be freely distributed under the terms of the GPL-3.0 license.
study("Parabolic SAR", shorttitle="PSAR", overlay=true)

start = input(title="Start", type=input.float, step=0.001, defval=0.02)
increment = input(title="Increment", type=input.float, step=0.001, defval=0.02)
maximum = input(title="Maximum", type=input.float, step=0.01, defval=0.2)
width = input(title="Point Width", type=input.integer, minval=1, defval=2)
highlightStartPoints = input(title="Highlight Start Points ?", type=input.bool, defval=true)
showLabels = input(title="Show Buy/Sell Labels ?", type=input.bool, defval=true)
highlightState = input(title="Highlight State ?", type=input.bool, defval=true)

psar = sar(start, increment, maximum)
dir = psar < close ? 1 : -1

psarColor = dir == 1 ? #3388bb : #fdcc02
psarPlot = plot(psar, title="PSAR", style=plot.style_circles, linewidth=width, color=psarColor, transp=0)

var color longColor = color.green
var color shortColor = color.red

buySignal = dir == 1 and dir[1] == -1
plotshape(buySignal and highlightStartPoints ? psar : na, title="Long Start", location=location.absolute, style=shape.circle, size=size.tiny, color=longColor, transp=0)
plotshape(buySignal and showLabels ? psar : na, title="Buy Label", text="Buy", location=location.absolute, style=shape.labelup, size=size.tiny, color=longColor, textcolor=color.white, transp=0)

sellSignal = dir == -1 and dir[1] == 1
plotshape(sellSignal and highlightStartPoints ? psar : na, title="Short Start", location=location.absolute, style=shape.circle, size=size.tiny, color=shortColor, transp=0)
plotshape(sellSignal and showLabels ? psar : na, title="Sell Label", text="Sell", location=location.absolute, style=shape.labeldown, size=size.tiny, color=shortColor, textcolor=color.white, transp=0)

midPricePlot = plot(ohlc4, title="", display=display.none)

fillColor = highlightState ? (dir == 1 ? longColor : shortColor) : na
fill(midPricePlot, psarPlot, title="Trade State Filling", color=fillColor)

changeCond = dir != dir[1]
alertcondition(changeCond, title="Alert: PSAR Direction Change", message="PSAR has changed direction!")
alertcondition(buySignal, title="Alert: PSAR Long", message="PSAR Long")
alertcondition(sellSignal, title="Alert: PSAR Short", message="PSAR Sell")


if buySignal
    strategy.entry("Enter Long", strategy.long)
else if sellSignal
    strategy.entry("Enter Short", strategy.short)
متعلقہ
- ایلیٹ ویو تھیوری 4-9 امپیلس ویو خودکار پتہ لگانے کی تجارتی حکمت عملی
- SAR - اعلی اور کم
- اعلی کم SAR
- پیرابولک SAR خریدیں اور فروخت کریں
- 15MIN BTCUSDTPERP BOT
مزید
- TUE ADX/MACD Confluence V1.0
- ٹوئن رینج فلٹر
- SAR - اعلی اور کم
- درست سوئنگ ٹریڈنگ سسٹم
- لکیری رجحان
- فبونیکی ٹائمنگ پیٹرن
- ڈارواس باکس خریدیں فروخت کریں
- ڈیمارک سیٹ اپ اشارے
- بولنگر بینڈ اسٹوکاسٹک آر ایس آئی انتہائی
- اے کے ایم اے سی ڈی بی بی اشارے V 1.00
- RSI متغیر اشارے
- او بی وی ایم اے سی ڈی اشارے
- محور رجحان
- قیمتوں میں فرق کی حکمت عملی v1.0
- سپورٹ- مزاحمت توڑ
- ڈھلوان موافقت پذیر چلتی اوسط
- ڈیلٹا-آر ایس آئی آسکیلیٹر حکمت عملی
- کم سکینر حکمت عملی کریپٹو
- [بلیک کیٹ] L2 ریورس لیبلز حکمت عملی
- سپر بی