Cryptocurrency Futures Multi-Symbol ART Strategy (Giảng dạy)
Tác giả:Ninabadass, Tạo: 2022-04-07 11:09:42, Cập nhật: 2022-04-07 16:15:14Cryptocurrency Futures Multi-Symbol ART Strategy (Giảng dạy)
Gần đây, một số người dùng nền tảng của chúng tôi rất mong muốn chuyển giao một chiến lược Mylanguage sang một chiến lược JavaScript, để có thể thêm nhiều ý tưởng tối ưu hóa một cách linh hoạt. Họ thậm chí muốn mở rộng một chiến lược thành một phiên bản đa biểu tượng. Bởi vì các chiến lược Mylanguage thường là các chiến lược xu hướng, và nhiều chiến lược được thực hiện trong một mô hình giá gần. Những chiến lược đó yêu cầu giao diện API nền tảng không thường xuyên, phù hợp hơn để chuyển sang phiên bản chiến lược đa biểu tượng. Trong bài viết, chúng tôi lấy một chiến lược Mylanguage đơn giản làm ví dụ và chuyển nó sang một phiên bản ngôn ngữ JavaScript đơn giản. Mục đích chính là dạy, kiểm tra lại và nghiên cứu. Nếu bạn muốn chạy một chiến lược, bạn có thể cần thêm một số chi tiết (như số tiền đặt hàng, độ chính xác, số tiền đặt hàng, kiểm soát số tiền đặt hàng theo tài sản, tỷ lệ thông tin hiển thị và v.v.), Bạn cũng cần chạy thử nghiệm tick thực tế.
Chiến lược Mylangauge sẽ được chuyển đổi
TR:=MAX(MAX((H-L),ABS(REF(C,1)-H)),ABS(REF(C,1)-L));
ATR:=EMA(TR,LENGTH2);

MIDLINE^^EMA((H + L + C)/3,LENGTH1);
UPBAND^^MIDLINE + N*ATR;
DOWNBAND^^MIDLINE - N*ATR;


BKVOL=0 AND C>=UPBAND AND REF(C,1)<REF(UPBAND,1),BPK;
SKVOL=0 AND C<=DOWNBAND AND REF(C,1)>REF(DOWNBAND,1),SPK;

BKVOL>0 AND C<=MIDLINE,SP(BKVOL);
SKVOL>0 AND C>=MIDLINE,BP(SKVOL);
// stop loss
C>=SKPRICE*(1+SLOSS*0.01),BP;
C<=BKPRICE*(1-SLOSS*0.01),SP;
AUTOFILTER;
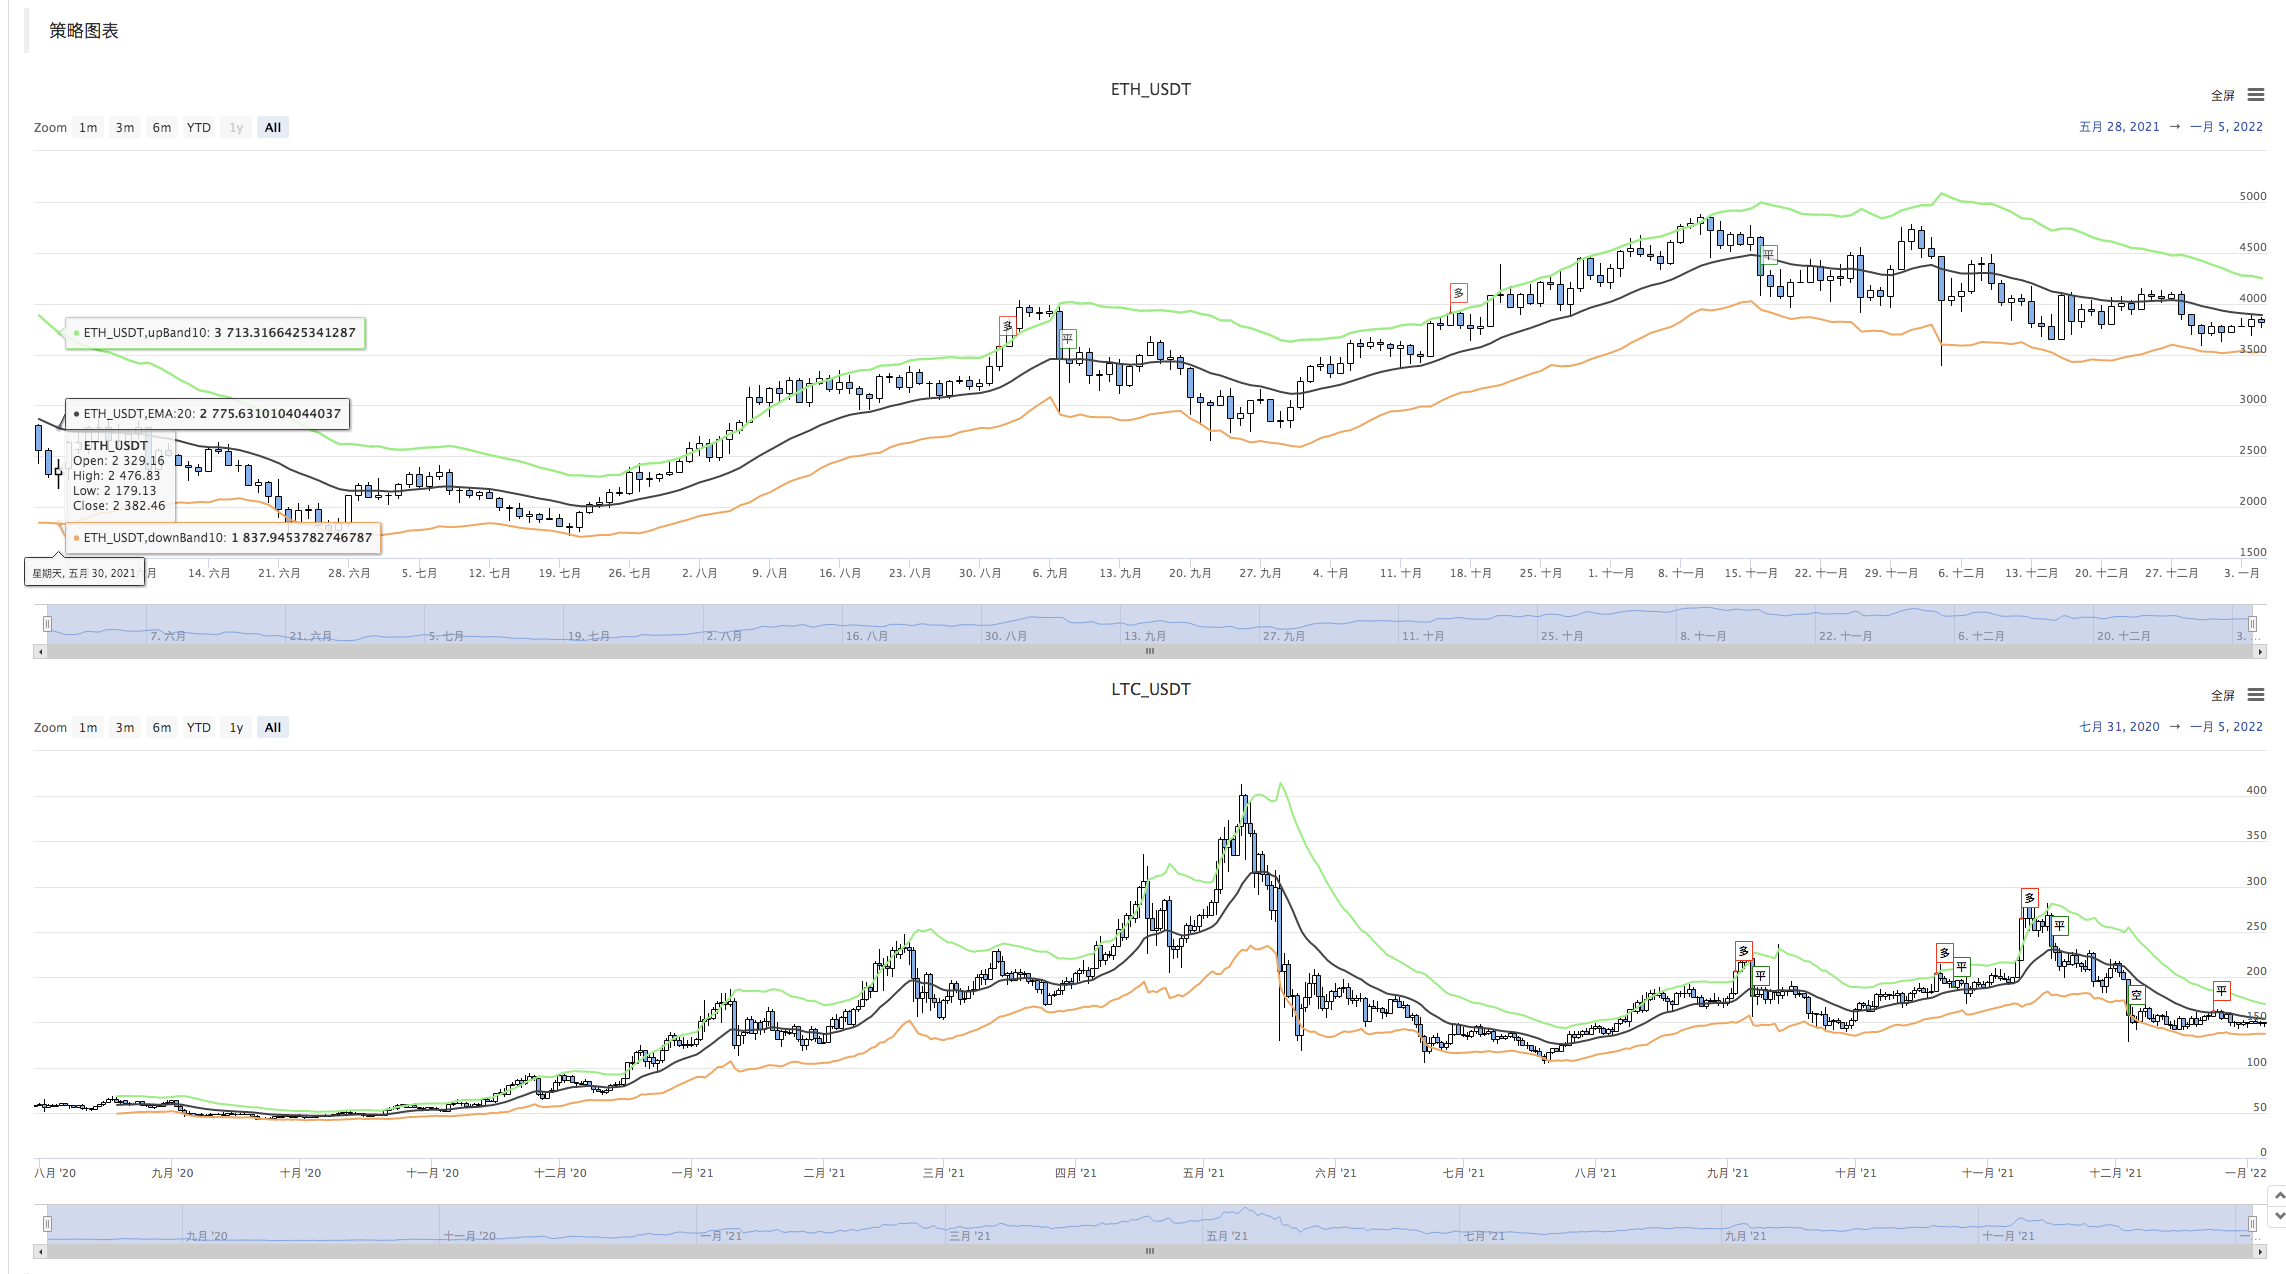
Khái niệm chiến lược rất đơn giản. Đầu tiên, theo các thông số, tính toán ATR, sau đó tính toán giá trung bình của giá cao nhất, thấp nhất, đóng và mở của tất cả các BAR đường K, theo đó chỉ số EMA sẽ được tính toán. Cuối cùng, trên cơ sở ATR và tỷ lệ N trong các thông số, tính toán upBand và downBand.
Vị trí mở và đảo ngược dựa trên giá đóng phá vỡ qua upBand và downBand. đảo ngược qua upBand (khi giữ ngắn), mở dài; đảo ngược qua downBand, mở ngắn. Khi giá đóng đạt đến đường trung bình, đóng vị trí; khi giá đóng đạt đến giá dừng lỗ, đóng vị trí (theo SLOSS để dừng lỗ; khi SLOSS là 1, nó có nghĩa là 0,01, cụ thể là 1%). Chiến lược được thực hiện trong mô hình giá đóng.
Được rồi, sau khi hiểu được các yêu cầu chiến lược và suy nghĩ của Mylanguage, chúng ta có thể bắt đầu chuyển giao.
Nguyên mẫu chiến lược cảng và thiết kế
Mã nguyên mẫu chiến lược không quá dài, chỉ từ 1 đến 200 dòng. Để bạn dễ dàng nghiên cứu các ý tưởng viết chiến lược, tôi trực tiếp viết các nhận xét trong mã chiến lược.
// parse params, from string to object
var arrParam = JSON.parse(params)

// the function creates the chart configuration
function createChartConfig(symbol, atrPeriod, emaPeriod, index) {   // symbol: trading pair; atrPeriod: ATR parameter period;  emaPeriod: EMA parameter period; index: index of the corresponding exchange object
    var chart = {
        __isStock: true,
        extension: {
                layout: 'single',
                height: 600,
        },
        title : { text : symbol},
        xAxis: { type: 'datetime'},
        series : [
            {
                type: 'candlestick',    // K-line data series
                name: symbol,
                id: symbol + "-" + index,
                data: []
            }, {
                type: 'line',           // EMA
                name: symbol + ',EMA:' + emaPeriod,
                data: [],
            }, {
                type: 'line',           // upBand
                name: symbol + ',upBand' + atrPeriod,
                data: []
            }, {
                type: 'line',           // downBand
                name: symbol + ',downBand' + atrPeriod,
                data: []
            }, {
                type: 'flags',
                onSeries: symbol + "-" + index,
                data: [],
            }
        ]
    }
    return chart
}

// main logic
function process(e, kIndex, c) {    // e is the exchange object, such as exchanges[0] ... ; kIndex is the data series of K-line data in the chart; c is the chart object
    // obtain K-line data
    var r = e.GetRecords(e.param.period)
    if (!r || r.length < e.param.atrPeriod + 2 || r.length < e.param.emaPeriod + 2) {
        // if K-line data length is insufficient, return
        return
    }

    // calculate ATR indicator
    var atr = TA.ATR(r, e.param.atrPeriod)
    var arrAvgPrice = []
    _.each(r, function(bar) {
        arrAvgPrice.push((bar.High + bar.Low + bar.Close) / 3)
    })
    // calculate EMA indicator
    var midLine = TA.EMA(arrAvgPrice, e.param.emaPeriod)
    // calculate upBand and downBand
    var upBand = []
    var downBand = []
    _.each(midLine, function(mid, index) {
        if (index < e.param.emaPeriod - 1 || index < e.param.atrPeriod - 1) {
            upBand.push(NaN)
            downBand.push(NaN)
            return
        }
        upBand.push(mid + e.param.trackRatio * atr[index])
        downBand.push(mid - e.param.trackRatio * atr[index])
    })

    // plot
    for (var i = 0 ; i < r.length ; i++) {
        if (r[i].Time == e.state.lastBarTime) {
            // update
            c.add(kIndex, [r[i].Time, r[i].Open, r[i].High, r[i].Low, r[i].Close], -1)
            c.add(kIndex + 1, [r[i].Time, midLine[i]], -1)
            c.add(kIndex + 2, [r[i].Time, upBand[i]], -1)
            c.add(kIndex + 3, [r[i].Time, downBand[i]], -1)
        } else if (r[i].Time > e.state.lastBarTime) {
            // add
            e.state.lastBarTime = r[i].Time
            c.add(kIndex, [r[i].Time, r[i].Open, r[i].High, r[i].Low, r[i].Close])
            c.add(kIndex + 1, [r[i].Time, midLine[i]])
            c.add(kIndex + 2, [r[i].Time, upBand[i]])
            c.add(kIndex + 3, [r[i].Time, downBand[i]])
        }
    }

    // detect position
    var pos = e.GetPosition()
    if (!pos) {
        return
    }
    var holdAmount = 0
    var holdPrice = 0
    if (pos.length > 1) {
        throw "Long and short positions are detected simultaneously!"
    } else if (pos.length != 0) {
        holdAmount = pos[0].Type == PD_LONG ? pos[0].Amount : -pos[0].Amount
        holdPrice = pos[0].Price
    }

    if (e.state.preBar == -1) {
        e.state.preBar = r[r.length - 1].Time
    }
    // detect signal
    if (e.state.preBar != r[r.length - 1].Time) {   // close price model
        if (holdAmount <= 0 && r[r.length - 3].Close < upBand[upBand.length - 3] && r[r.length - 2].Close > upBand[upBand.length - 2]) {   // close price up cross the upBand
            if (holdAmount < 0) {   // holding short, close position
                Log(e.GetCurrency(), "close short position", "#FF0000")
                $.CoverShort(e, e.param.symbol, Math.abs(holdAmount))
                c.add(kIndex + 4, {x: r[r.length - 2].Time, color: 'red', shape: 'flag', title: 'close', text: "close short position"})
            }
            // open long
            Log(e.GetCurrency(), "open long position", "#FF0000")
            $.OpenLong(e, e.param.symbol, 10)
            c.add(kIndex + 4, {x: r[r.length - 2].Time, color: 'red', shape: 'flag', title: 'long', text: "open long position"})
        } else if (holdAmount >= 0 && r[r.length - 3].Close > downBand[downBand.length - 3] && r[r.length - 2].Close < downBand[downBand.length - 2]) {  // close price down cross the downBand
            if (holdAmount > 0) {   // holding long, close position
                Log(e.GetCurrency(), "close long position", "#FF0000")
                $.CoverLong(e, e.param.symbol, Math.abs(holdAmount))
                c.add(kIndex + 4, {x: r[r.length - 2].Time, color: 'green', shape: 'flag', title: 'close', text: "close long position"})
            }
            // open short
            Log(e.GetCurrency(), "open short position", "#FF0000")
            $.OpenShort(e, e.param.symbol, 10)
            c.add(kIndex + 4, {x: r[r.length - 2].Time, color: 'green', shape: 'flag', title: 'short', text: "open short position"})
        } else {
            // close position
            if (holdAmount > 0 && (r[r.length - 2].Close <= holdPrice * (1 - e.param.stopLoss) || r[r.length - 2].Close <= midLine[midLine.length - 2])) {   // if holding long position, close price is equal to or less than midline, stop loss according to open position price
                Log(e.GetCurrency(), "if midline is triggered or stop loss, close long position", "#FF0000")
                $.CoverLong(e, e.param.symbol, Math.abs(holdAmount))
                c.add(kIndex + 4, {x: r[r.length - 2].Time, color: 'green', shape: 'flag', title: 'close', text: "close long position"})
            } else if (holdAmount < 0 && (r[r.length - 2].Close >= holdPrice * (1 + e.param.stopLoss) || r[r.length - 2].Close >= midLine[midLine.length - 2])) {  // if holding short position, close price is equal to or more than midline, stop loss according to open position price
                Log(e.GetCurrency(), "if midline is triggered or stop loss, close short position", "#FF0000")
                $.CoverShort(e, e.param.symbol, Math.abs(holdAmount))
                c.add(kIndex + 4, {x: r[r.length - 2].Time, color: 'red', shape: 'flag', title: 'close', text: "close short position"})
            }
        }
        e.state.preBar = r[r.length - 1].Time
    }
}

function main() {
    var arrChartConfig = []
    if (arrParam.length != exchanges.length) {
        throw "The parameter and the exchange object do not match!"
    }
    var arrState = _G("arrState")
    _.each(exchanges, function(e, index) {
        if (e.GetName() != "Futures_Binance") {
            throw "The platform is not supported!"
        }
        e.param = arrParam[index]
        e.state = {lastBarTime: 0, symbol: e.param.symbol, currency: e.GetCurrency()}
        if (arrState) {
            if (arrState[index].symbol == e.param.symbol && arrState[index].currency == e.GetCurrency()) {
                Log("Recover:", e.state)
                e.state = arrState[index]
            } else {
                throw "The recovered data and the current setting do not match!"
            }
        }
        e.state.preBar = -1   // initially set -1
        e.SetContractType(e.param.symbol)
        Log(e.GetName(), e.GetLabel(), "Set contract:", e.param.symbol)
        arrChartConfig.push(createChartConfig(e.GetCurrency(), e.param.atrPeriod, e.param.emaPeriod, index))
    })
    var chart = Chart(arrChartConfig)
    chart.reset()

    while (true) {
        _.each(exchanges, function(e, index) {
            process(e, index + index * 4, chart)
            Sleep(500)
        })
    }
}

function onexit() {
    // record e.state
    var arrState = []
    _.each(exchanges, function(e) {
        arrState.push(e.state)
    })
    Log("Record:", arrState)
    _G("arrState", arrState)
}
Các thông số chiến lược:
var params = '[{
        "symbol" : "swap",    // contract code
        "period" : 86400,     // K-line period; 86400 seconds indicates 1 day
        "stopLoss" : 0.07,    // ratio of stoploss; 0.07 means 7%
        "atrPeriod" : 10,     // ATR indicator parameter
        "emaPeriod" : 10,     // EMA indicator parameter
        "trackRatio" : 1,     // ratio of upBand or downBand
        "openRatio" : 0.1     // ratio of reserved open position (temporarily not supported)
    }, {
        "symbol" : "swap",
        "period" : 86400,
        "stopLoss" : 0.07,
        "atrPeriod" : 10,
        "emaPeriod" : 10,
        "trackRatio" : 1,
        "openRatio" : 0.1
    }]'
Kiểm tra hậu quả
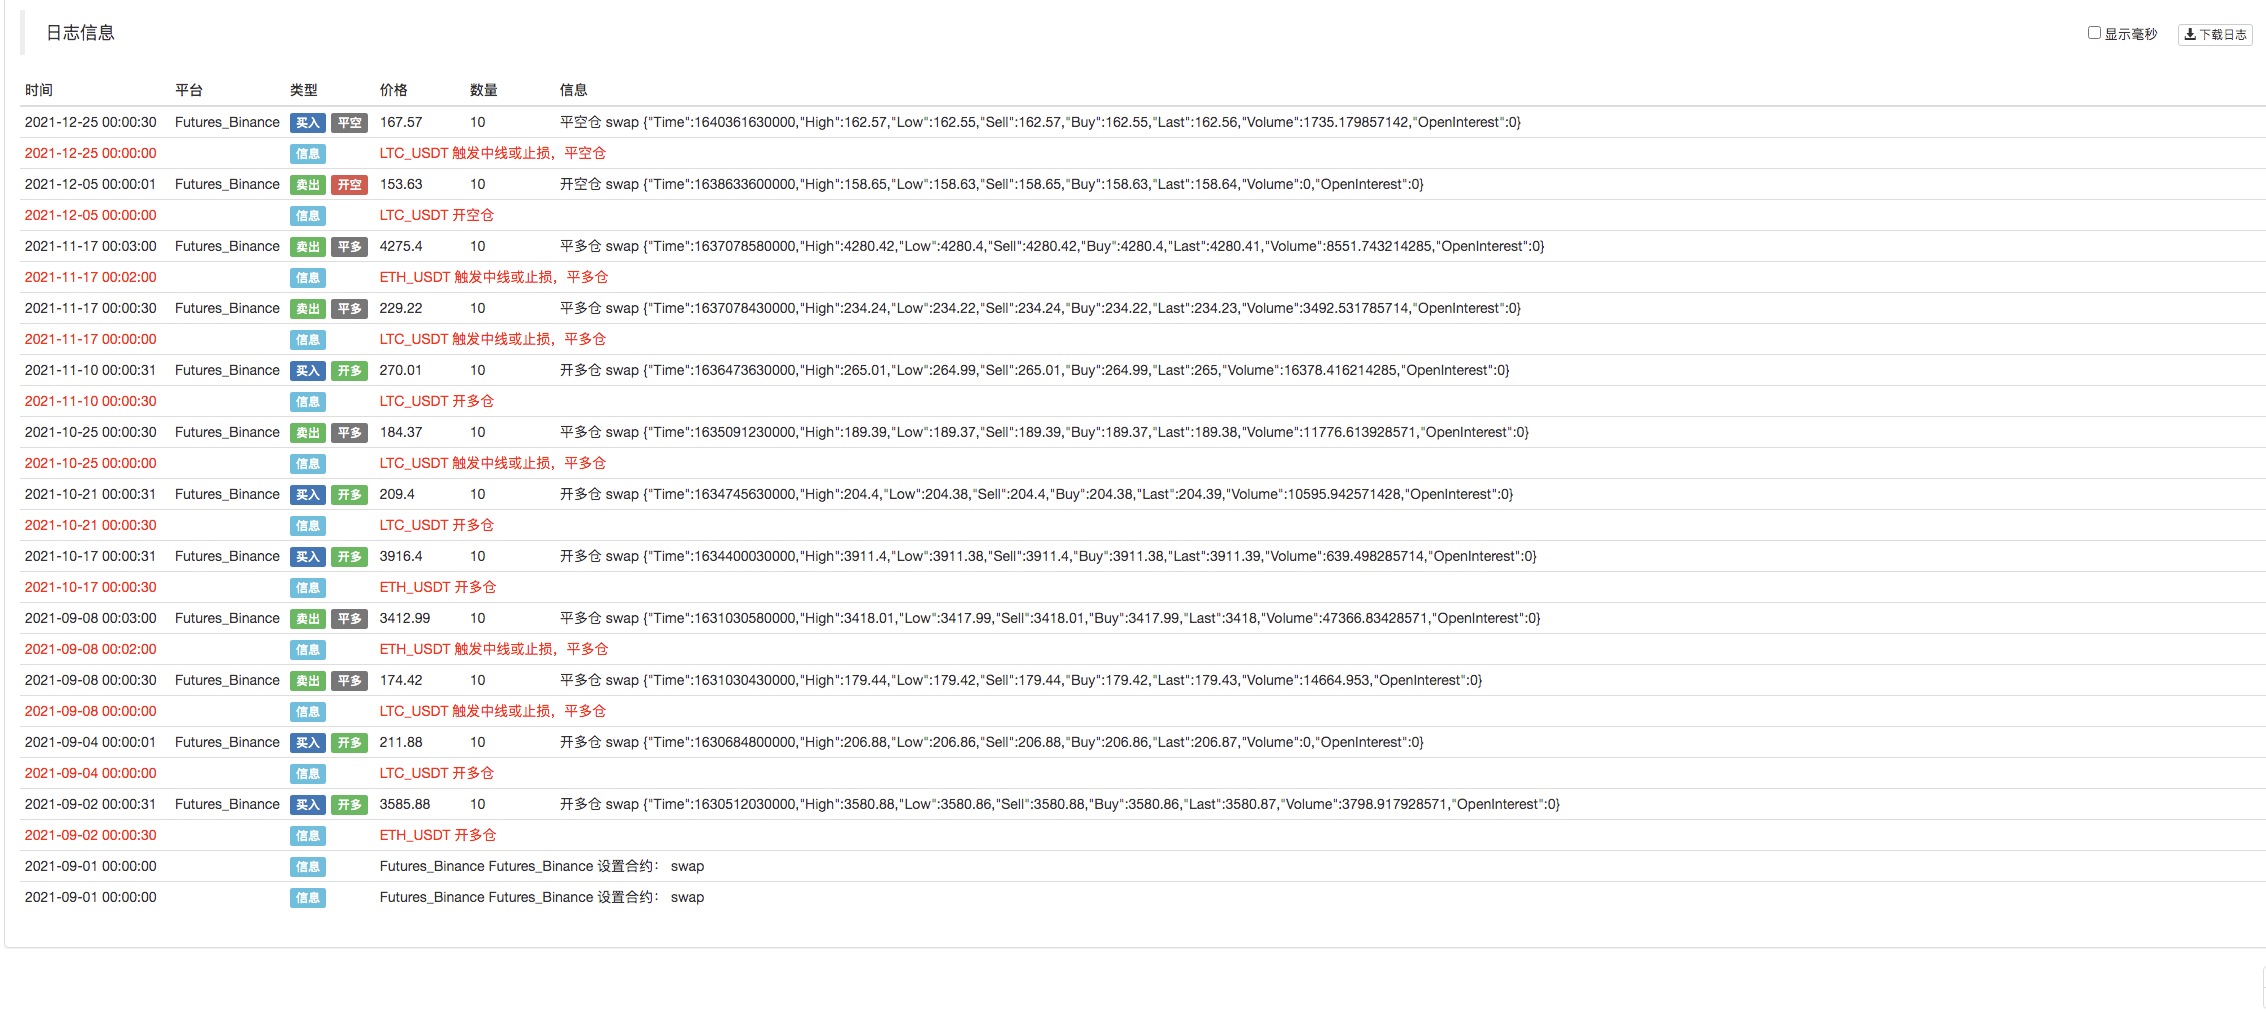
Mã nguồn chiến lược:https://www.fmz.com/strategy/339344
Chiến lược chỉ được sử dụng để giao tiếp và nghiên cứu; cho việc sử dụng thực tế, bạn cần phải tự sửa đổi, điều chỉnh và tối ưu hóa nó.
- Vấn đề giá trị mặt
- Ví dụ thiết kế chiến lược dYdX
- Khám phá ban đầu về ứng dụng Python Crawler trên FMZ
Crawling Binance Content Announcement - Nghiên cứu thiết kế chiến lược phòng ngừa rủi ro & Ví dụ về lệnh chờ giao dịch tại chỗ và tương lai
- Tình hình gần đây và hoạt động khuyến nghị của chiến lược tỷ lệ tài trợ
- Chiến lược điểm cắt trung bình động kép của hợp đồng tương lai tiền điện tử (Giảng dạy)
- Cryptocurrency Spot Multi-Symbol Dual Moving Average Strategy (Teaching)
- Thực hiện Fisher Indicator trong JavaScript & Plotting trên FMZ
- Người quản lý
- 2021 Cryptocurrency TAQ Review & Chiến lược bỏ lỡ đơn giản nhất tăng 10 lần
- Nâng cấp! Cryptocurrency tương lai chiến lược Martingale
- Chức năng Getrecords không thể lấy biểu đồ K theo giây
- Thiết kế hệ thống quản lý đồng bộ dựa trên FMZ (2)
- Dữ liệu về khối lượng mà Getticker trả về không đúng
- Thiết kế hệ thống quản lý đồng bộ dựa trên lệnh FMZ (1)
- Thiết kế một thư viện vẽ nhiều biểu đồ
- Môi trường đĩa tương tự
- Mã 60 dòng thực hiện một ý tưởng - Săn cá đáy hợp đồng
- Thông báo nâng cấp & điều chỉnh hệ thống hóa đơn FMZ
- Thông báo về các chiến lược ghostwriting trên FMZ