Thực hiện Fisher Indicator trong JavaScript & Plotting trên FMZ
Tác giả:Ninabadass, Tạo: 2022-04-07 16:04:22, Cập nhật:Thực hiện Fisher Indicator trong JavaScript & Plotting trên FMZ
Trong quá trình phân tích kỹ thuật trong giao dịch, tất cả các nhà giao dịch đều lấy dữ liệu giá cổ phiếu như dữ liệu phân phối bình thường để phân tích và nghiên cứu.Fisher Transformationlà một phương pháp có thể chuyển đổi dữ liệu giá thành một cái gì đó tương tự như một phân bố bình thường.Fisher TransformationCác tín hiệu giao dịch có thể được gửi bằng cách kết nối các chỉ số ngày hôm nay và ngày trước.
Có rất nhiều tham chiếu vềFisher Transformationtrên Baidu và Zhihu, mà sẽ không được giải thích chi tiết ở đây.
Chỉ số thuật toán:
-
Giá trung bình hôm nay:
mid=(low + high) / 2 -
Xác định thời gian tính toán; bạn có thể sử dụng 10 ngày mỗi thời gian.
lowestLow = the lowest price in the period,highestHigh = the highest price in the period. -
Xác định tham số thay đổi giá (trong đó
ratiolà một hằng số từ 0 đến 1; ví dụ, bạn có thể chọn 0,5 hoặc 0.33):(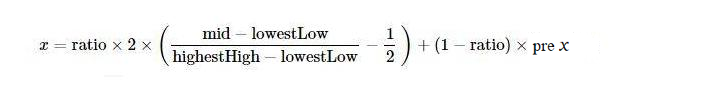
-
Áp dụng
Fisherchuyển đổi sang tham số thay đổi giáx, vàFisherchỉ số có thể được thu được: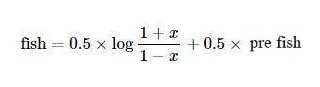
Sử dụng JavaScript để thực hiện thuật toán
Theo thuật toán chỉ số, thực hiện nó từng bước.preX, preFish, ban đầu chúng được thiết lập là 0.Math.loglà logarithm dựa trên hằng số tự nhiên e Ngoài ra, việc sửa đổi x không được đề cập trong thuật toán trên, và tôi gần như bỏ qua vấn đề này trong khi viết:
Thay đổi giá trị của x; nếu giá trị lớn hơn 0,99, buộc phải được đặt thành 0,999; nếu nhỏ hơn -0,99, đặt thành -0,999.
        if (x > 0.99) {
            x = 0.999
        } else if (x < -0.99) {
            x = -0.999
        }
Đây là lần đầu tiên tôi thấy thuật toán và chỉ số, sau khi chuyển nó theo thuật toán. Tôi đã không xác minh việc thực hiện, và sinh viên quan tâm đến nghiên cứu có thể xác minh xem có bất kỳ lỗi nào không. Cảm ơn rất nhiều vì đã chỉ ra lỗi, nếu có.
Mã nguồn củaFisher Transformthuật toán chỉ số:
function getHighest(arr, period) {
    if (arr.length == 0 || arr.length - period < 0) {
        return null
    }
    var beginIndex = arr.length - period
    var ret = arr[beginIndex].High
    for (var i = 0 ; i < arr.length - 1 ; i++) {
        if (arr[i + 1].High > ret) {
            ret = arr[i + 1].High
        }
    }
    return ret
}

function getLowest(arr, period) {
    if (arr.length == 0 || arr.length - period < 0) {
        return null
    }
    var beginIndex = arr.length - period
    var ret = arr[beginIndex].Low
    for (var i = 0 ; i < arr.length - 1 ; i++) {
        if (arr[i + 1].Low < ret) {
            ret = arr[i + 1].Low
        }
    }
    return ret
}

function calcFisher(records, ratio, period) {
    var preFish = 0
    var preX = 0
    var arrFish = []
    // when the K-line length is not long enough to meet the K-line period
    if (records.length < period) {
        for (var i = 0 ; i < records.length ; i++) {
            arrFish.push(0)
        }
        return arrFish
    }

    // traverse K-lines
    for (var i = 0 ; i < records.length ; i++) {
        var fish = 0
        var x = 0
        var bar = records[i]
        var mid = (bar.High + bar.Low) / 2
        // when the current BAR is not enough for period to calculate
        if (i < period - 1) {
            fish = 0
            preFish = 0
            arrFish.push(fish)
            continue
        }

        // calculate the highest price and the lowest price in the period
        var bars = []
        for (var j = 0 ; j <= i ; j++) {
            bars.push(records[j])
        }
        var lowestLow = getLowest(bars, period)
        var highestHigh = getHighest(bars, period)

        // price change parameter x
        x = ratio * 2 * ((mid - lowestLow) / (highestHigh - lowestLow) - 0.5) + (1 - ratio) * preX
        if (x > 0.99) {
            x = 0.999
        } else if (x < -0.99) {
            x = -0.999
        }
        preX = x
        fish = 0.5 * Math.log((1 + x) / (1 - x)) + 0.5 * preFish
        preFish = fish
        arrFish.push(fish)
    }
    return arrFish
}
Nội dung
Nó rất dễ dàng để vẽ trên FMZ; bạn có thể tham khảo rất nhiều ví dụ trong hình vuông chiến lược:https://www.fmz.com/square, và bạn cũng có thể tìm kiếm các chiến lược bạn cần.
var cfg = {    // used to initially configure the chart objects (namely chart settings)
    plotOptions: {
        candlestick: {
            color: '#d75442',  // color value
            upColor: '#6ba583' // color vlaue
        }
    },
    title: { text: 'Fisher Transform'},     //title
    subtitle: {text: ''},     //subtitle
    plotOptions: {
        candlestick: {
        tooltip: {
            pointFormat:
            '<span style="color:{point.color}">\u25CF</span> <b> {series.name}</b><br/>' +
            'open: {point.open}<br/>' +
            'highest: {point.high}<br/>' +
            'lowest: {point.low}<br/>' +
            'close: {point.close}<br/>'
            }
        }
    },
    yAxis: [{
        title: {
            text: 'K-line market quote'
        },
        height: '70%',
        lineWidth: 1
    }, {
        title: {
            text: 'Fisher Transform'
        },
        top: '75%',
        height: '30%',
        offset: 0,
        lineWidth: 1
    }],
    series: [//series
        {
            type: 'candlestick',
            yAxis: 0,
            name: 'K-line',
            id: 'KLine',
            // control the candlestick color of fall
            color: 'green',
            lineColor: 'green',
            // control the candlestick color of rise
            upColor: 'red',
            upLineColor: 'red',
            data: []
        },{
            type: 'line',         // set the type of the current data series as: line
            yAxis: 1,             // the y axis for use is the y axis with index 0 (in highcharts, there can be multiple y axis, and here it indicates the y axis with index 0)
            showInLegend: true,   //
            name: 'fish',          // set according the parameter label  passed by the function
            lineWidth: 1,
            data: [],             // data item of the data series
            tooltip: {            // tip for tool
                valueDecimals: 2  //  the decimals of the value reserve 5
            }
        },{
            type: 'line',         // set the type of the current data series as: line
            yAxis: 1,             // the y axis for use is the y axis with index 0 (in highcharts, there can be multiple y axis, and here it indicates the y axis with index 0)
            showInLegend: true,   //
            name: 'preFish',      // set according the parameter label  passed by the function
            lineWidth: 1,
            data: [],             // data item of the data series
            tooltip: {            // tip for tool
                valueDecimals: 2  // the decimals of the value reserve 5
            }
        }
    ]
}

var chart = Chart(cfg)
function main() {
    var ts = 0
    chart.reset()
    while (true) {
        var r = exchange.GetRecords()
        var fisher = calcFisher(r, 0.33, 10)
        if (!r || !fisher) {
            Sleep(500)
            continue
        }

        for (var i = 0; i < r.length; i++){
            if (ts == r[i].Time) {
                chart.add([0,[r[i].Time, r[i].Open, r[i].High, r[i].Low, r[i].Close], -1])
                chart.add([1,[r[i].Time, fisher[i]], -1])
                if (i - 1 >= 0) {
                    chart.add([2,[r[i].Time, fisher[i - 1]], -1])
                }
            }else if (ts < r[i].Time) {
                chart.add([0,[r[i].Time, r[i].Open, r[i].High, r[i].Low, r[i].Close]])
                chart.add([1,[r[i].Time, fisher[i]]])
                if (i - 1 >= 0) {
                    chart.add([2,[r[i].Time, fisher[i - 1]]])
                }
                ts = r[i].Time
            }
        }
    }
}
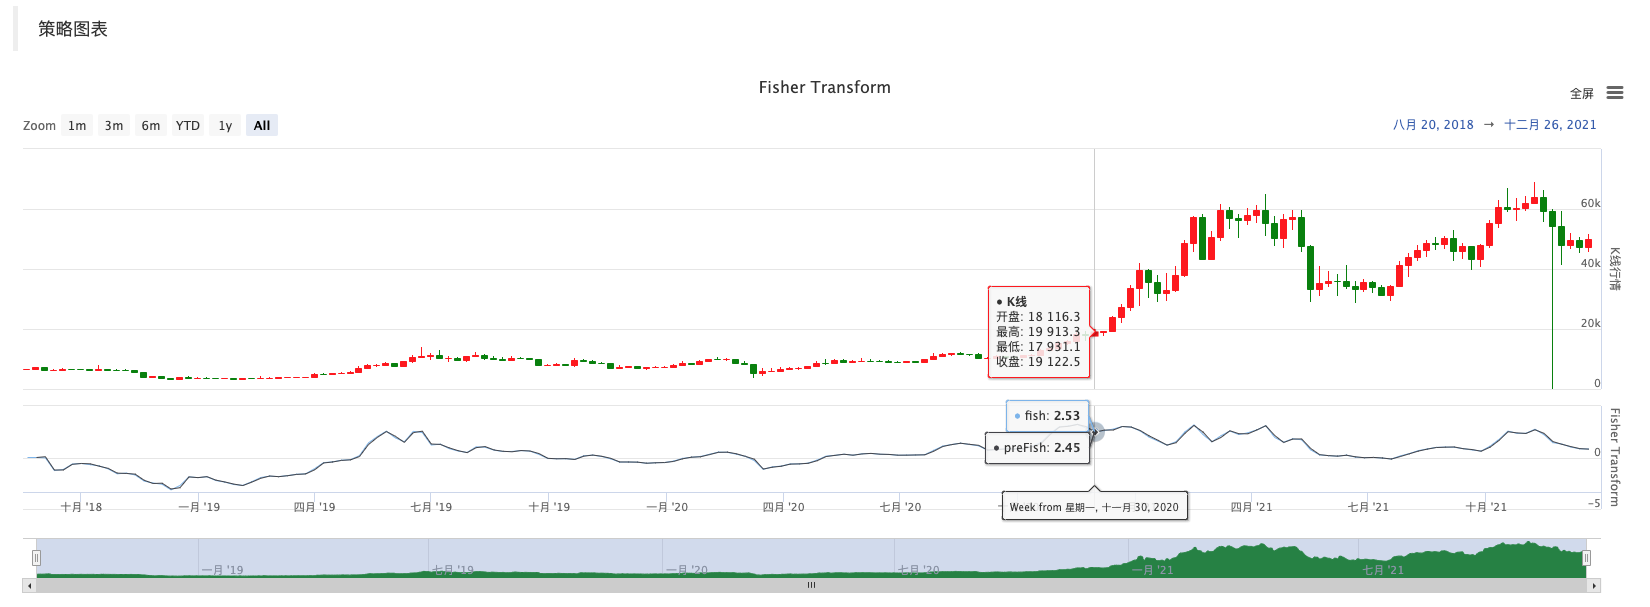
Do đó, rất thuận tiện để nghiên cứu dữ liệu, hiển thị biểu đồ và thiết kế chiến lược trên FMZ. Ở đây tôi bắt đầu cuộc thảo luận để tìm thêm ý tưởng, vì vậy hãy chào đón giáo viên và sinh viên để lại ý kiến.
- Cryptocurrency Contract Simple Order-Supervising Bot
- Bạn muốn lấy một khung thời gian tương ứng khi sử dụng getdepth
- Bỏ qua, giải quyết
- Vấn đề giá trị mặt
- Ví dụ thiết kế chiến lược dYdX
- Khám phá ban đầu về ứng dụng Python Crawler trên FMZ
Crawling Binance Content Announcement - Nghiên cứu thiết kế chiến lược phòng ngừa rủi ro & Ví dụ về lệnh chờ giao dịch tại chỗ và tương lai
- Tình hình gần đây và hoạt động khuyến nghị của chiến lược tỷ lệ tài trợ
- Chiến lược điểm cắt trung bình động kép của hợp đồng tương lai tiền điện tử (Giảng dạy)
- Cryptocurrency Spot Multi-Symbol Dual Moving Average Strategy (Teaching)
- Người quản lý
- 2021 Cryptocurrency TAQ Review & Chiến lược bỏ lỡ đơn giản nhất tăng 10 lần
- Cryptocurrency Futures Multi-Symbol ART Strategy (Giảng dạy)
- Nâng cấp! Cryptocurrency tương lai chiến lược Martingale
- Chức năng Getrecords không thể lấy biểu đồ K theo giây
- Thiết kế hệ thống quản lý đồng bộ dựa trên FMZ (2)
- Dữ liệu về khối lượng mà Getticker trả về không đúng
- Thiết kế hệ thống quản lý đồng bộ dựa trên lệnh FMZ (1)
- Thiết kế một thư viện vẽ nhiều biểu đồ
- Môi trường đĩa tương tự