Thực hiện một chiến lược giao dịch định lượng tiền kỹ thuật số tăng gấp đôi trong Python
Tác giả:Lydia., Tạo: 2023-01-10 17:07:49, Cập nhật: 2023-09-20 10:53:48
Thực hiện một chiến lược giao dịch định lượng tiền kỹ thuật số tăng gấp đôi trong Python
Giới thiệu về thuật toán giao dịch Dual Thrust
Các thuật toán giao dịch đẩy kép là một chiến lược giao dịch định lượng nổi tiếng được phát triển bởi Michael Chalek. Nó thường được sử dụng trong tương lai, ngoại hối và thị trường chứng khoán. Khái niệm của đẩy kép là một hệ thống giao dịch đột phá điển hình. Nó sử dụng hệ thống đẩy kép để xây dựng một thời gian theo dõi ngược cập nhật dựa trên giá lịch sử, mà về mặt lý thuyết làm cho nó ổn định hơn trong bất kỳ giai đoạn nào.
Trong bài viết này, chúng tôi cung cấp chi tiết logic chi tiết về chiến lược này và cho thấy cách thực hiện thuật toán này trên nền tảng FMZ Quant. Trước tiên, chúng ta cần chọn giá lịch sử của chủ đề được giao dịch. Phạm vi này được tính dựa trên giá đóng, giá cao nhất và giá thấp nhất trong N ngày qua. Khi thị trường di chuyển một phạm vi nhất định từ giá mở, mở vị trí.
Chúng tôi đã thử nghiệm chiến lược này với một cặp giao dịch duy nhất trong hai điều kiện thị trường phổ biến, cụ thể là thị trường xu hướng và thị trường sốc. Kết quả cho thấy hệ thống giao dịch động lực hoạt động tốt hơn trong thị trường xu hướng và nó sẽ kích hoạt một số tín hiệu giao dịch không hợp lệ trong thị trường biến động. Trong thị trường khoảng thời gian, chúng tôi có thể điều chỉnh các tham số để có được lợi nhuận tốt hơn. Để so sánh các mục tiêu giao dịch tham chiếu riêng lẻ, chúng tôi cũng đã thử nghiệm thị trường tương lai hàng hóa trong nước. Kết quả cho thấy chiến lược tốt hơn hiệu suất trung bình.
Nguyên tắc chiến lược DT
Mẫu nguyên mẫu hợp lý của nó là một chiến lược giao dịch trong ngày phổ biến. Chiến lược đột phá phạm vi mở dựa trên giá mở hôm nay cộng hoặc trừ một tỷ lệ phần trăm nhất định của phạm vi hôm qua để xác định các đường dẫn trên và dưới. Khi giá vượt qua đường dẫn trên, nó sẽ mở vị trí để mua, và khi phá vỡ đường dẫn dưới, nó sẽ mở vị trí để bán ngắn.
Nguyên tắc chiến lược
-
Sau khi đóng, hai giá trị được tính: giá cao nhất - giá đóng và giá đóng - giá thấp nhất. Sau đó lấy giá trị lớn hơn trong hai giá trị và nhân giá trị bằng 0,7.
-
Sau khi thị trường mở cửa vào ngày hôm sau, ghi lại giá mở cửa và mua ngay lập tức khi giá vượt quá (giá mở cửa + giá trị kích hoạt), hoặc bán các vị trí ngắn khi giá thấp hơn (giá mở cửa - giá trị kích hoạt).
-
Chiến lược này không có lỗ dừng rõ ràng. Hệ thống này là một hệ thống ngược lại, nghĩa là nếu có một lệnh vị trí ngắn khi giá vượt quá (giá mở + giá trị kích hoạt), nó sẽ gửi hai lệnh mua (một đóng sai vị trí, người khác mở đúng vị trí). Vì cùng lý do, nếu giá của một vị trí dài thấp hơn (giá mở - giá trị kích hoạt), nó sẽ gửi hai lệnh bán.
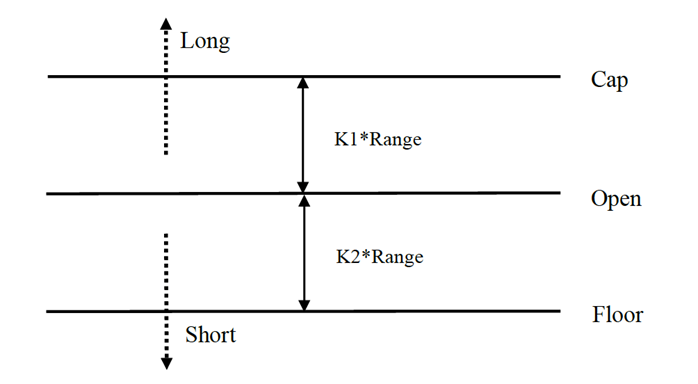
biểu thức toán học của chiến lược DT
Phạm vi = tối đa (HH-LC, HC-LL)
Phương pháp tính toán tín hiệu vị trí dài là:
cap = mở + K1 × Rangecap = mở + K1 × Range
Phương pháp tính toán tín hiệu vị trí ngắn là:
sàn = mở
Khi K1 và K2 là các tham số. Khi K1 lớn hơn K2, tín hiệu vị trí dài được kích hoạt, và ngược lại. Để chứng minh, chúng tôi chọn K1 = K2 = 0.5. Trong giao dịch thực tế, chúng tôi vẫn có thể sử dụng dữ liệu lịch sử để tối ưu hóa các tham số này hoặc điều chỉnh các tham số theo xu hướng thị trường. Nếu bạn lạc quan, K1 nên nhỏ hơn K2. Nếu bạn giảm, K1 nên lớn hơn K2.
Hệ thống này là một hệ thống đảo ngược. Do đó, nếu các nhà đầu tư nắm giữ các vị trí ngắn khi giá vượt qua đường dẫn trên, họ nên đóng các vị trí ngắn trước khi mở các vị trí dài. Nếu một nhà đầu tư nắm giữ một vị trí dài khi giá phá vỡ đường dẫn dưới, họ nên đóng vị trí dài trước khi mở một vị trí ngắn mới.
Cải thiện chiến lược DT:
Trong cài đặt phạm vi, bốn điểm giá (cao, mở, thấp và đóng) của N ngày trước được giới thiệu để làm cho phạm vi tương đối ổn định trong một khoảng thời gian nhất định, có thể được áp dụng cho việc theo dõi xu hướng hàng ngày.
Các điều kiện kích hoạt của việc mở các vị trí dài và ngắn của chiến lược, xem xét phạm vi không đối xứng, phạm vi tham chiếu của các giao dịch dài và ngắn nên chọn số lần khác nhau, cũng có thể được xác định bởi các thông số K1 và K2. Khi K1 < K2, tín hiệu vị trí dài tương đối dễ kích hoạt, trong khi khi K1 > K2, tín hiệu vị trí ngắn tương đối dễ kích hoạt.
Do đó, khi sử dụng chiến lược này, một mặt, bạn có thể tham khảo các thông số tốt nhất của kiểm tra dữ liệu lịch sử. mặt khác, bạn có thể điều chỉnh K1 và K2 theo giai đoạn theo đánh giá của bạn về tương lai hoặc các chỉ số kỹ thuật thời gian chính khác.
Đây là một phương pháp giao dịch điển hình để chờ tín hiệu, vào thị trường, điều chỉnh, và sau đó rời khỏi thị trường, nhưng hiệu quả là tuyệt vời.
triển khai chiến lược DT trên nền tảng FMZ Quant
Chúng tôi mở cửa.FMZ.COM, đăng nhập vào tài khoản, nhấp vào Dashboard, và triển khai docker và robot.
Vui lòng tham khảo bài viết trước của tôi về cách triển khai một docker và robot:https://www.fmz.com/bbs-topic/9864.
Người đọc muốn mua máy chủ điện toán đám mây của riêng mình để triển khai các dockers có thể tham khảo bài viết này:https://www.fmz.com/digest-topic/5711.
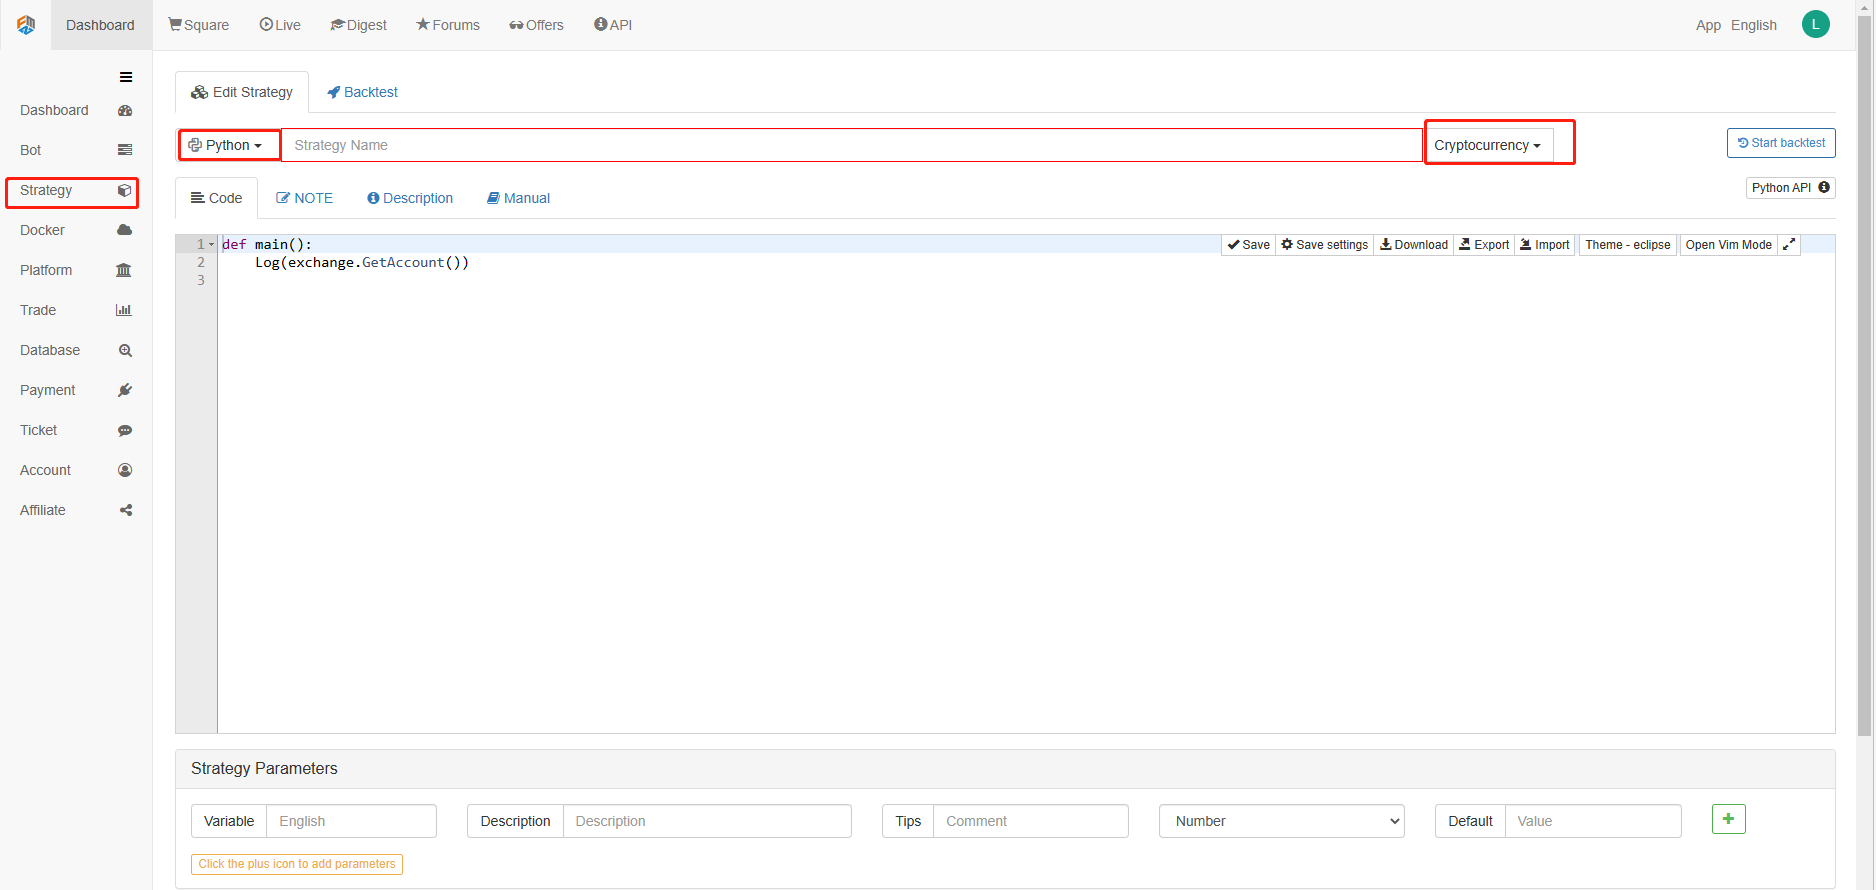
Tiếp theo, chúng ta nhấp vào thư viện chiến lược ở cột bên trái và nhấp vào thêm chiến lược.
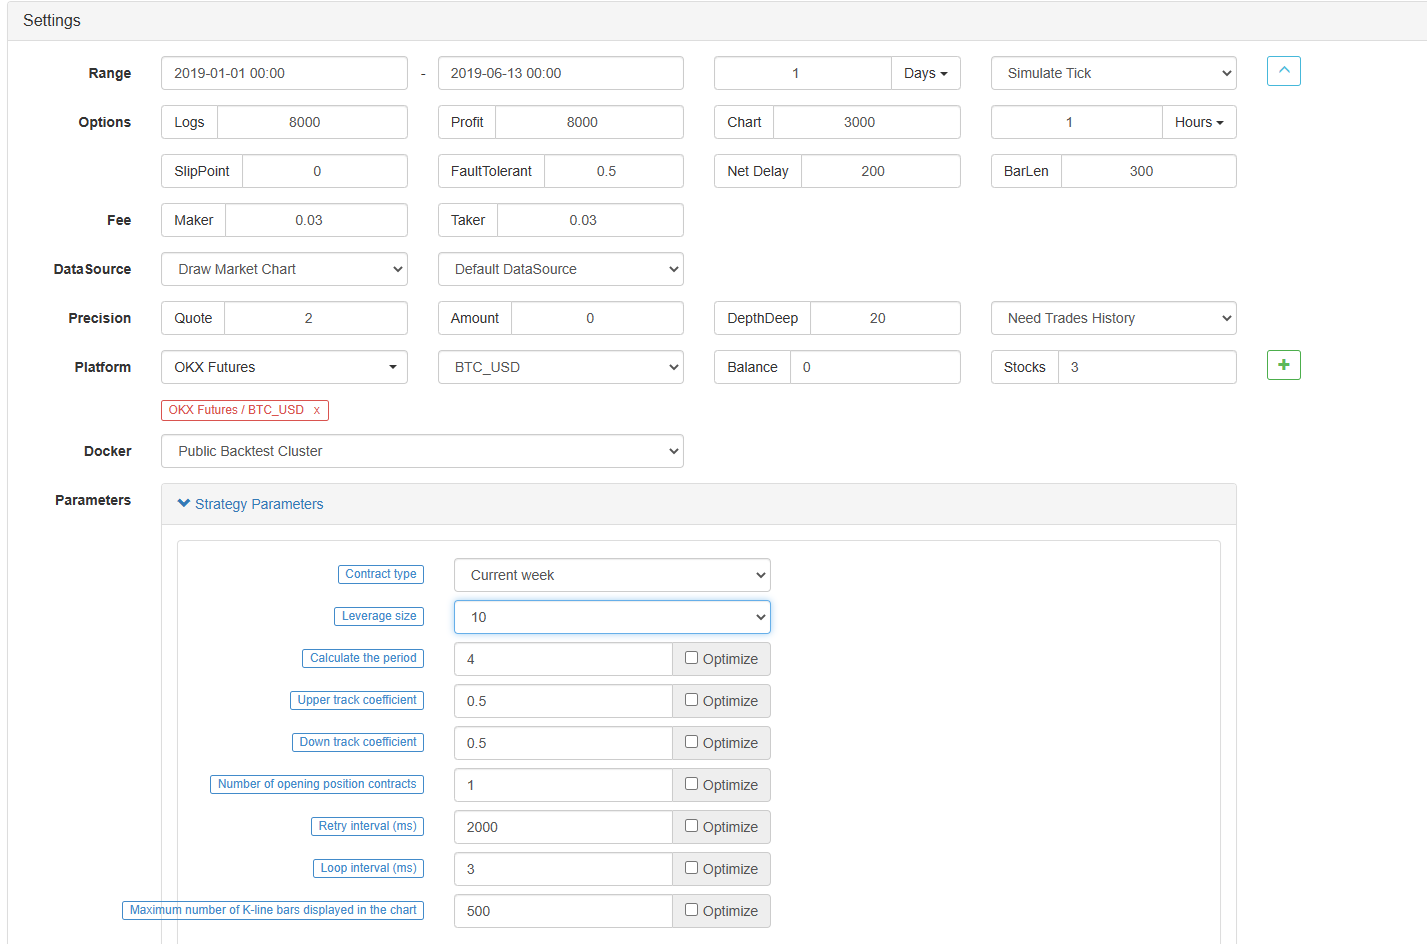
Hãy nhớ để chọn ngôn ngữ lập trình như Python ở góc trên bên phải của trang chỉnh sửa chiến lược, như được hiển thị trong hình:
Tiếp theo, chúng ta sẽ viết mã Python vào trang chỉnh sửa mã. Mã sau có những bình luận chi tiết từng dòng, bạn có thể dành thời gian để hiểu.
Chúng tôi sẽ sử dụng hợp đồng tương lai OKCoin để kiểm tra chiến lược:
import time # Here we need to introduce the time library that comes with python, which will be used later in the program.

class Error_noSupport(BaseException): # We define a global class named ChartCfg to initialize the strategy chart settings. Object has many attributes about the chart function. Chart library: HighCharts.
    def __init__(self): # log out prompt messages
        Log("Support OKCoin Futures only! #FF0000")

class Error_AtBeginHasPosition(BaseException):
    def __init__(self):
        Log("Start with a futures position! #FF0000")

ChartCfg = {
    '__isStock': True, # This attribute is used to control whether to display a single control data series (you can cancel the display of a single data series on the chart). If you specify __isStock: false, it will be displayed as a normal chart.
    'title': { # title is the main title of the chart
        'text': 'Dual Thrust upper and bottom track chart' # An attribute of the title text is the text of the title, here set to 'Dual Thrust upper and bottom track chart' the text will be displayed in the title position.
    },
    'yAxis': { # Settings related to the Y-axis of the chart coordinate.
        'plotLines': [{ # Horizontal lines on the Y-axis (perpendicular to the Y-axis), the value of this attribute is an array, i.e. the setting of multiple horizontal lines.
            'value': 0, # Coordinate value of horizontal line on Y-axis
            'color': 'red', # Color of horizontal line
            'width': 2, # Line width of horizontal line
            'label': {  # Labels on the horizontal line
                'text': 'Upper track', # Text of the label
                'align': 'center' # The display position of the label, here set to center (i.e.: 'center')
            },
        }, {       # The second horizontal line ([{...} , {...}] the second element in the array)
            'value': 0, # Coordinate value of horizontal line on Y-axis
            'color': 'green', # Color of horizontal line
            'width': 2,  # Line width of horizontal line
            'label': { # Label
                'text': 'bottom track',
                'align': 'center'
            },
        }]
    },
    'series': [{ # Data series, that is, data used to display data lines, K-lines, tags, and other contents on the chart. It is also an array whose first index is 0.
        'type': 'candlestick', # Type of data series with index 0: 'candlestick' indicates a K-line chart.
        'name': 'Current period',  # Name of the data series
        'id': 'primary', # The ID of the data series, which is used for the related settings of the next data series.
        'data': []  # An array of data series to store specific K-line data
    }, {
        'type': 'flags',  # Data series, type: 'flags', display labels on the chart, indicating going long and going short. Index is 1.
        'onSeries': 'primary',  # This attribute indicates that the label is displayed on id 'primary'.
        'data': []    # The array that holds the label data.
    }]
}

STATE_IDLE = 0  # Status constants, indicating idle
STATE_LONG = 1 # Status constants, indicating long positions
STATE_SHORT = 2 # Status constants, indicating short positions
State = STATE_IDLE # Indicates the current program status, assigned as idle initially

LastBarTime = 0  # The time stamp of the last column of the K-line (in milliseconds, 1000 milliseconds is equal to 1 second, and the timestamp is the number of milliseconds from January 1, 1970 to the present time is a large positive integer).
UpTrack = 0   # Upper track value
BottomTrack = 0 # Bottom track value
chart = None # It is used to accept the chart control object returned by the Chart API function. Use this object (chart) to call its member function to write data to the chart.
InitAccount = None # Initial account status
LastAccount = None # Latest account status
Counter = { # Counters for recording profit and loss counts
    'w': 0, # Number of wins
    'l': 0  # Number of losses
}

def GetPosition(posType):  # Define a function to store account position information
    positions = exchange.GetPosition() # exchange.GetPosition() is the FMZ Quant official API. For its usage, please refer to the official API document: https://www.fmz.com/api.
    return [{'Price': position['Price'], 'Amount': position['Amount']} for position in positions if position['Type'] == posType] # Return to various position information

def CancelPendingOrders(): # Define a function specifically for withdrawing orders
    while True: # Loop check
        orders = exchange.GetOrders() # If there is a position
        [exchange.CancelOrder(order['Id']) for order in orders if not Sleep(500)] # Withdrawal statement
        if len(orders) == 0: # Logical judgment
            break

def Trade(currentState,nextState): # Define a function to determine the order placement logic.
    global InitAccount,LastAccount,OpenPrice,ClosePrice # Define the global scope
    ticker = _C(exchange.GetTicker) # For the usage of _C, please refer to: https://www.fmz.com/api.
    slidePrice = 1 # Define the slippage value
    pfn = exchange.Buy if nextState == STATE_LONG else exchange.Sell # Buying and selling judgment logic
    if currentState != STATE_IDLE: # Loop start
        Log(_C(exchange.GetPosition)) # Log information
        exchange.SetDirection("closebuy" if currentState == STATE_LONG else "closesell") # Adjust the order direction, especially after placing the order.
        while True:
            ID = pfn( (ticker['Last'] - slidePrice) if currentState == STATE_LONG else (ticker['Last'] + slidePrice), AmountOP) # Price limit order, ID=pfn (- 1, AmountOP) is the market price order, ID=pfn (AmountOP) is the market price order.
            Sleep(Interval) # Take a break to prevent the API from being accessed too often and your account being blocked.
            Log(exchange.GetOrder(ID)) # Log information
            ClosePrice = (exchange.GetOrder(ID))['AvgPrice'] # Set the closing price
            CancelPendingOrders() # Call the withdrawal function
            if len(GetPosition(PD_LONG if currentState == STATE_LONG else PD_SHORT)) == 0: # Order withdrawal logic
                break
        account = exchange.GetAccount() # Get account information
        if account['Stocks'] > LastAccount['Stocks']: # If the current account currency value is greater than the previous account currency value.
            Counter['w'] += 1 # In the profit and loss counter, add one to the number of profits.
        else:
            Counter['l'] += 1 # Otherwise, add one to the number of losses.
        Log(account) # log information
        LogProfit((account['Stocks'] - InitAccount['Stocks']),"Return rates:", ((account['Stocks'] - InitAccount['Stocks']) * 100 / InitAccount['Stocks']),'%')
        Cal(OpenPrice,ClosePrice)
        LastAccount = account

    exchange.SetDirection("buy" if nextState == STATE_LONG else "sell") # The logic of this part is the same as above and will not be elaborated.
    Log(_C(exchange.GetAccount))
    while True:
        ID = pfn( (ticker['Last'] + slidePrice) if nextState == STATE_LONG else (ticker['Last'] - slidePrice), AmountOP)
        Sleep(Interval)
        Log(exchange.GetOrder(ID))
        CancelPendingOrders()
        pos = GetPosition(PD_LONG if nextState == STATE_LONG else PD_SHORT)
        if len(pos) != 0:
            Log("Average price of positions",pos[0]['Price'],"Amount:",pos[0]['Amount'])
            OpenPrice = (exchange.GetOrder(ID))['AvgPrice']
            Log("now account:",exchange.GetAccount())
            break

def onTick(exchange): # The main function of the program, within which the main logic of the program is processed.
    global LastBarTime,chart,State,UpTrack,DownTrack,LastAccount # Define the global scope
    records = exchange.GetRecords() # For the usage of exchange.GetRecords(), please refer to: https://www.fmz.com/api.
    if not records or len(records) <= NPeriod: # Judgment statements to prevent accidents.
        return
    Bar = records[-1] # Take the penultimate element of records K-line data, that is, the last bar.
    if LastBarTime != Bar['Time']:
        HH = TA.Highest(records, NPeriod, 'High')  # Declare the HH variable, call the TA.Highest function to calculate the maximum value of the highest price in the current K-line data NPeriod period and assign it to HH.
        HC = TA.Highest(records, NPeriod, 'Close') # Declare the HC variable to get the maximum value of the closing price in the NPeriod period.
        LL = TA.Lowest(records, NPeriod, 'Low') # Declare the LL variable to get the minimum value of the lowest price in the NPeriod period.
        LC = TA.Lowest(records, NPeriod, 'Close') # Declare LC variable to get the minimum value of the closing price in the NPeriod period. For specific TA-related applications, please refer to the official API documentation.

        Range = max(HH - LC, HC - LL)  # Calculate the range
        UpTrack = _N(Bar['Open'] + (Ks * Range))  # The upper track value is calculated based on the upper track factor Ks of the interface parameters such as the opening price of the latest K-line bar.
        DownTrack = _N(Bar['Open'] - (Kx * Range)) # Calculate the down track value
        if LastBarTime > 0: # Because the value of LastBarTime initialization is set to 0, LastBarTime>0 must be false when running here for the first time. The code in the if block will not be executed, but the code in the else block will be executed.
            PreBar = records[-2] # Declare a variable means "the previous Bar" assigns the value of the penultimate Bar of the current K-line to it.
            chart.add(0, [PreBar['Time'], PreBar['Open'], PreBar['High'], PreBar['Low'], PreBar['Close']], -1) # Call the add function of the chart icon control class to update the K-line data (use the penultimate bar of the obtained K-line data to update the last bar of the icon, because a new K-line bar is generated).
        else:  # For the specific usage of the chart.add function, see the API documentation and the articles in the forum. When the program runs for the first time, it must execute the code in the else block. The main function is to add all the K-lines obtained for the first time to the chart at one time.
            for i in range(len(records) - min(len(records), NPeriod * 3), len(records)): # Here, a for loop is executed. The number of loops uses the minimum of the K-line length and 3 times the NPeriod, which can ensure that the initial K-line will not be drawn too much and too long. Indexes vary from large to small.
                b = records[i] # Declare a temporary variable b to retrieve the K-line bar data with the index of records.length - i for each loop.
                chart.add(0,[b['Time'], b['Open'], b['High'], b['Low'], b['Close']]) # Call the chart.add function to add a K-line bar to the chart. Note that if the last parameter of the add function is passed in -1, it will update the last Bar (column) on the chart. If no parameter is passed in, it will add Bar to the last. After executing the loop of i=2 (i-- already, now it's 1), it will trigger i > 1 for false to stop the loop. It can be seen that the code here only processes the bar of records.length - 2, and the last Bar is not processed.
        chart.add(0,[Bar['Time'], Bar['Open'], Bar['High'], Bar['Low'], Bar['Close']]) # Since the two branches of the above if do not process the bar of records.length - 1, it is processed here. Add the latest Bar to the chart.
        ChartCfg['yAxis']['plotLines'][0]['value'] = UpTrack  # Assign the calculated upper track value to the chart object (different from the chart control object chart) for later display.
        ChartCfg['yAxis']['plotLines'][1]['value'] = DownTrack # Assign lower track value
        ChartCfg['subtitle'] = { # Set subtitle
            'text': 'upper tarck' + str(UpTrack) + 'down track' + str(DownTrack) # Subtitle text setting. The upper and down track values are displayed on the subtitle.
        }
        chart.update(ChartCfg) # Update charts with chart class ChartCfg.
        chart.reset(PeriodShow) # Refresh the PeriodShow variable set according to the interface parameters, and only keep the K-line bar of the number of PeriodShow values.

        LastBarTime = Bar['Time'] # The timestamp of the newly generated Bar is updated to LastBarTime to determine whether the last Bar of the K-line data acquired in the next loop is a newly generated one.
    else: # If LastBarTime is equal to Bar.Time, that is, no new K-line Bar is generated. Then execute the code in {..}.
        chart.add(0,[Bar['Time'], Bar['Open'], Bar['High'], Bar['Low'], Bar['Close']], -1) # Update the last K-line bar on the chart with the last Bar of the current K-line data (the last Bar of the K-line, i.e. the Bar of the current period, is constantly changing).
    LogStatus("Price:", Bar["Close"], "up:", UpTrack, "down:", DownTrack, "wins:", Counter['w'], "losses:", Counter['l'], "Date:", time.time()) # The LogStatus function is called to display the data of the current strategy on the status bar.
    msg = "" # Define a variable msg.
    if State == STATE_IDLE or State == STATE_SHORT: # Judge whether the current state variable State is equal to idle or whether State is equal to short position. In the idle state, it can trigger long position, and in the short position state, it can trigger a long position to be closed and sell the opening position.
        if Bar['Close'] >= UpTrack: # If the closing price of the current K-line is greater than the upper track value, execute the code in the if block.
            msg = "Go long, trigger price:" + str(Bar['Close']) + "upper track" + str(UpTrack) # Assign a value to msg and combine the values to be displayed into a string.
            Log(msg) # message
            Trade(State, STATE_LONG) # Call the Trade function above to trade.
            State = STATE_LONG # Regardless of opening long positions or selling the opening position, the program status should be updated to hold long positions at the moment.
            chart.add(1,{'x': Bar['Time'], 'color': 'red', 'shape': 'flag', 'title': 'long', 'text': msg}) # Add a marker to the corresponding position of the K-line to show the open long position.

    if State == STATE_IDLE or State == STATE_LONG: # The short direction is the same as the above, and will not be repeated. The code is exactly the same.
        if Bar['Close'] <= DownTrack:
            msg = "Go short, trigger price:" + str(Bar['Close']) + "down track" + str(DownTrack)
            Log(msg)
            Trade(State, STATE_SHORT)
            State = STATE_SHORT
            chart.add(1,{'x': Bar['Time'], 'color': 'green', 'shape': 'circlepin', 'title': 'short', 'text': msg})

OpenPrice = 0 # Initialize OpenPrice and ClosePrice
ClosePrice = 0
def Cal(OpenPrice, ClosePrice): # Define a Cal function to calculate the profit and loss of the strategy after it has been run.
    global AmountOP,State
    if State == STATE_SHORT:
        Log(AmountOP,OpenPrice,ClosePrice,"Profit and loss of the strategy:", (AmountOP * 100) / ClosePrice - (AmountOP * 100) / OpenPrice, "Currencies, service charge:", - (100 * AmountOP * 0.0003), "USD, equivalent to:", _N( - 100 * AmountOP * 0.0003/OpenPrice,8), "Currencies")
        Log(((AmountOP * 100) / ClosePrice - (AmountOP * 100) / OpenPrice) + (- 100 * AmountOP * 0.0003/OpenPrice))
    if State == STATE_LONG:
        Log(AmountOP,OpenPrice,ClosePrice,"Profit and loss of the strategy:", (AmountOP * 100) / OpenPrice - (AmountOP * 100) / ClosePrice, "Currencies, service charge:", - (100 * AmountOP * 0.0003), "USD, equivalent to:", _N( - 100 * AmountOP * 0.0003/OpenPrice,8), "Currencies")
        Log(((AmountOP * 100) / OpenPrice - (AmountOP * 100) / ClosePrice) + (- 100 * AmountOP * 0.0003/OpenPrice))

def main(): # The main function of the strategy program. (entry function)
    global LoopInterval,chart,LastAccount,InitAccount # Define the global scope
    if exchange.GetName() != 'Futures_OKCoin':  # Judge if the name of the added exchange object (obtained by the exchange.GetName function) is not equal to 'Futures_OKCoin', that is, the object added is not OKCoin futures exchange object.
        raise Error_noSupport # Throw an exception
    exchange.SetRate(1) # Set various parameters of the exchange.
    exchange.SetContractType(["this_week","next_week","quarter"][ContractTypeIdx])  # Determine which specific contract to trade.
    exchange.SetMarginLevel([10,20][MarginLevelIdx]) # Set the margin rate, also known as leverage.

    if len(exchange.GetPosition()) > 0: # Set up fault tolerance mechanism.
        raise Error_AtBeginHasPosition
    CancelPendingOrders()
    InitAccount = LastAccount = exchange.GetAccount()
    LoopInterval = min(1,LoopInterval)
    Log("Trading platforms:",exchange.GetName(), InitAccount)
    LogStatus("Ready...")

    LogProfitReset()
    chart = Chart(ChartCfg)
    chart.reset()

    LoopInterval = max(LoopInterval, 1)
    while True: # Loop the whole transaction logic and call the onTick function.
        onTick(exchange)
        Sleep(LoopInterval * 1000) # Take a break to prevent the API from being accessed too frequently and the account from being blocked.
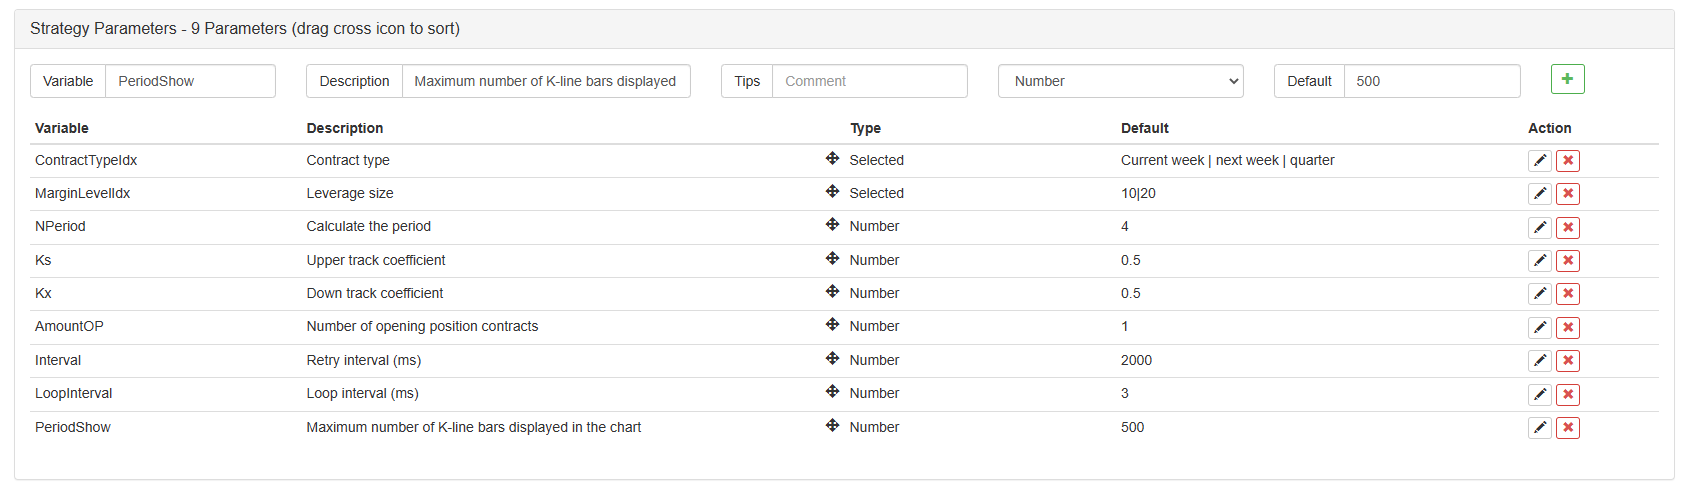
Sau khi viết mã, xin lưu ý rằng chúng tôi chưa hoàn thành toàn bộ chiến lược. Tiếp theo, chúng tôi cần thêm các tham số được sử dụng trong chiến lược vào trang chỉnh sửa chiến lược. Phương pháp thêm rất đơn giản. Chỉ cần nhấp vào dấu cộng ở cuối hộp thoại viết chiến lược để thêm một lần một lần.
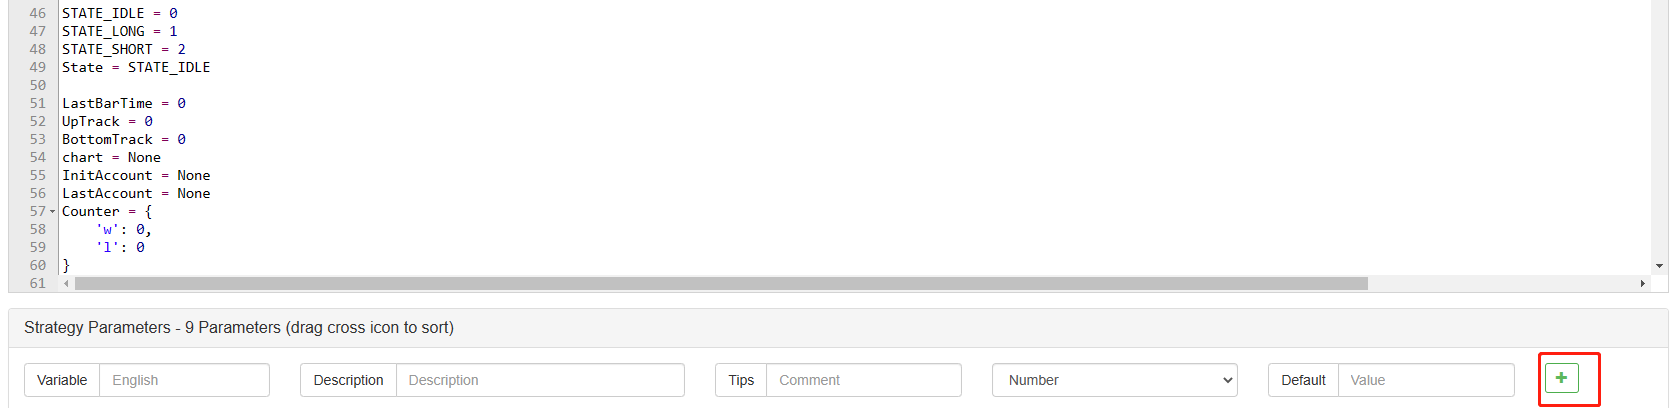
Nội dung cần thêm:
Cho đến nay, cuối cùng chúng ta đã hoàn thành việc viết chiến lược.
Kiểm tra lại chiến lược
Sau khi viết chiến lược, điều đầu tiên chúng ta cần làm là kiểm tra lại để xem nó hoạt động như thế nào trong dữ liệu lịch sử. Nhưng xin lưu ý rằng kết quả của kiểm tra lại không bằng với dự đoán tương lai. Việc kiểm tra lại chỉ có thể được sử dụng như một tham chiếu để xem xét hiệu quả của chiến lược của chúng ta. Một khi thị trường thay đổi và chiến lược bắt đầu có tổn thất lớn, chúng ta nên tìm ra vấn đề kịp thời, và sau đó thay đổi chiến lược để thích nghi với môi trường thị trường mới, chẳng hạn như ngưỡng đã đề cập ở trên. Nếu chiến lược có lỗ lớn hơn 10%, chúng ta nên ngay lập tức ngừng hoạt động của chiến lược, và sau đó tìm ra vấn đề. Chúng ta có thể bắt đầu điều chỉnh ngưỡng.
Nhấp vào backtest trong trang chỉnh sửa chiến lược. Trên trang backtest, việc điều chỉnh các tham số có thể được thực hiện thuận tiện và nhanh chóng theo nhu cầu khác nhau. Đặc biệt đối với chiến lược có logic phức tạp và nhiều tham số, không cần phải quay lại mã nguồn và sửa đổi một lần.
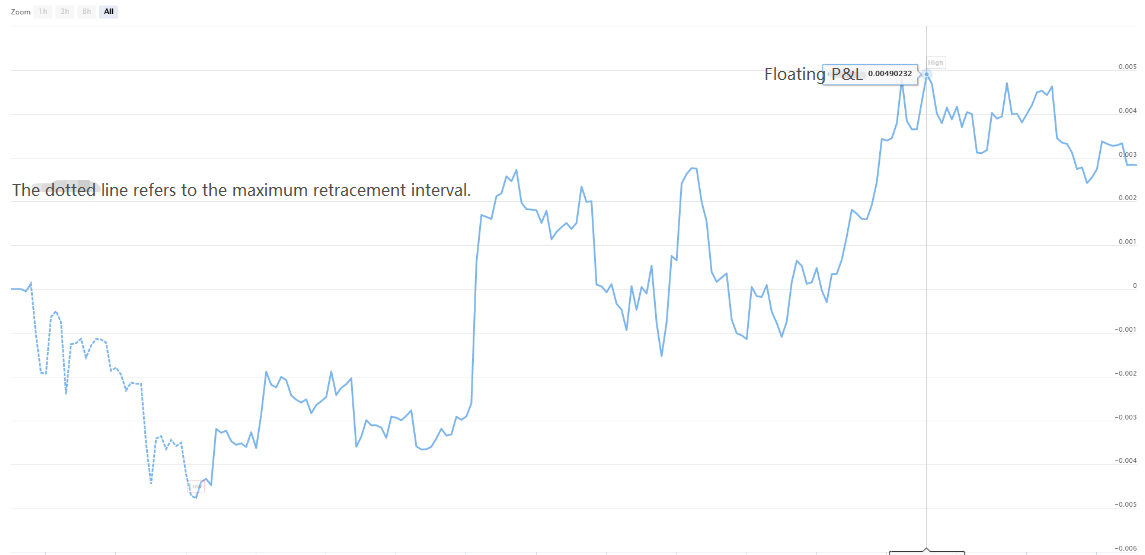
Thời gian backtest là sáu tháng gần đây nhất.
Có thể thấy rằng chiến lược đã thu được lợi nhuận tốt trong sáu tháng qua do xu hướng đơn phương rất tốt của BTC.

Nếu bạn có bất kỳ câu hỏi nào, bạn có thể để lại tin nhắn tạihttps://www.fmz.com/bbs, cho dù đó là về chiến lược hoặc công nghệ của nền tảng, nền tảng FMZ Quant có các chuyên gia sẵn sàng trả lời câu hỏi của bạn.
- Xác định số lượng phân tích cơ bản trong thị trường tiền điện tử: Hãy để dữ liệu nói cho chính nó!
- Các nghiên cứu định lượng cơ bản của vòng đồng tiền - đừng tin vào những giáo viên mờ nhạt, nói khách quan về dữ liệu!
- Một công cụ thiết yếu trong lĩnh vực giao dịch định lượng - nhà phát minh mô-đun khám phá dữ liệu định lượng
- Kiểm soát mọi thứ - giới thiệu về FMZ Phiên bản mới của Terminal giao dịch (với mã nguồn TRB Arbitrage)
- Có tất cả các thông tin về FMZ phiên bản mới của giao dịch đầu cuối (được thêm mã nguồn TRB)
- FMZ Quant: Phân tích các ví dụ thiết kế yêu cầu chung trong thị trường tiền điện tử (II)
- Làm thế nào để khai thác robot bán hàng không có não với một chiến lược tần số cao trong 80 dòng mã
- FMZ định lượng: Phân tích các trường hợp thiết kế nhu cầu phổ biến của thị trường tiền điện tử (II)
- Cách khai thác robot vô trí tuệ để bán bằng chiến lược tần số cao 80 dòng mã
- FMZ Quant: Phân tích các ví dụ thiết kế yêu cầu chung trong thị trường tiền điện tử (I)
- FMZ định lượng: Các nhu cầu phổ biến của thị trường tiền điện tử