Xu hướng chuyển động
Tác giả:ChaoZhang, Ngày: 31-5-2022 18:43:20Tags:Xu hướngTrục
Xin chào các thương nhân.
Một ý tưởng độc đáo khác ở đây với bạn. thực tế tôi có thể nói rằng nó là một chiến lược breakout sử dụng nhiều điểm trung bình Pivot.
Làm thế nào nó hoạt động?
- nó tìm thấy các điểm Pivot, bạn có thể đặt chiều dài như bạn muốn
- nó nhận được trung bình của Pivot Highs và Pivot Lows, bạn có thể thiết lập số lượng các điểm Pivot được bao gồm
- nó so sánh giá đóng cửa hiện tại với mức trung bình của Pivot Highs và Pivot Lows
- nếu cả hai đều dương tính hoặc âm tính thì xu hướng thay đổi
Anh có hai lựa chọn:
- Pivot Point Period => là chiều dài được sử dụng để tìm Pivot Points. có nghĩa là nó kiểm tra thanh trái / phải nếu nó là Pivot Point (4 theo mặc định)
- Số PP để kiểm tra => là số điểm Pivot mà kịch bản tìm thấy và tính toán trung bình (3 theo mặc định)
backtest
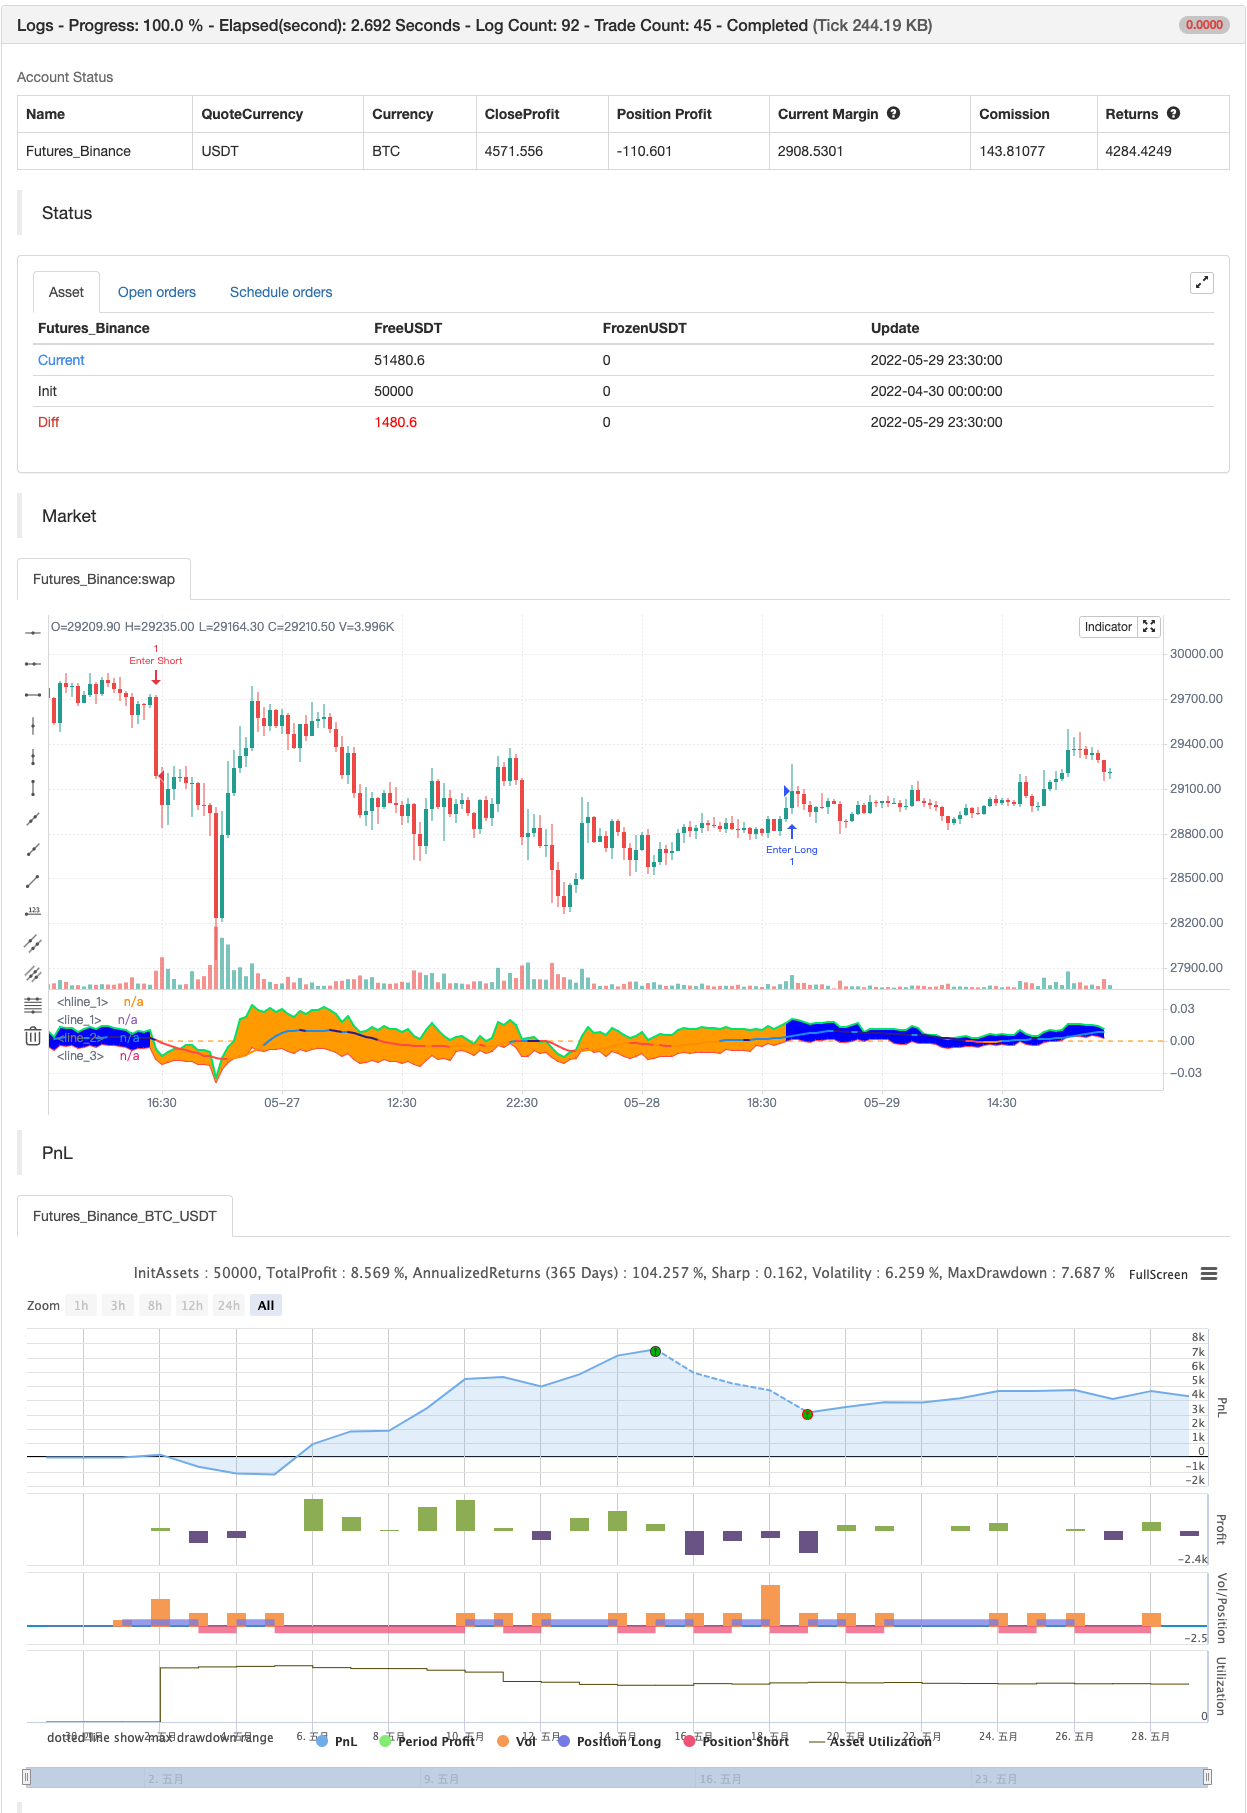
/*backtest
start: 2022-04-30 00:00:00
end: 2022-05-29 23:59:00
period: 30m
basePeriod: 15m
exchanges: [{"eid":"Futures_Binance","currency":"BTC_USDT"}]
*/

// This source code is subject to the terms of the Mozilla Public License 2.0 at https://mozilla.org/MPL/2.0/
// © LonesomeTheBlue

//@version=4
study("Pivot Trend", precision = 2, explicit_plot_zorder = true)
prd = input(defval = 4, title="Pivot Point Period", minval = 1, maxval = 30)
pnum = input(defval = 3, title="number of PP to check", minval = 1, maxval = 30)
colup = input(defval = color.blue, title = "Colors", inline = "col")
coldn = input(defval = color.orange, title = "", inline = "col")

float ph = pivothigh(prd, prd)
float pl = pivotlow(prd, prd)
var ph_lev = array.new_float(pnum, na)
var pl_lev = array.new_float(pnum, na)

if ph
    array.unshift(ph_lev, ph)
    array.pop(ph_lev)

if pl
    array.unshift(pl_lev, pl)
    array.pop(pl_lev)

float lrate = 0.0
for i = 0 to array.size(pl_lev) - 1
    float rate = (close - array.get(pl_lev, i)) / array.get(pl_lev, i)
    lrate += (rate / pnum)


float hrate = 0.0
for i = 1 to array.size(ph_lev) - 1
    float rate = (close - array.get(ph_lev, i)) / array.get(ph_lev, i)
    hrate += (rate / pnum)

hline(0.)
hln = plot(hrate, color = color.red, linewidth = 2)
lln = plot(lrate, color = color.lime, linewidth = 2)

trend = 0
trend := hrate > 0 and lrate > 0 ? 1 : hrate < 0 and lrate < 0 ? -1 : nz(trend[1])
tcolor = trend == 1 ? color.new(colup, 40) : color.new(coldn, 40)
fill(hln, lln, color = tcolor)

mid = sma((hrate + lrate) / 2, 9)
plot(mid, color = mid >= 0 ? mid >= mid[1] ? color.blue : color.navy : mid <= mid[1] ? color.red : color.orange, linewidth = 2)

alertcondition(change(trend) > 0, title='Pivot Trend UP', message='Pivot Trend UP')
alertcondition(change(trend) < 0, title='Pivot Trend DOWN', message='Pivot Trend DOWN')

if change(trend) > 0
    strategy.entry("Enter Long", strategy.long)
else if change(trend) < 0
    strategy.entry("Enter Short", strategy.short)
Có liên quan
- Các khối thứ tự trục trục
- Tiêu chí tối đa và tối thiểu dựa trên pivot
- Lợi nhuận hàng tháng trong các chiến lược PineScript
- Điểm trục cao thấp nhiều khung thời gian
- Bản đồ nhiệt theo trình tự Tom DeMark
- Xu hướng kim cương
- Mô hình thời gian Fibonacci
- Xu hướng tuyến tính
- Xu hướng Heikin-Ashi
- Các điểm đảo ngược Demark
Thêm nữa
- Hệ thống giao dịch swing chính xác
- Xu hướng tuyến tính
- Mô hình thời gian Fibonacci
- Darvas Box mua bán
- Chỉ số thiết lập Demark
- Bollinger Bands Stochastic RSI cực
- Chỉ số AK MACD BB V 1.00
- SAR Parabolic
- Chỉ số RSI Divergence
- Chỉ số OBV MACD
- Chiến lược chênh lệch giá v1.0
- Sự phá vỡ hỗ trợ-kháng cự
- Đường trung bình động thích nghi độ dốc
- Chiến lược dao động Delta-RSI
- Low Scanner chiến lược crypto
- [blackcat] L2 Reversal Label Chiến lược
- SuperB
- SAR cao thấp
- SuperTREX
- Máy phát hiện đỉnh