SAR Parabolic
Tác giả:ChaoZhang, Ngày: 2022-05-31 19:01:00Tags:SAR
Đây là một thiết kế lại của chỉ số SAR Parabolic tích hợp. Tôi đã thêm một hệ thống đầu vào thích hợp, một tùy chọn để làm nổi bật các điểm ban đầu cho cả hai đường và một tùy chọn để chọn chiều rộng điểm. Vì vậy, tùy chỉnh nó như bạn muốn.
Parabolic SAR ban đầu được phát triển bởi J. Welles Wilder và được mô tả trong cuốn sách của ông
Để biết các thiết lập cho PSAR là có lợi nhất trên công cụ của bạn và khung thời gian bạn có thể sử dụng công cụ này
backtest
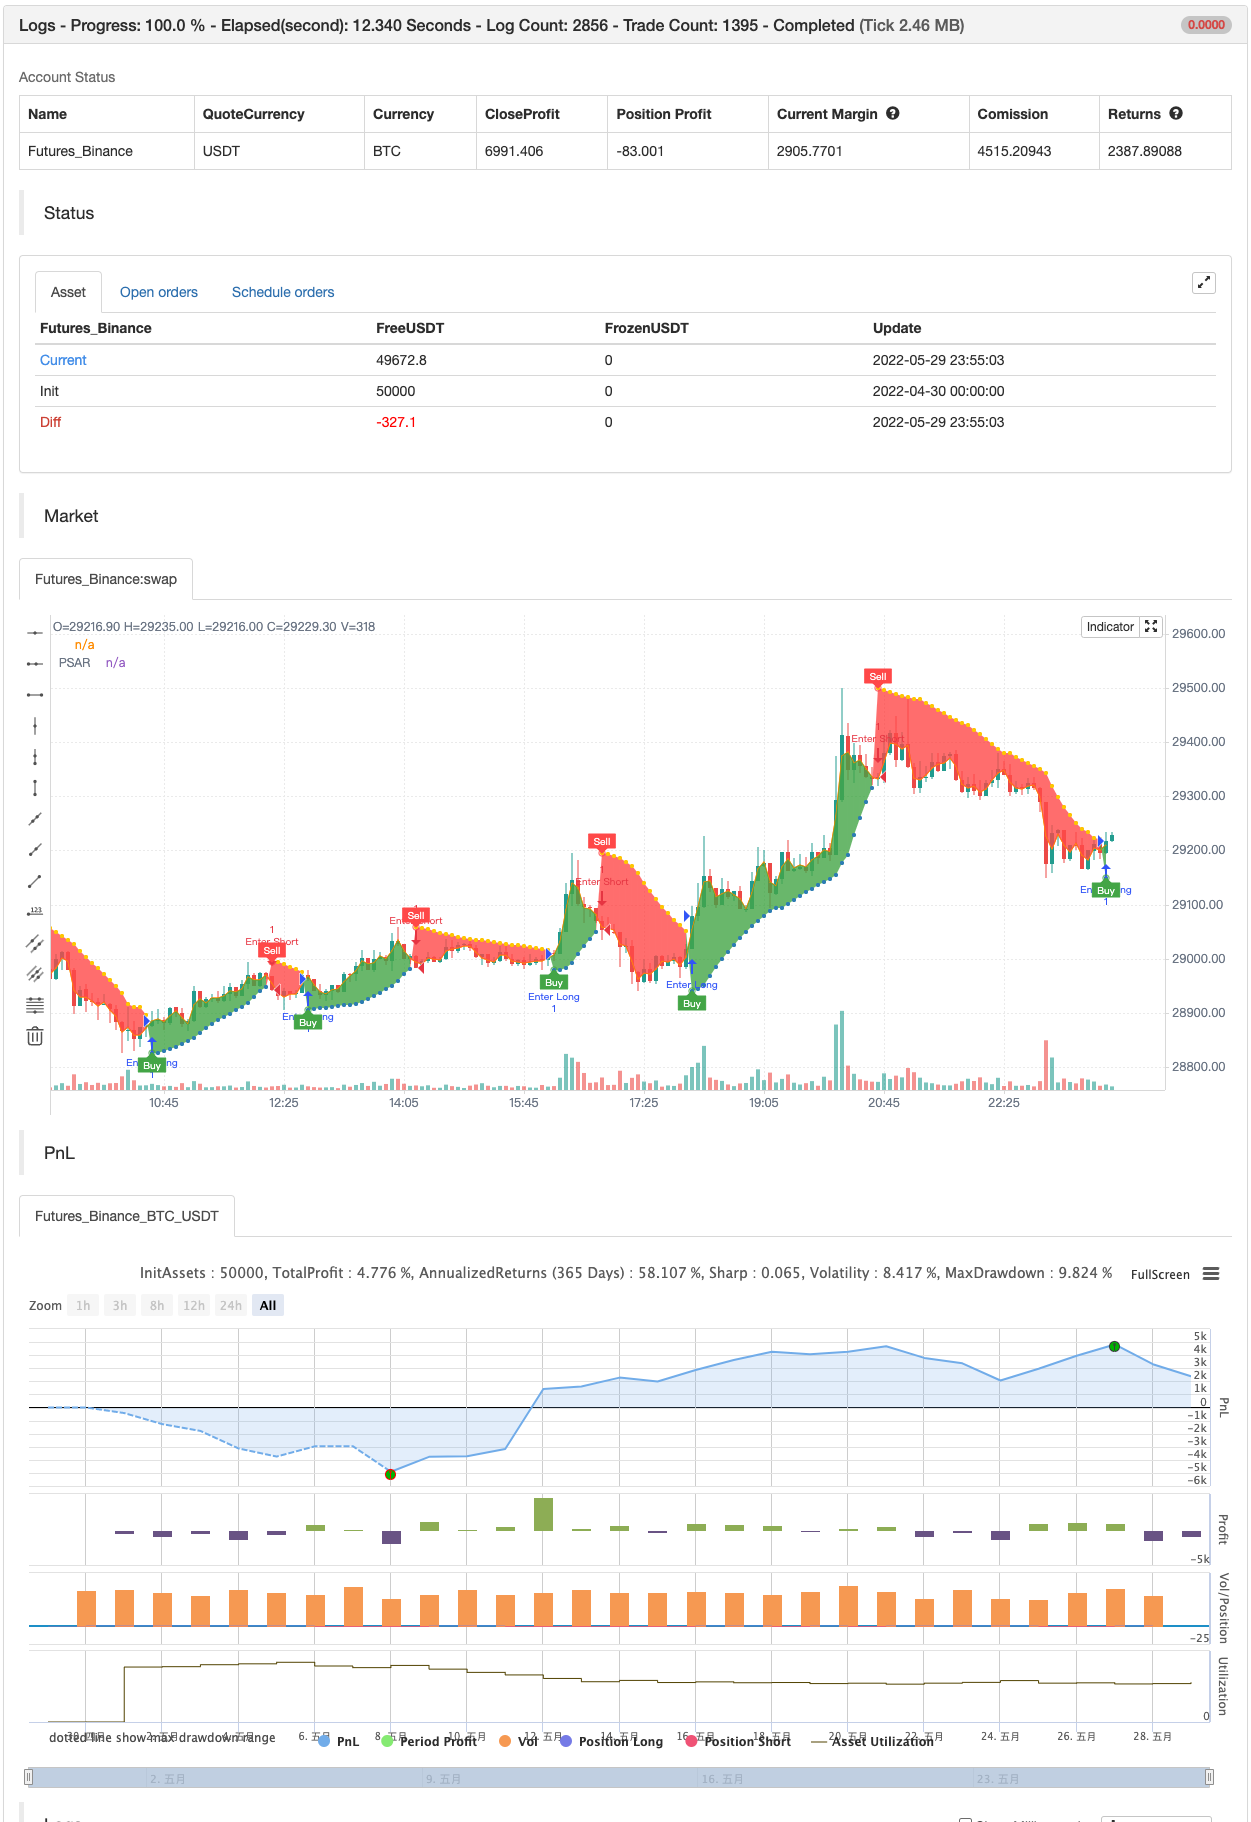
/*backtest
start: 2022-04-30 00:00:00
end: 2022-05-29 23:59:00
period: 5m
basePeriod: 1m
exchanges: [{"eid":"Futures_Binance","currency":"BTC_USDT"}]
*/

//@version=4
// Copyright (c) 2019-present, Alex Orekhov (everget)
// Parabolic SAR script may be freely distributed under the terms of the GPL-3.0 license.
study("Parabolic SAR", shorttitle="PSAR", overlay=true)

start = input(title="Start", type=input.float, step=0.001, defval=0.02)
increment = input(title="Increment", type=input.float, step=0.001, defval=0.02)
maximum = input(title="Maximum", type=input.float, step=0.01, defval=0.2)
width = input(title="Point Width", type=input.integer, minval=1, defval=2)
highlightStartPoints = input(title="Highlight Start Points ?", type=input.bool, defval=true)
showLabels = input(title="Show Buy/Sell Labels ?", type=input.bool, defval=true)
highlightState = input(title="Highlight State ?", type=input.bool, defval=true)

psar = sar(start, increment, maximum)
dir = psar < close ? 1 : -1

psarColor = dir == 1 ? #3388bb : #fdcc02
psarPlot = plot(psar, title="PSAR", style=plot.style_circles, linewidth=width, color=psarColor, transp=0)

var color longColor = color.green
var color shortColor = color.red

buySignal = dir == 1 and dir[1] == -1
plotshape(buySignal and highlightStartPoints ? psar : na, title="Long Start", location=location.absolute, style=shape.circle, size=size.tiny, color=longColor, transp=0)
plotshape(buySignal and showLabels ? psar : na, title="Buy Label", text="Buy", location=location.absolute, style=shape.labelup, size=size.tiny, color=longColor, textcolor=color.white, transp=0)

sellSignal = dir == -1 and dir[1] == 1
plotshape(sellSignal and highlightStartPoints ? psar : na, title="Short Start", location=location.absolute, style=shape.circle, size=size.tiny, color=shortColor, transp=0)
plotshape(sellSignal and showLabels ? psar : na, title="Sell Label", text="Sell", location=location.absolute, style=shape.labeldown, size=size.tiny, color=shortColor, textcolor=color.white, transp=0)

midPricePlot = plot(ohlc4, title="", display=display.none)

fillColor = highlightState ? (dir == 1 ? longColor : shortColor) : na
fill(midPricePlot, psarPlot, title="Trade State Filling", color=fillColor)

changeCond = dir != dir[1]
alertcondition(changeCond, title="Alert: PSAR Direction Change", message="PSAR has changed direction!")
alertcondition(buySignal, title="Alert: PSAR Long", message="PSAR Long")
alertcondition(sellSignal, title="Alert: PSAR Short", message="PSAR Sell")


if buySignal
    strategy.entry("Enter Long", strategy.long)
else if sellSignal
    strategy.entry("Enter Short", strategy.short)
Có liên quan
- Lý thuyết sóng Elliott 4-9 Sóng xung phát hiện tự động Chiến lược giao dịch
- SAR - cao và thấp
- SAR cao thấp
- SAR Parabolic Mua và bán
- 15MIN BTCUSDTPERP BOT
Thêm nữa
- TUE ADX/MACD Confluence V1.0
- Bộ lọc phạm vi đôi
- SAR - cao và thấp
- Hệ thống giao dịch swing chính xác
- Xu hướng tuyến tính
- Mô hình thời gian Fibonacci
- Darvas Box mua bán
- Chỉ số thiết lập Demark
- Bollinger Bands Stochastic RSI cực
- Chỉ số AK MACD BB V 1.00
- Chỉ số RSI Divergence
- Chỉ số OBV MACD
- Xu hướng chuyển động
- Chiến lược chênh lệch giá v1.0
- Sự phá vỡ hỗ trợ-kháng cự
- Đường trung bình động thích nghi độ dốc
- Chiến lược dao động Delta-RSI
- Low Scanner chiến lược crypto
- [blackcat] L2 Reversal Label Chiến lược
- SuperB