TMA Overlay

Author: ChaoZhang, Date: 2022-05-07 17:41:05
Tags: sma

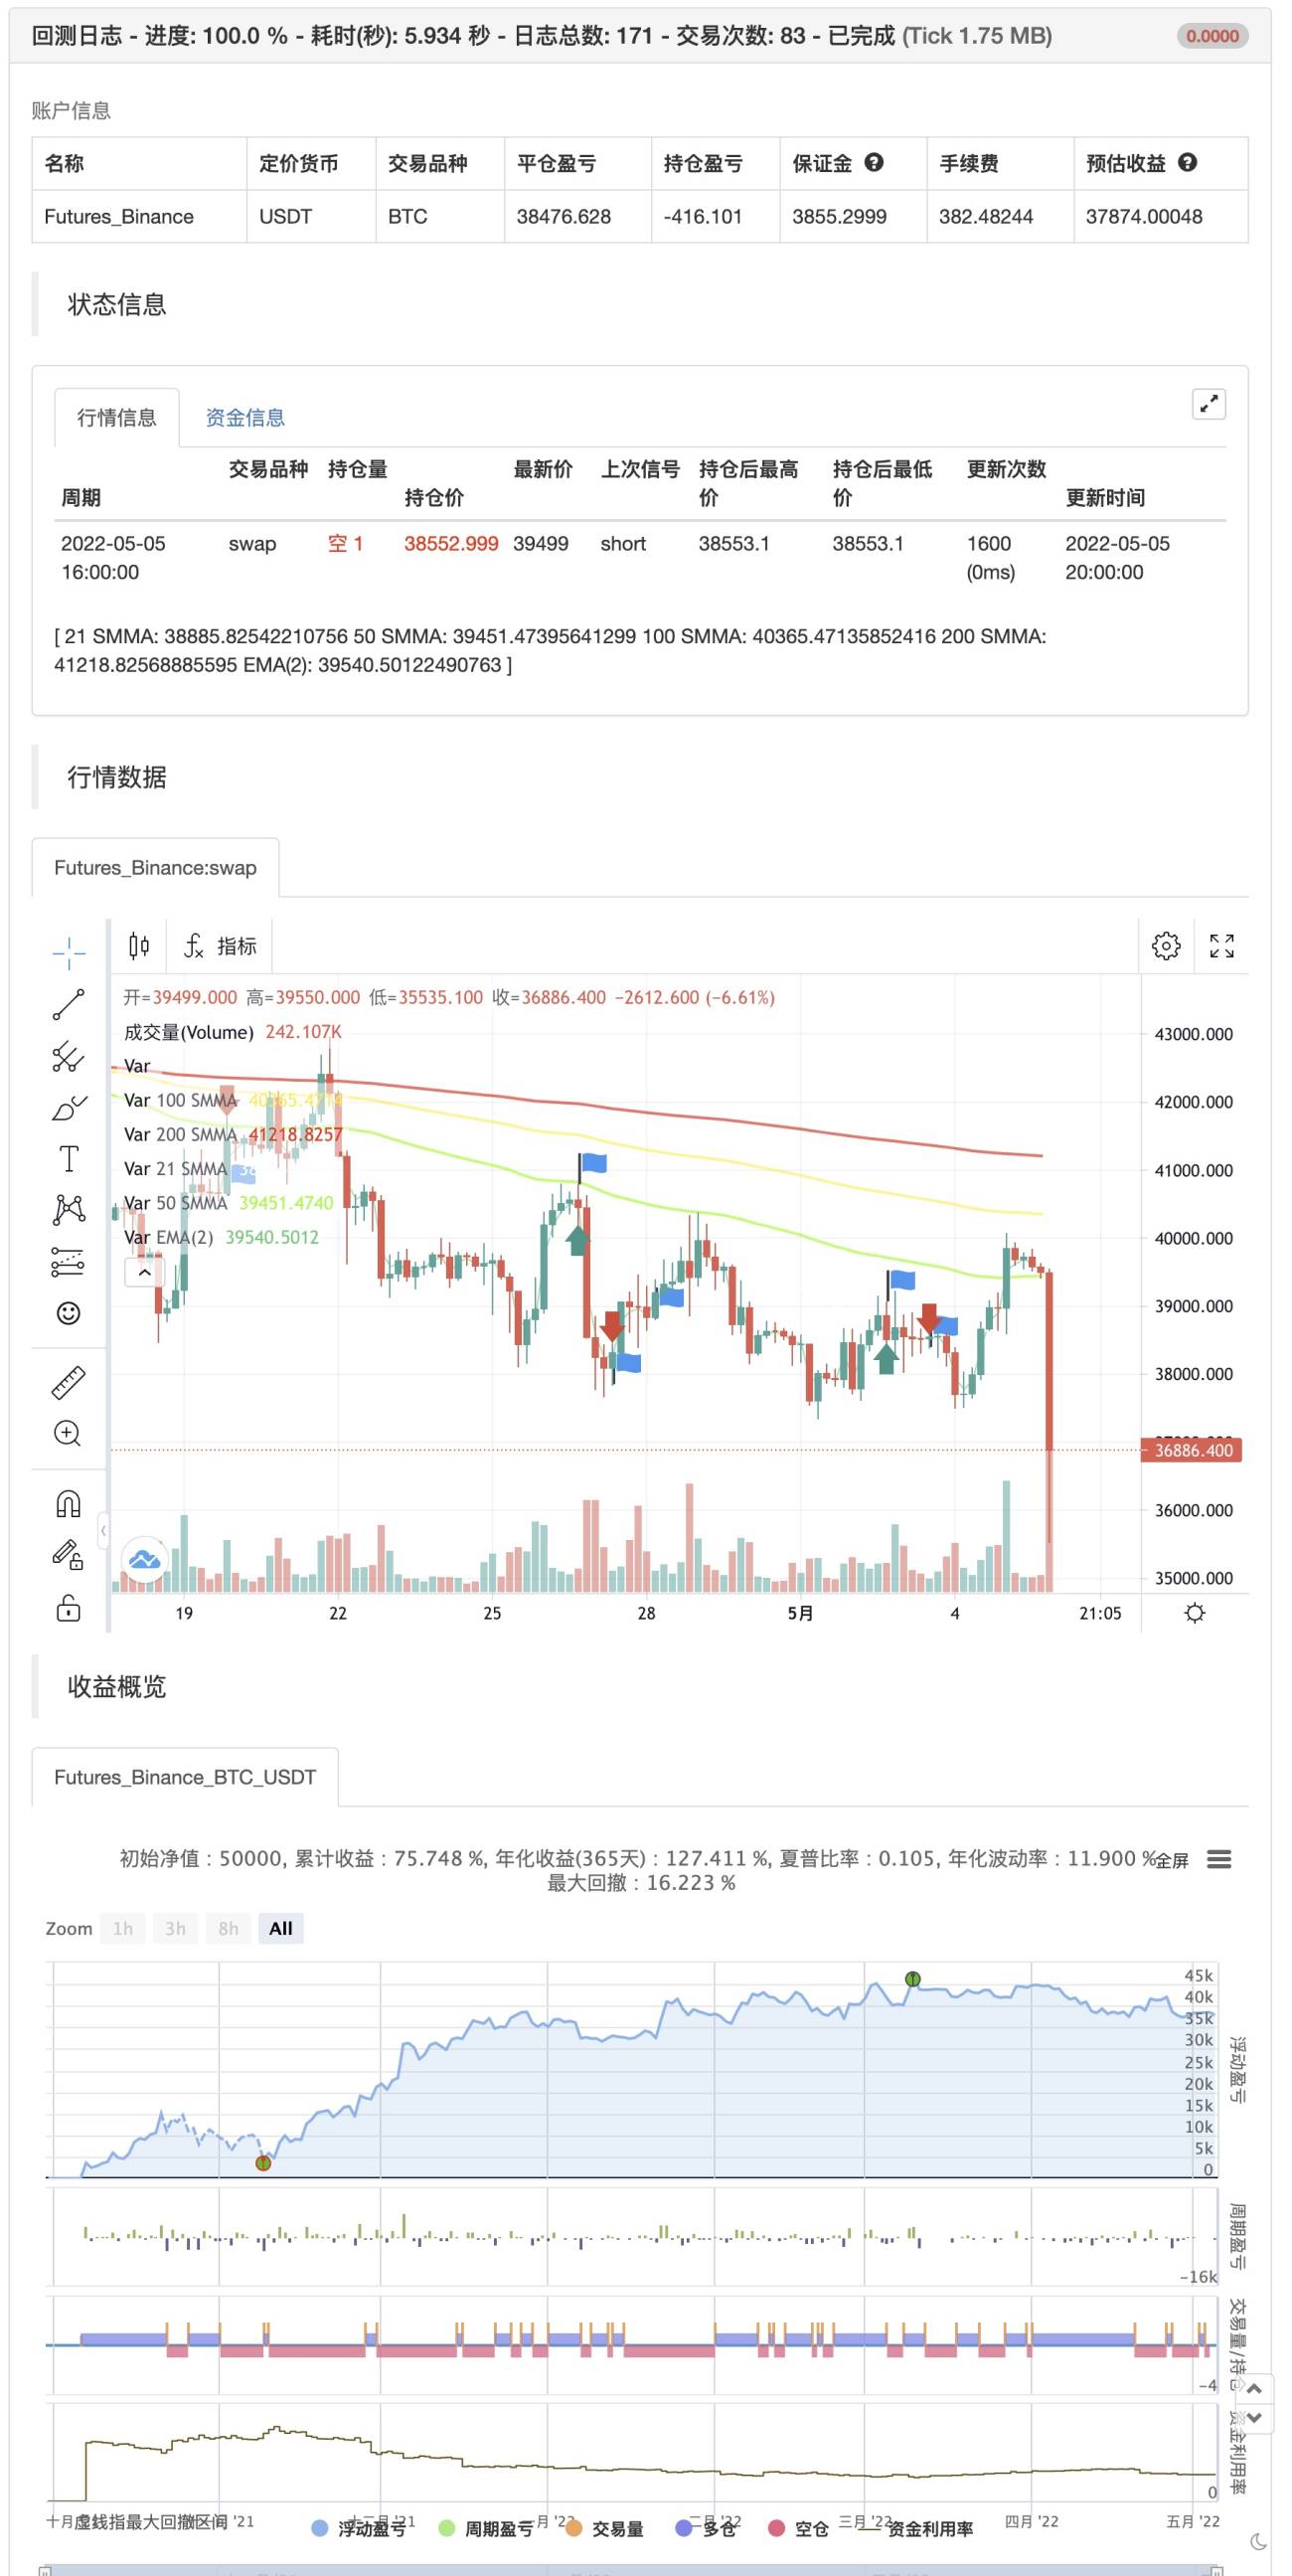
This indicator help identify momentum by offering a visual representation of engulfing candlestick patters overlayed with smoothed moving averages

backtest

img


/*backtest
start: 2021-10-01 00:00:00
end: 2022-05-05 23:59:00
period: 4h
basePeriod: 15m
exchanges: [{"eid":"Futures_Binance","currency":"BTC_USDT"}]
*/

//@version=4
study(title="TMA Overlay", shorttitle="TMA Overlay", overlay=true)

// ### Four Smoothed Moving Averages

len1 = 21
//input(21, minval=1, title="Length 1", group = "Smoothed MA Inputs")
src1 = close
//input(close, title="Source 1", group = "Smoothed MA Inputs")
smma1 = 0.0
sma_1 = sma(src1, len1)
smma1 := na(smma1[1]) ? sma_1 : (smma1[1] * (len1 - 1) + src1) / len1
plot(smma1, color=color.white, linewidth=2, title="21 SMMA")

len2 = 50
//input(50, minval=1, title="Length 2", group = "Smoothed MA Inputs")
src2 = close
//input(close, title="Source 2", group = "Smoothed MA Inputs")
smma2 = 0.0
sma_2 = sma(src2, len2)
smma2 := na(smma2[1]) ? sma_2 : (smma2[1] * (len2 - 1) + src2) / len2
plot(smma2, color=color.new(#6aff00,0), linewidth=2, title="50 SMMA")

h100 = input(title="Show 100 Line", type=input.bool, defval=true, group = "Smoothed MA Inputs")
len3 = 100
//input(100, minval=1, title="Length 3", group = "Smoothed MA Inputs")
src3 = close
//input(close, title="Source 3", group = "Smoothed MA Inputs")
smma3 = 0.0
sma_3 = sma(src3, len3)
smma3 := na(smma3[1]) ? sma_3 : (smma3[1] * (len3 - 1) + src3) / len3
sma3plot = plot(h100 ? smma3 : na, color=color.new(color.yellow,0), linewidth=2, title="100 SMMA")

len4 = 200
//input(200, minval=1, title="Length 4", group = "Smoothed MA Inputs")
src4 = close
//input(close, title="Source 4", group = "Smoothed MA Inputs")
smma4 = 0.0
sma_4 = sma(src4, len4)
smma4 := na(smma4[1]) ? sma_4 : (smma4[1] * (len4 - 1) + src4) / len4
sma4plot = plot(smma4, color=color.new(#ff0500,0), linewidth=2, title="200 SMMA")

// Trend Fill

trendFill = input(title="Show Trend Fill", type=input.bool, defval=true, group = "Smoothed MA Inputs") 
ema2 = ema(close, 2)
ema2plot = plot(ema2, color=#2ecc71, transp=100, style=plot.style_line, linewidth=1, title="EMA(2)", editable = false)

//fill(ema2plot, sma4plot, color=ema2 > smma4 and trendFill ? color.green : ema2 < smma4 and trendFill ? color.red : na, transp=85, title = "Trend Fill")

// End ###

// ### 3 Line Strike

bearS = input(title="Show Bearish 3 Line Strike", type=input.bool, defval=true, group = "3 Line Strike")
bullS = input(title="Show Bullish 3 Line Strike", type=input.bool, defval=true, group = "3 Line Strike")

bearSig = close[3] > open[3] and close[2] > open[2] and close[1] > open[1] and close < open[1]
bullSig = close[3] < open[3] and close[2] < open[2] and close[1] < open[1] and close > open[1]

if bullSig
    strategy.entry("entry short", strategy.short)
else if bearSig
    strategy.entry("entry long", strategy.long)


plotshape(bullS ? bullSig : na, style=shape.triangleup, color=color.green, location=location.belowbar, size = size.small,  text="3s-Bull", title="3 Line Strike Up")
plotshape(bearS ? bearSig : na, style=shape.triangledown, color=color.red, location=location.abovebar, size = size.small,  text="3s-Bear", title="3 Line Strike Down")


// End ###


Related

More