Moving Average Buy-Sell

Author: ChaoZhang, Date: 2022-05-09 23:19:01
Tags: EMA

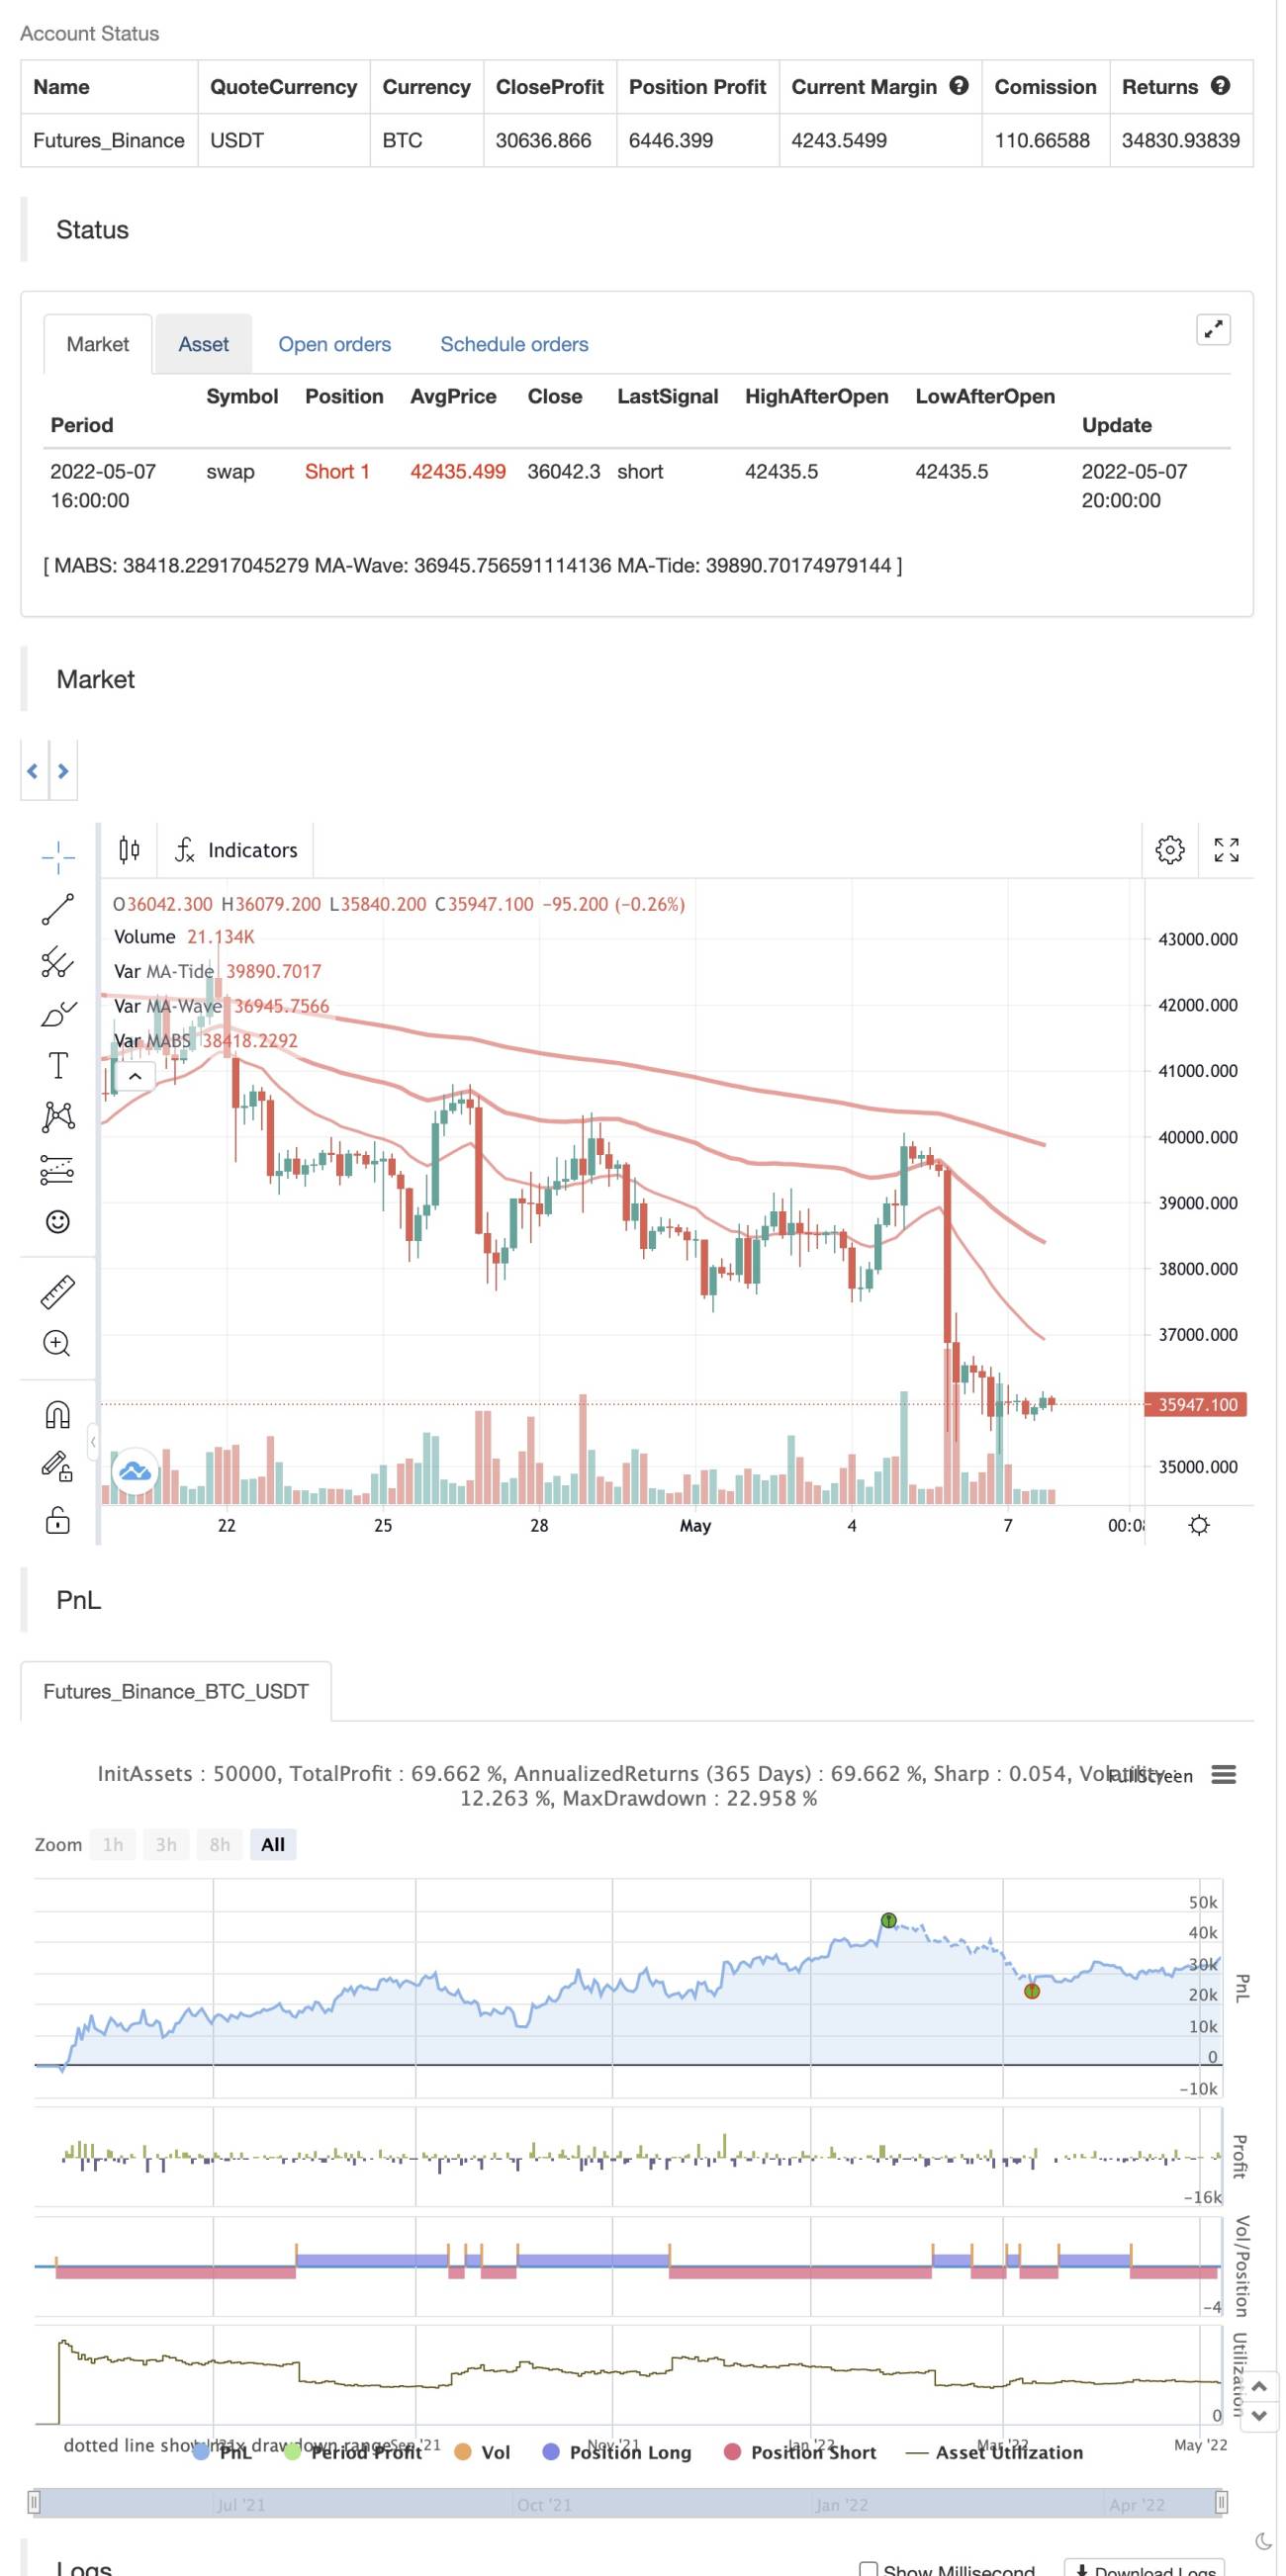
Takes two moving averages of different lengths to formulate buy/sell colors on average EMA .

backtest

img


/*backtest
start: 2021-05-08 00:00:00
end: 2022-05-07 23:59:00
period: 4h
basePeriod: 15m
exchanges: [{"eid":"Futures_Binance","currency":"BTC_USDT"}]
*/

// This source code is subject to the terms of the Mozilla Public License 2.0 at https://mozilla.org/MPL/2.0/
// © dannhau2

//@version=5
indicator(title="Moving Average Buy-Sell", shorttitle="MABS", overlay=true, timeframe="", timeframe_gaps=true)

Wave = ta.ema(input(close, title="Source"), input.int(20, minval=1, title="Length Wave"))
Tide = ta.ema(input(close, title="Source"), input.int(200, minval=1, title="Length Tide"))
AVG = (Wave + Tide)/2

Up = ta.crossover(Wave, Tide)
Down = ta.crossover(Tide,Wave)

var col = color.red

if Up
    col := color.lime

if Down
    col := color.red


P1=plot(AVG, title="MABS", color=col, linewidth = 3, display=display.none)
P2=plot(Wave, title="MA-Wave", color=col, linewidth = 2)
P3=plot(Tide, title="MA-Tide", color=col, linewidth = 3)

fill(P2, P3, color= Wave > Tide ? color.new(color.lime,70):color.new(color.red, 70))

alertcondition(Up, title="Trend Changed Positive", message="Trend Changed Positive")
alertcondition(Down, title="Trend Changed Negative", message="Trend Changed Negative")

if Up
    strategy.entry("Enter Long", strategy.long)
else if Down
    strategy.entry("Enter Short", strategy.short)

Related

More