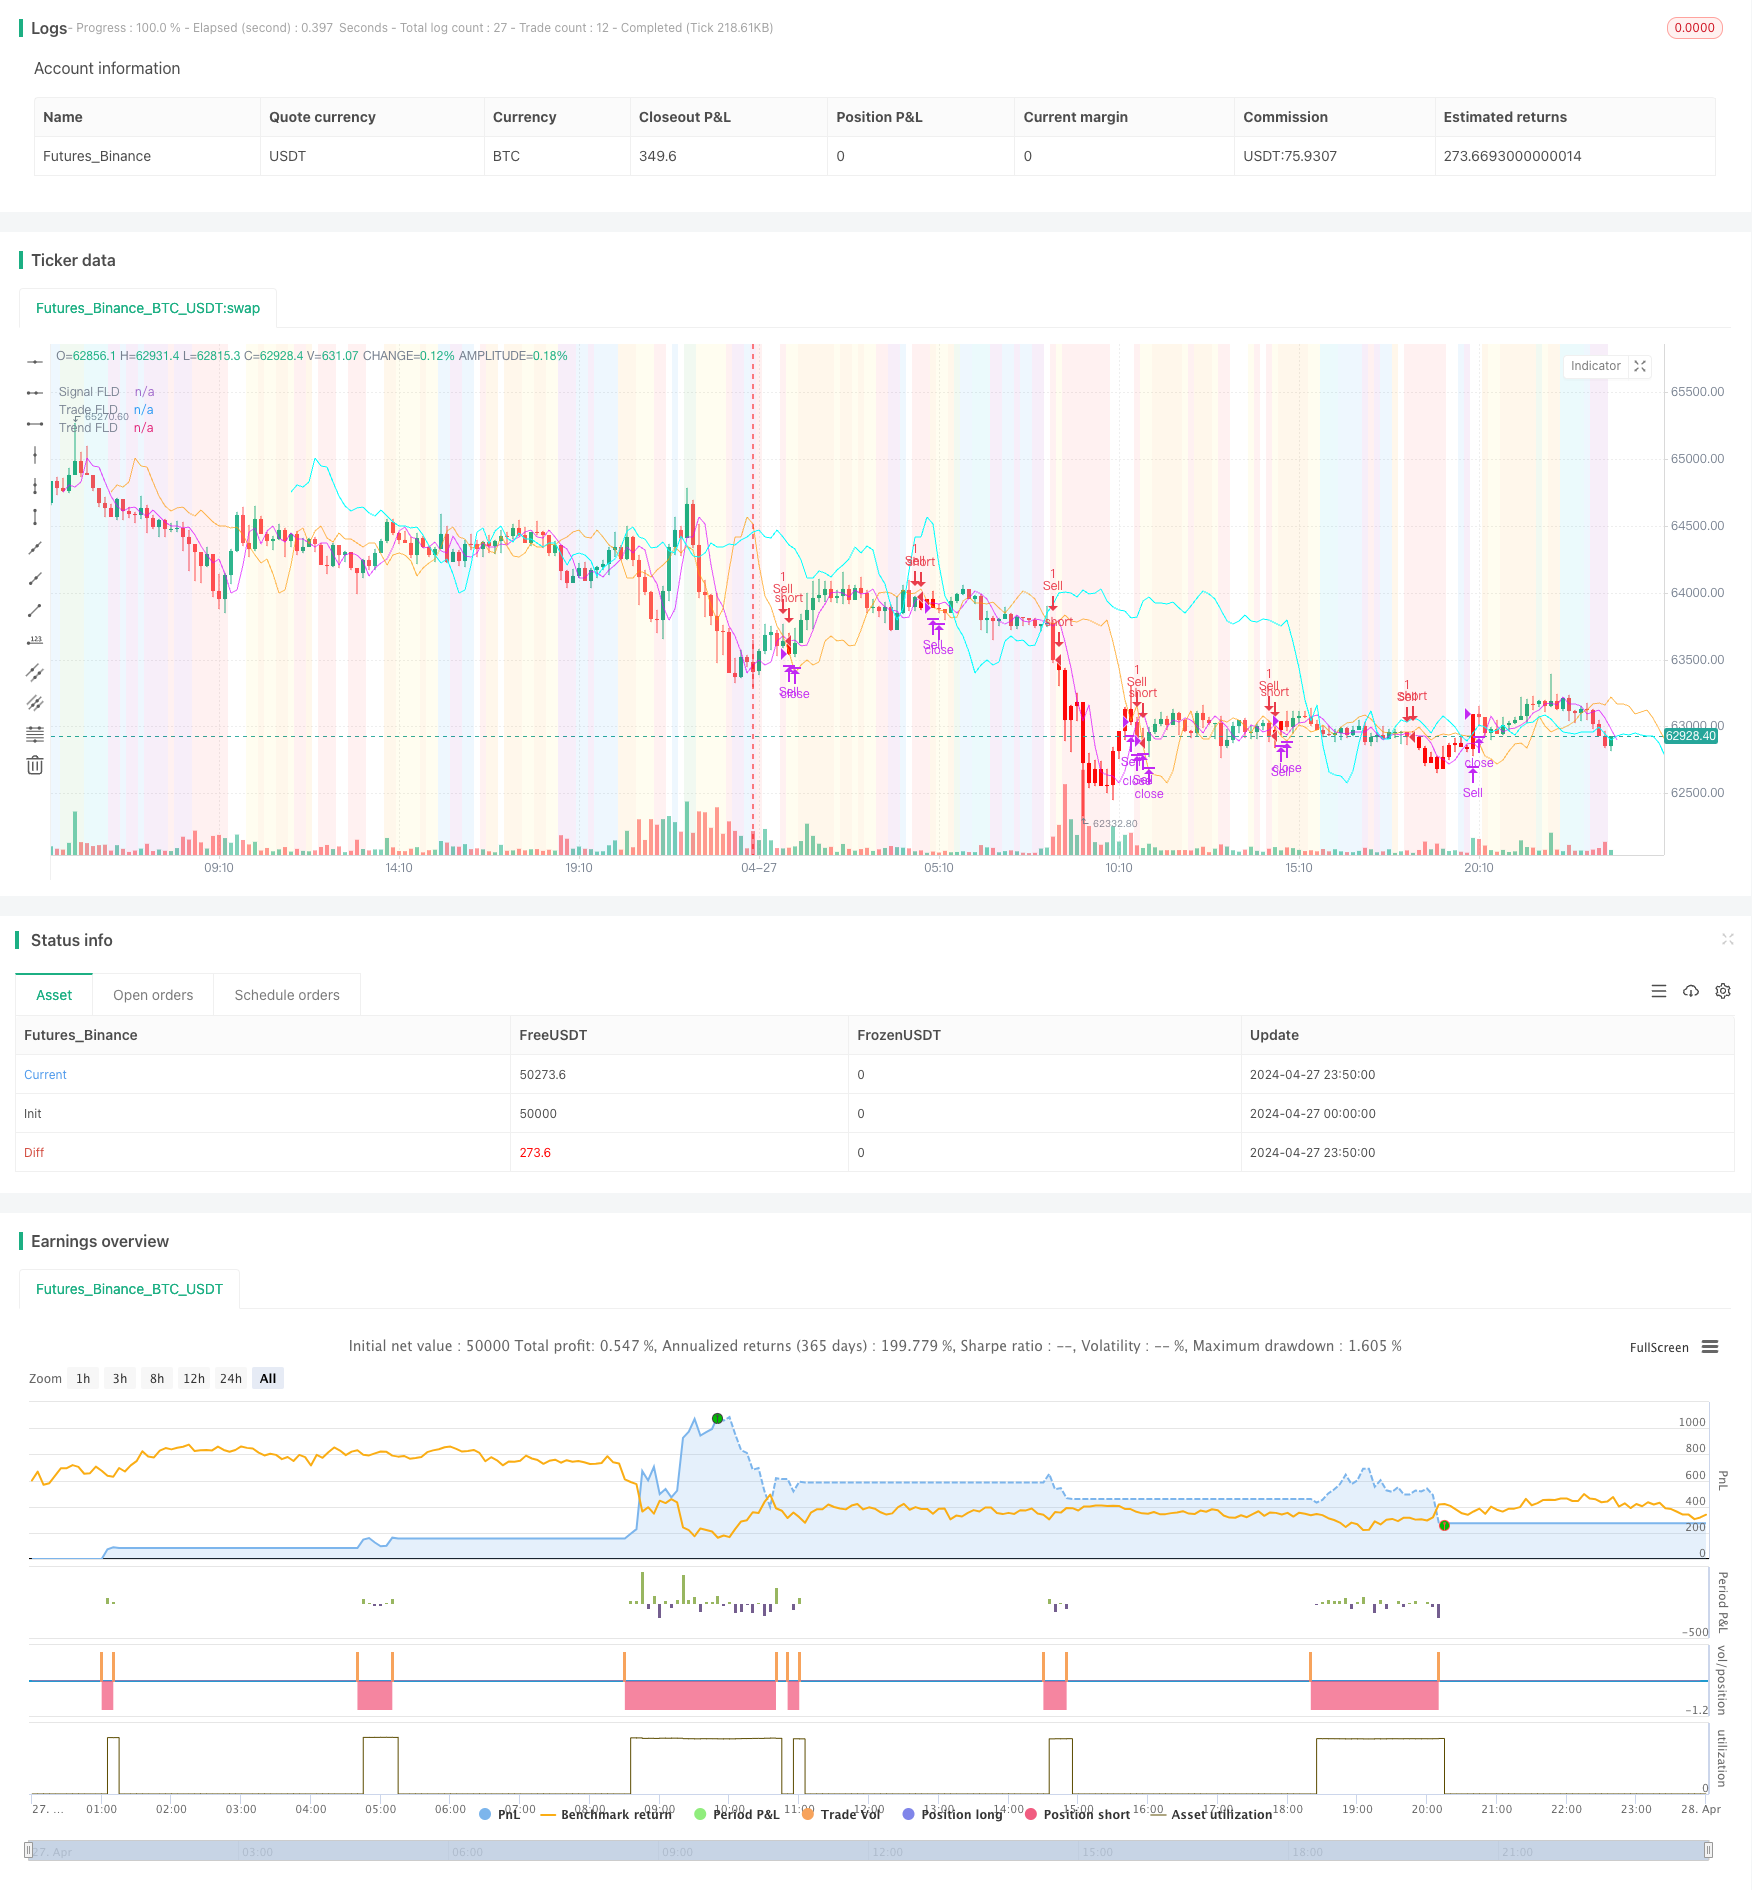
概述
赫斯特未来分界线策略是一种基于J.M.赫斯特在20世纪70年代提出的未来分界线(Future Line of Demarcation, FLD)概念的交易策略。该策略通过在金融图表上绘制一条简单但有深远意义的线,即在时间轴上将价格数据向前偏移半个周期,来预测未来的价格走势。具体来说,该策略主要关注三个赫斯特周期之间的相互作用:信号周期、交易周期和趋势周期。通过观察价格与FLD线的交叉和背离模式,交易者可以判断市场趋势或盘整,并确定进出场点。
策略原理
赫斯特未来分界线策略的核心是将价格数据在时间轴上向前偏移半个周期,构建未来分界线(FLD)。例如,在40天周期的情况下,FLD将通过在图表上将当前价格数据向前移动20天来表示。该策略主要关注三个赫斯特周期:信号周期(默认为20天)、交易周期(默认为20天)和趋势周期(默认为80天)。通过观察价格与这三条FLD线的交叉和背离模式,交易者可以判断市场趋势或盘整。当价格在信号FLD上方,信号FLD在交易FLD上方,交易FLD在趋势FLD上方时,市场处于上升趋势(A阶段);当价格突破信号FLD下方时,市场进入回调(B阶段)。类似地,其他阶段(C到H)也有相应的价格与FLD线的交互模式。该策略还设置了可调的平仓触发器,包括价格、信号FLD、交易FLD或趋势FLD,以确定交易的退出点。
策略优势
赫斯特未来分界线策略的主要优势在于: 1. 简单易懂:该策略基于简单的FLD概念,易于理解和应用。 2. 前瞻性:通过将价格数据向前偏移,FLD提供了对未来价格走势的预测。 3. 多周期分析:该策略结合了三个不同的赫斯特周期,提供了更全面的市场分析。 4. 趋势和盘整识别:通过观察价格与FLD线的交互模式,交易者可以判断市场趋势或盘整。 5. 可定制性:该策略提供了可调的平仓触发器,交易者可以根据自己的偏好设置退出点。
策略风险
尽管赫斯特未来分界线策略有其优势,但也存在一些潜在风险: 1. 参数敏感性:该策略的表现可能对周期长度等参数敏感,不同的参数设置可能导致不同的结果。 2. 市场适应性:该策略可能在某些市场条件下表现欠佳,如趋势不明显或波动剧烈的市场。 3. 滞后性:由于FLD是基于历史数据计算的,因此可能存在一定的滞后性。 4. 过度交易:如果平仓触发器设置不当,可能导致过度交易和高交易成本。
为了缓解这些风险,交易者可以考虑进行参数优化,针对不同市场条件调整策略,并设置适当的止损和风险管理措施。
策略优化方向
赫斯特未来分界线策略可以在以下方面进行优化: 1. 参数优化:对周期长度、平仓触发器等参数进行优化,以提高策略的表现。 2. 多时间框架分析:将该策略应用于不同的时间框架,以获得更全面的市场视角。 3. 与其他指标结合:将FLD与其他技术指标(如移动平均线、振荡器等)结合,以提高信号的可靠性。 4. 风险管理:引入止损和仓位管理机制,以控制风险和优化收益。 5. 市场适应性:针对不同的市场条件(如趋势、震荡等)开发针对性的优化方案。
通过这些优化措施,赫斯特未来分界线策略可以更好地适应不同的市场环境,提高其稳定性和盈利能力。
总结
赫斯特未来分界线策略是一种基于J.M.赫斯特的未来分界线概念的创新交易策略。通过将价格数据向前偏移半个周期,构建未来分界线,并结合三个不同的赫斯特周期(信号周期、交易周期和趋势周期),该策略提供了对未来价格走势的预测。交易者可以通过观察价格与FLD线的交叉和背离模式,判断市场趋势或盘整,并确定进出场点。尽管该策略有其优势,如简单易懂、前瞻性和多周期分析等,但也存在一些潜在风险,如参数敏感性、市场适应性和滞后性等。为了优化该策略,交易者可以考虑参数优化、多时间框架分析、与其他指标结合、风险管理和市场适应性等方面。总的来说,赫斯特未来分界线策略为交易者提供了一种独特的视角和工具,以预测和把握市场机会。
/*backtest
start: 2024-04-27 00:00:00
end: 2024-04-28 00:00:00
period: 10m
basePeriod: 1m
exchanges: [{"eid":"Futures_Binance","currency":"BTC_USDT"}]
*/

// This source code is subject to the terms of the Mozilla Public License 2.0 at https://mozilla.org/MPL/2.0/
// © BarefootJoey

//@version=5
strategy("Hurst Future Lines of Demarcation Strategy", overlay=true)

// FLD Settings
source      = input(ohlc4, 'Source')
smoothFLD   = input.bool(false, 'Smooth FLD')
FLDtransp   = input(33, 'FLD transparency')
FLDsmooth   = input.int(5, "FLD Smoothing", minval=1, tooltip="Number of trading days to smooth the FLD")
FLD_out = ta.sma(source , smoothFLD ? FLDsmooth : 1)

close_buy_in_1 = input.string('Price', 'Input Close Trigger 1', options=['Price', 'Signal', 'Trade', 'Trend', 'None'])
close_buy_in_2 = input.string('Trade', 'Input Close Trigger 2', options=['Price', 'Signal', 'Trade', 'Trend', 'None'])

// Quarter Cycle (Default: 20 day) Length Pivot Cycle
col_q = input.color(#da00ff, "Quarter Cycle Color")
cyc_q = input.int(5, "Signal Cycle Length")
plot(FLD_out, color=color.new(col_q, FLDtransp), title='Signal FLD', offset = math.round(cyc_q/2) )

// Trade Cycle (Default: 20 day) Length Pivot Cycle
col = input.color(#ff9800, "Trade Cycle Color")
cyc = input.int(20, "Trade Cycle Length")
plot(FLD_out, color=color.new(col, FLDtransp), title='Trade FLD', offset = math.round(cyc/2) )

// Double Cycle (Default: 80 day) Length Pivot Cycle
col_d = input.color(color.aqua, "Double Cycle Color")
cyc_d = input.int(80, "Trend Cycle Length")
plot(FLD_out, color=color.new(col_d, FLDtransp), title='Trend FLD', offset = math.round(cyc_d/2) )

// Strategy Plots
price = source
signal = FLD_out[math.round(cyc_q/2)]
trade = FLD_out[math.round(cyc/2)]
trend = FLD_out[math.round(cyc_d/2)]

// Trend State
var state = 0
if signal > trade and trade > trend
    state := 1 // (A)
    state
if state == 1 and price < signal
    state := 2 // (B)
    state
if signal < trade and trade > trend
    state := 3 // (C)
    state
if state == 3 and price < signal
    state := 4 // (D)
    state
if signal < trade and trade < trend
    state := 5 // (E)
    state
if state == 5 and price < signal
    state := 6 // (F)
    state
if signal > trade and trade < trend
    state := 7 // (G)
    state
if state == 7 and price < signal
    state := 8 // (H)
    state
state := state

// Strategy Definitions
close_buy_out_1 = close_buy_in_1 == 'Price' ? price : close_buy_in_1 == 'Signal' ? signal : close_buy_in_1 == 'Trade' ? trade : close_buy_in_1 == 'Trend' ? trend : na
close_buy_out_2 = close_buy_in_2 == 'Price' ? price : close_buy_in_2 == 'Signal' ? signal : close_buy_in_2 == 'Trade' ? trade : close_buy_in_2 == 'Trend' ? trend : na
buy = ta.crossover(price, signal) and state == 1
close_buy = strategy.position_size>0 and ta.crossunder(close_buy_out_1, close_buy_out_2)
sell = ta.crossunder(price, signal) and state == 6
close_sell = strategy.position_size<0 and ta.crossover(close_buy_out_1, close_buy_out_2)

// FLD Interaction State Background
interaction_color = state == 1 ? color.green : // A
  state == 2 ? color.aqua : // B
  state == 3 ? color.blue : // C
  state == 4 ? color.purple : // D
  state == 5 ? color.white : // E
  state == 6 ? color.red :// F
  state == 7 ? color.orange : // G
  state == 8 ? color.yellow : na // H

bgcolor(color.new(interaction_color, 90), title= "A-H Background")

bar_color = strategy.position_size>0 ? #00ff0a : strategy.position_size<0 ? #FF0000 : na
barcolor(bar_color)

if buy
    strategy.entry("Buy", strategy.long)
if close_buy
    strategy.close("Buy", qty_percent=100)

if sell
    strategy.entry("Sell", strategy.short)
if close_sell
    strategy.close("Sell", qty_percent=100)

// EoS made w/ ❤ by @BarefootJoey ✌💗📈