Buy and Sell Volume Heatmap with Real-Time Price Strategy

Overview
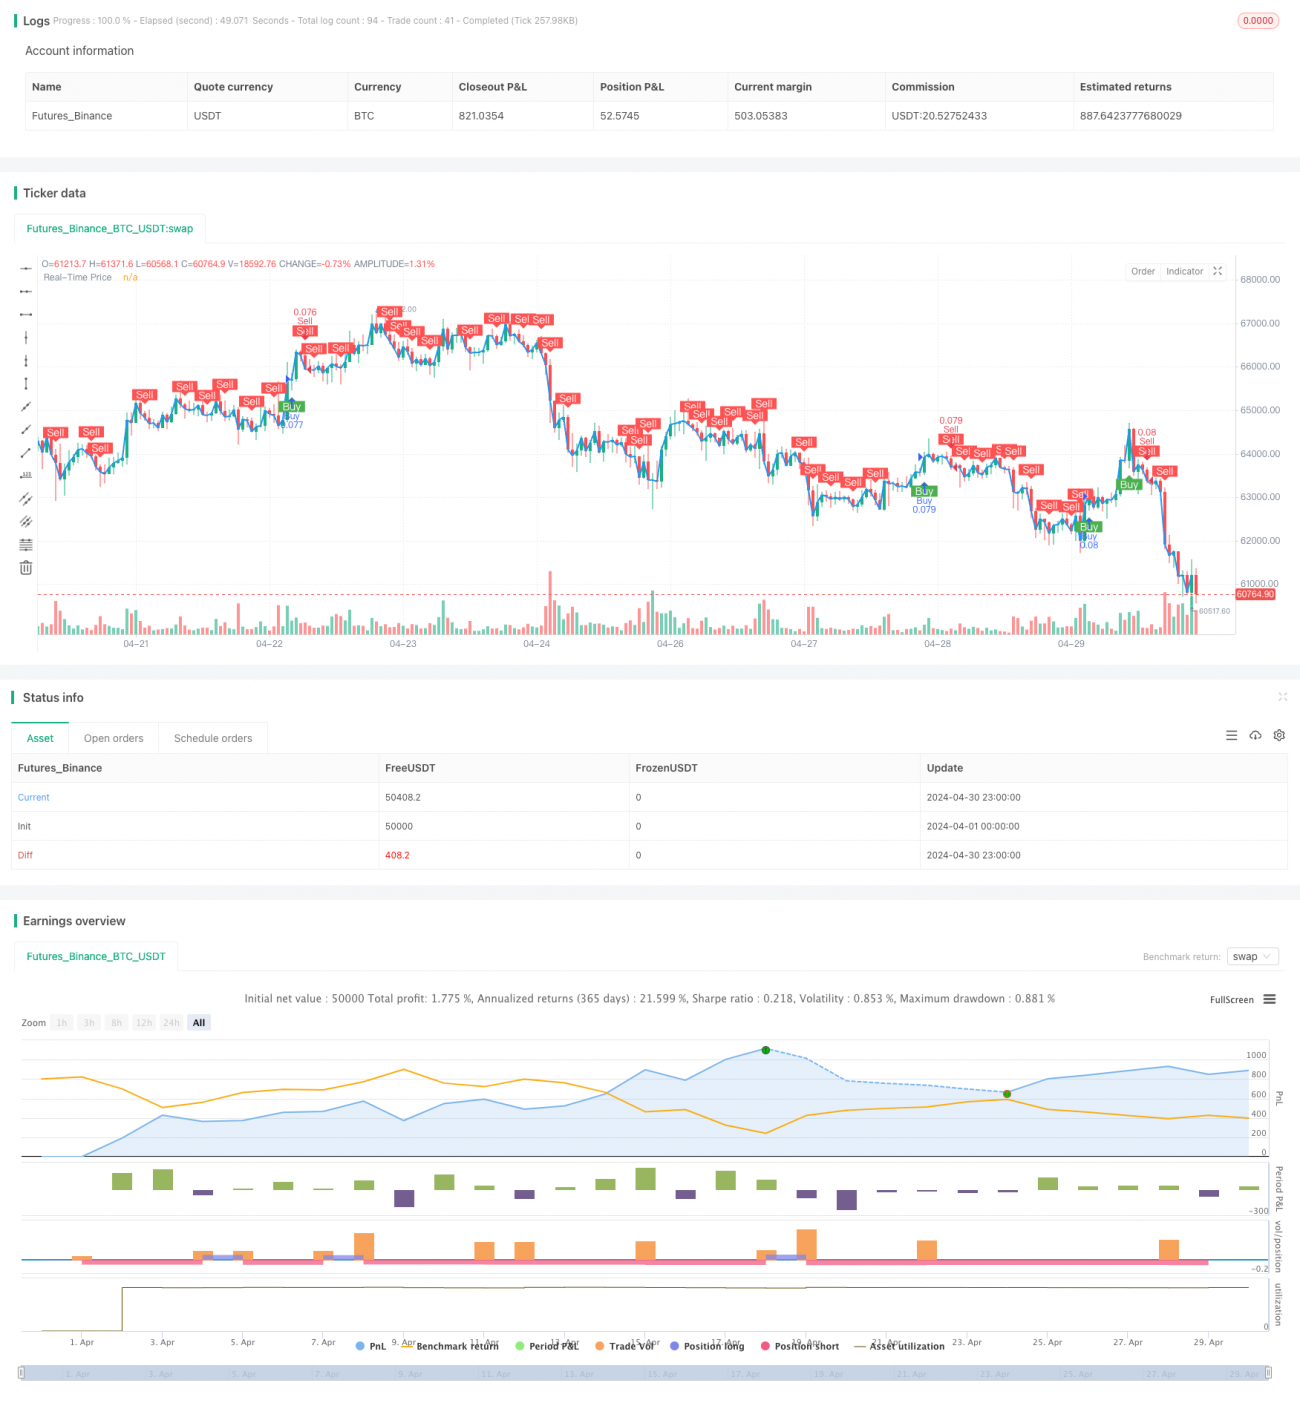
This strategy combines a volume heatmap and real-time price to generate buy and sell signals by analyzing the distribution of price and volume over a certain period. The strategy first calculates several price levels based on the current price and a set price range percentage. It then counts the buy and sell volumes at each price level over a past period and calculates the cumulative buy and sell volumes. The color of the labels is determined based on the cumulative buy and sell volumes. Additionally, the strategy plots the real-time price curve. Moreover, the strategy incorporates indicators such as EMA and VWAP to generate buy and sell signals based on their relationship with price and volume. A buy signal is generated when the buy conditions are met, and no previous signal has occurred. A sell signal is generated when the sell conditions are met, or there are two consecutive red candles, and no previous signal has occurred.
Strategy Principle
- Calculate several price levels based on the current price and a set price range percentage.
- Count the buy and sell volumes at each price level over a past period and calculate the cumulative buy and sell volumes.
- Determine the color of the labels based on the cumulative buy and sell volumes and display the labels or plot shapes.
- Plot the real-time price curve.
- Calculate indicators such as EMA and VWAP.
- Determine whether the buy conditions are met based on the relationship between price and indicators like EMA and VWAP, as well as volume conditions. If met and no previous signal has occurred, generate a buy signal.
- Determine whether the sell conditions are met based on the relationship between price and indicators like EMA, as well as volume conditions. If met and no previous signal has occurred, generate a sell signal. If there are two consecutive red candles and no previous signal has occurred, also generate a sell signal.
- Record the current buy and sell condition states and update the signal occurrence status.
Advantage Analysis
- The combination of volume heatmap and real-time price provides an intuitive display of the price and volume distribution, serving as a reference for trading decisions.
- The incorporation of indicators such as EMA and VWAP enriches the strategy's condition judgment and improves its reliability.
- The strategy considers multiple factors, including price, indicators, and volume, making the buy and sell signals more comprehensive and robust.
- The strategy sets limitations on signal generation to avoid generating repeated signals continuously, reducing misleading signals.
Risk Analysis
- The strategy's performance may be affected by parameter settings such as the price range percentage and lookback period, requiring adjustments and optimizations based on specific situations.
- Indicators like EMA and VWAP have inherent lagging and limitations, which may become ineffective in certain market environments.
- The strategy is mainly suitable for trending markets and may generate more false signals in choppy markets.
- The risk control measures of the strategy are relatively simple, lacking risk management tools such as stop-loss and position sizing.
Optimization Direction
- Introduce more technical indicators and market sentiment indicators, such as RSI, MACD, Bollinger Bands, etc., to enrich the strategy's judgment basis.
- Optimize the conditions for generating buy and sell signals to improve signal accuracy and reliability. Consider incorporating multi-timeframe analysis to confirm trend directions.
- Incorporate risk control measures such as stop-loss and position sizing, setting reasonable stop-loss levels and position sizes to control the risk exposure of individual trades.
- Perform parameter optimization and backtesting on the strategy to find the optimal parameter combinations and market applicability.
- Consider combining this strategy with other strategies to leverage the strengths of different strategies and improve overall stability and profitability.
Summary
This strategy generates buy and sell signals by combining a volume heatmap, real-time price, and multiple technical indicators, providing a certain reference value. The strategy's advantage lies in its ability to intuitively display the price and volume distribution and comprehensively consider multiple factors to generate signals. However, the strategy also has some limitations and risks, such as the impact of parameter settings, the lagging nature of indicators, and the reliance on trending markets. Therefore, in practical applications, further optimization and improvement of the strategy are needed, such as introducing more indicators, optimizing signal conditions, enhancing risk control, etc., to improve the strategy's robustness and profitability.
/*backtest
start: 2024-04-01 00:00:00
end: 2024-04-30 23:59:59
period: 1h
basePeriod: 15m
exchanges: [{"eid":"Futures_Binance","currency":"BTC_USDT"}]
*/

//@version=5
strategy("Buy and Sell Volume Heatmap with Real-Time Price Strategy", overlay=true, default_qty_type=strategy.percent_of_equity, default_qty_value=10)

// Settings for Volume Heatmap- 1