Trend Filtered Pin Bar Reversal Strategy

Overview
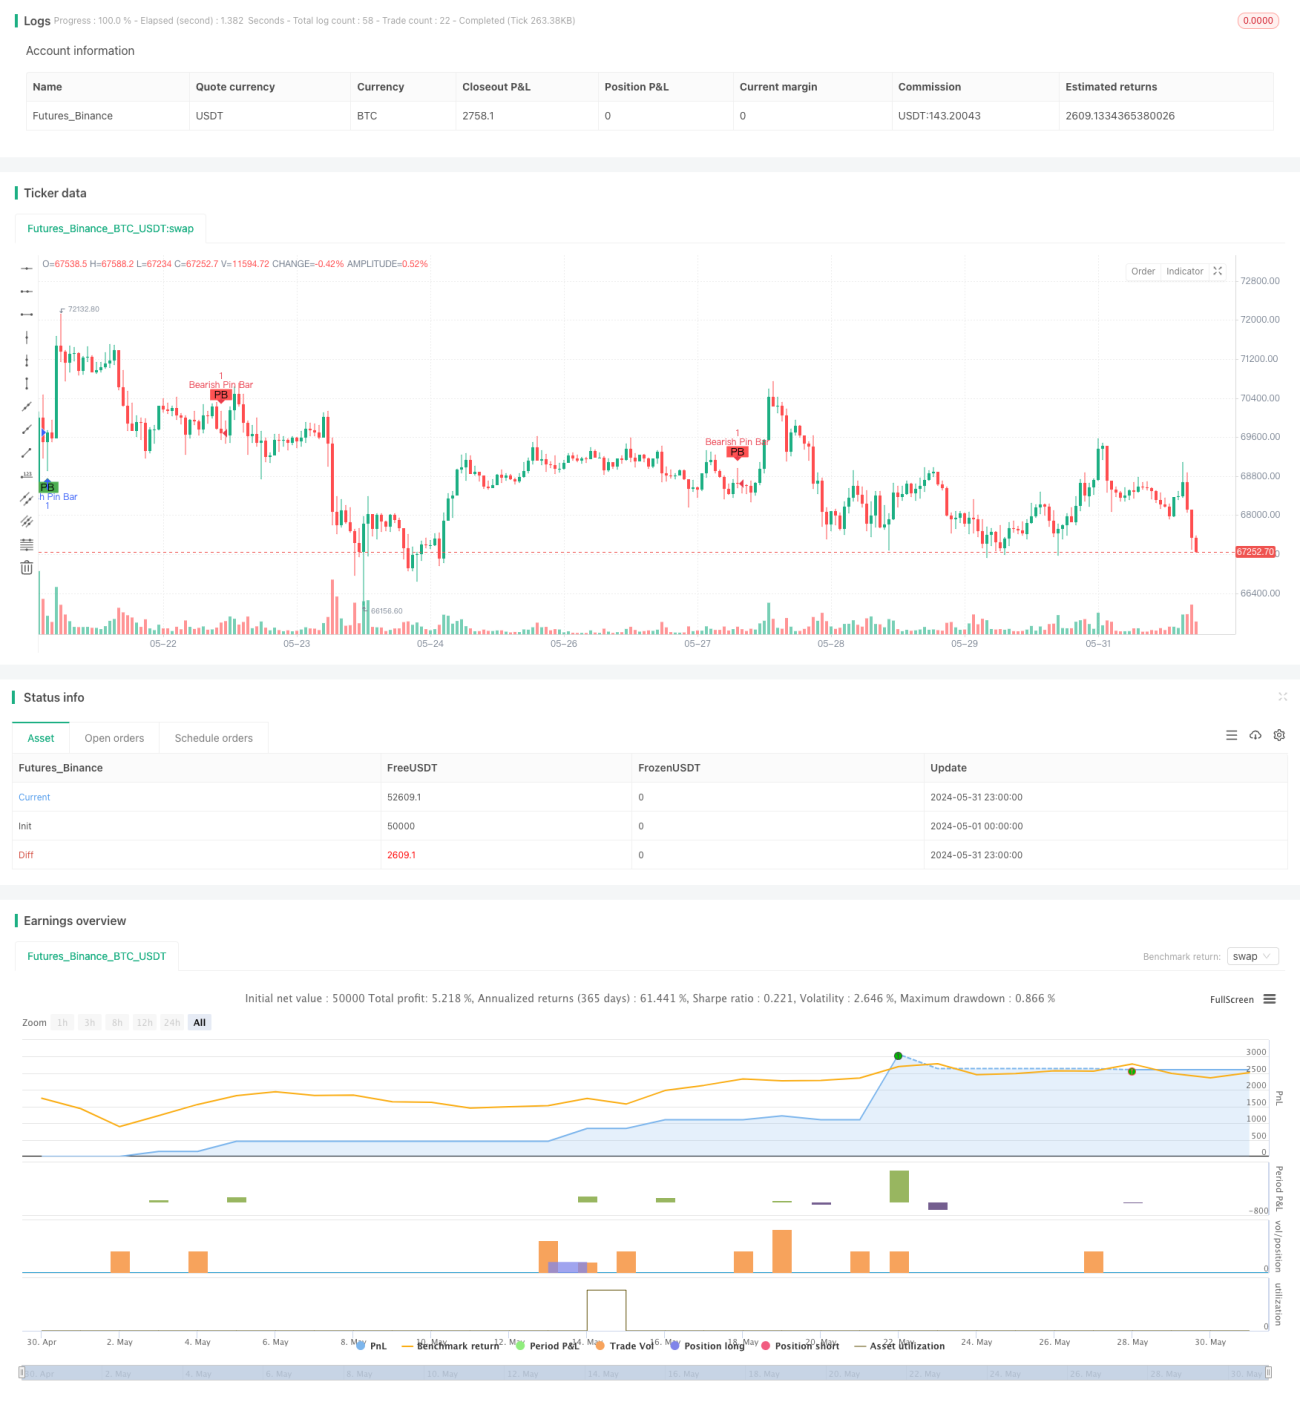
This strategy primarily aims to identify potential market reversal points by recognizing a specific candlestick pattern called the Pin Bar. A Pin Bar is characterized by a long shadow and a small body, indicating significant market volatility at that price level, but ultimately the price retraces, suggesting that the level may act as a support or resistance. The strategy utilizes a 50-period Simple Moving Average (SMA) to determine the current trend direction and a 20-period SMA of volume as a filter, requiring the volume to be above this average for a Pin Bar signal to be considered valid. Additionally, the Relative Strength Index (RSI) is calculated but not directly used in entry/exit conditions, serving instead as an optional further filtering condition.
Strategy Principles
- First, determine the relative size of the Pin Bar's upper and lower shadows and body, requiring the upper or lower shadow to be at least 60% of the entire candlestick's high-low range, while the body should not exceed 30%.
- Compare the closing and opening prices to determine if the Pin Bar is bullish or bearish.
- Use the 50-period SMA to identify the current trend, considering it an uptrend when the closing price is above the SMA and a downtrend when below.
- Set the 20-period volume SMA as the threshold for the volume filter, only considering a Pin Bar signal valid if the volume at its occurrence is greater than this value.
- Plot the identified bullish and bearish Pin Bars.
- Enter a long position when a bullish Pin Bar appears and a short position when a bearish Pin Bar appears.
- Set the stop loss to twice the size of the Pin Bar's body and the take profit to three times. For long positions, place the stop loss below the Pin Bar's low and the take profit above its high; vice versa for short positions.
Advantage Analysis
- The Pin Bar is a highly intuitive and effective price reversal pattern, capable of accurately capturing sudden changes in market sentiment.
- The trend filter ensures that Pin Bar signals align with the current trend direction, significantly improving the signal's win rate.
- The volume condition filters out market noise with insufficient liquidity, ensuring that Pin Bar signals have adequate market participation.
- The stop loss and take profit positions are set based on the Pin Bar's characteristics, providing a reasonable risk-reward ratio.
- The code logic and rules are clear and easy to understand and implement.
Risk Analysis
- The reliability of Pin Bar signals may be greatly diminished in choppy markets, where the trend filter is less effective.
- Pin Bars may fail in the face of exceptionally strong bearish or bullish events.
- The trading frequency is relatively low, potentially leading to insufficient backtest samples.
- Default parameters may require further optimization for specific instruments and timeframes.
- As a single-signal system, the overall risk is relatively high.
Optimization Directions
- Consider introducing other reversal patterns such as Inside Bars to enrich signal sources.
- Use volatility indicators like ATR to dynamically adjust stop loss and take profit positions to adapt to different market conditions.
- Implement a percentage trailing stop to maximize profits.
- Incorporate more fundamental data, such as economic calendars and significant events, to filter out potentially invalid signals.
- Introduce a money management module to control the risk exposure of each trade.
Summary
This Pin Bar reversal strategy employs a simple and effective approach, using trend filtering and volume filtering to improve signal recognition accuracy. Although there is room for improvement, the overall concept is viable and worthy of further optimization and testing. As a classic price pattern, the Pin Bar can also be combined with other indicators or signals to achieve a more robust trading system.
- 1