RSI and AO Synergistic Trend Following Quantitative Trading Strategy

Overview
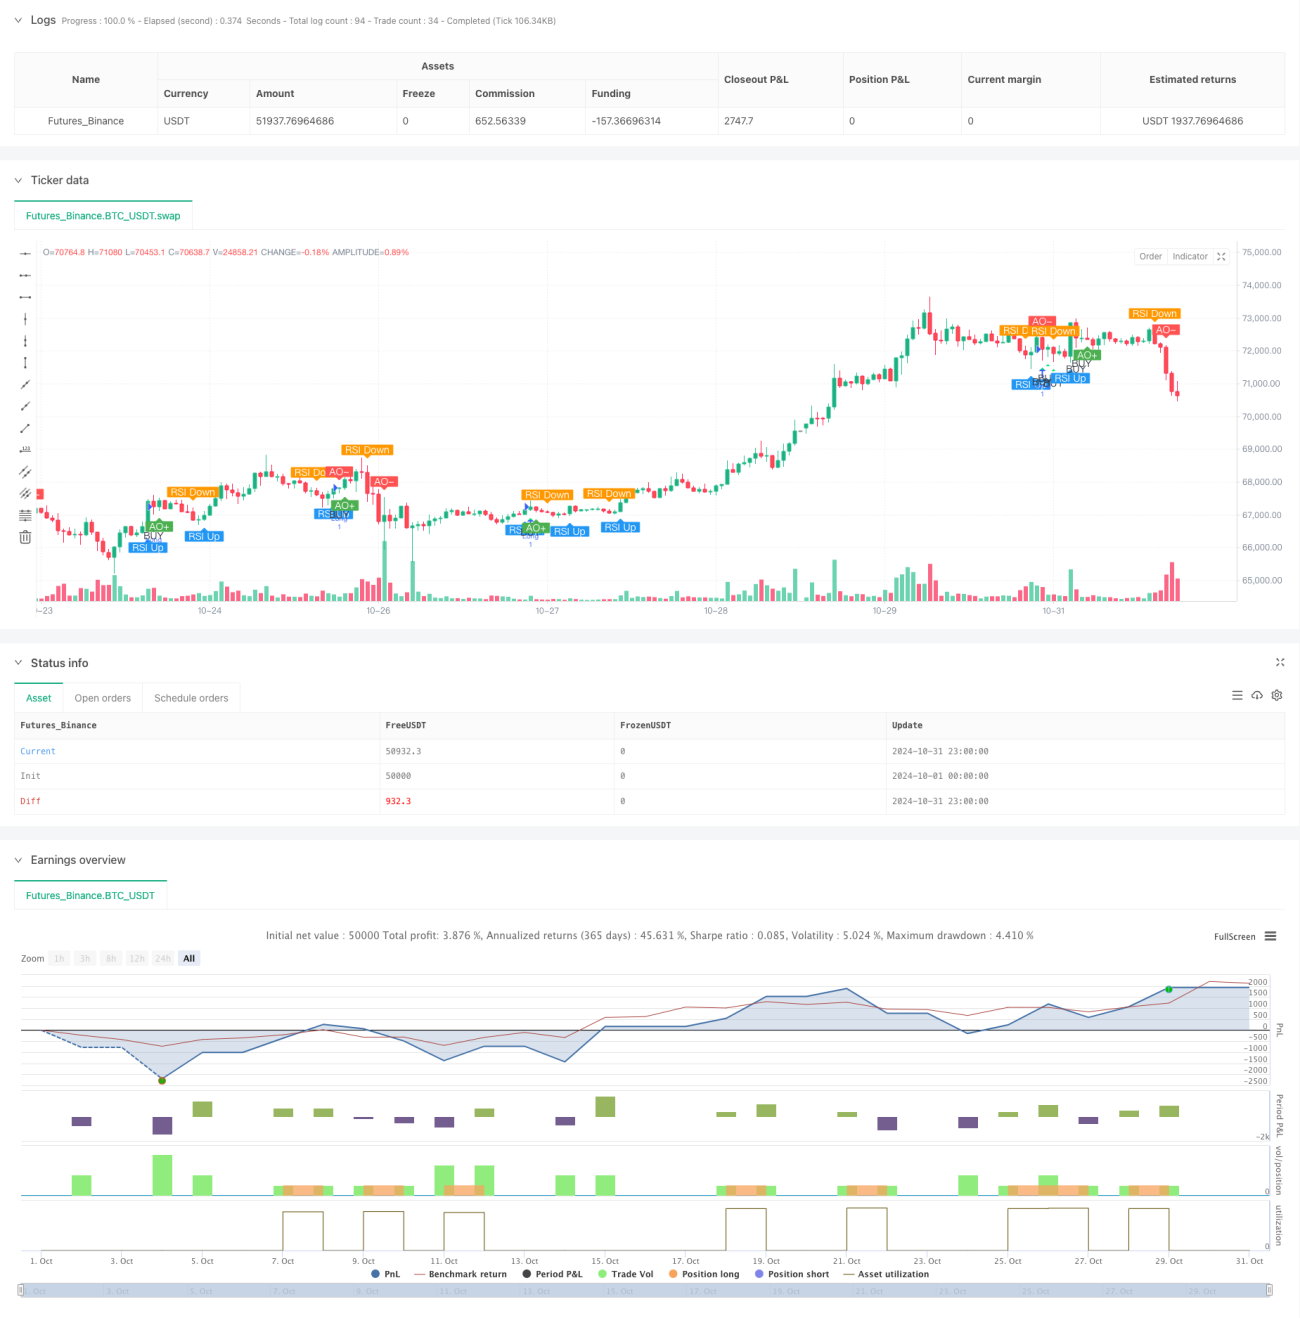
This strategy is a quantitative trading system based on the synergistic effect of the Relative Strength Index (RSI) and Awesome Oscillator (AO). It identifies potential long opportunities by capturing signals when RSI crosses above 50 while AO is in negative territory. The strategy employs percentage-based take profit and stop loss mechanisms for risk management, using 10% of account equity for each trade.
Strategy Principles
The core logic relies on the cooperation of two technical indicators:
- RSI Indicator: Uses 14-period RSI to monitor price momentum, with crossover above 50 indicating established upward momentum.
- AO Indicator: Calculates price momentum by comparing 5-period and 34-period moving averages, with negative values indicating oversold market conditions.
- Entry Conditions: Long positions are opened when RSI crosses above 50 and AO is negative, capturing potential reversals in oversold areas.
- Exit Conditions: Implements 2% take profit and 1% stop loss settings to maintain reasonable risk-reward ratios.
Strategy Advantages
- High Signal Reliability: Dual confirmation through RSI and AO enhances trading signal reliability.
- Comprehensive Risk Control: Fixed percentage-based take profit and stop loss effectively control per-trade risk.
- Scientific Money Management: Uses fixed proportion of account equity, avoiding excessive leverage.
- Clear Logic: Strategy rules are intuitive and easy to understand and execute.
- Good Visualization: Various signals are clearly marked on charts for easy identification and confirmation.
Strategy Risks
- False Breakout Risk: RSI crossing 50 may produce false signals, requiring additional technical confirmation.
- Tight Stop Loss: 1% stop loss might be too tight for market volatility.
- Unidirectional Trading Limitation: Strategy only takes long positions, missing opportunities in bear markets.
- Slippage Impact: May face significant slippage risk during high volatility periods.
- Parameter Sensitivity: Strategy performance highly depends on RSI and AO parameter settings.
Optimization Directions
- Signal Filtering: Suggest adding volume confirmation mechanism to improve signal reliability.
- Dynamic Stop Loss: Consider replacing fixed stops with trailing stops for better profit protection.
- Parameter Optimization: Recommend historical backtesting for RSI and AO parameters.
- Market Selection: Add market trend analysis to only trade during upward trends.
- Position Sizing: Consider dynamic position sizing based on signal strength.
Summary
This trend-following strategy combines RSI and AO indicators to capture long opportunities during oversold reversals. While well-designed with proper risk management, there's room for optimization. Traders should conduct thorough backtesting before live implementation and adjust parameters according to market conditions. The strategy is suitable for traders with higher risk tolerance and good understanding of technical analysis.
/*backtest
start: 2024-10-01 00:00:00
end: 2024-10-31 23:59:59
period: 1h
basePeriod: 1h
exchanges: [{"eid":"Futures_Binance","currency":"BTC_USDT"}]
*/

//@version=5
strategy(title="🐂 BUY Only - RSI Crossing 50 + AO Negative", shorttitle="🐂 AO<0 RSI+50 Strategy", overlay=true)

// ------------------------------ 1